Cosmetic Tubes Market Size and Share Forecast Outlook 2025 to 2035

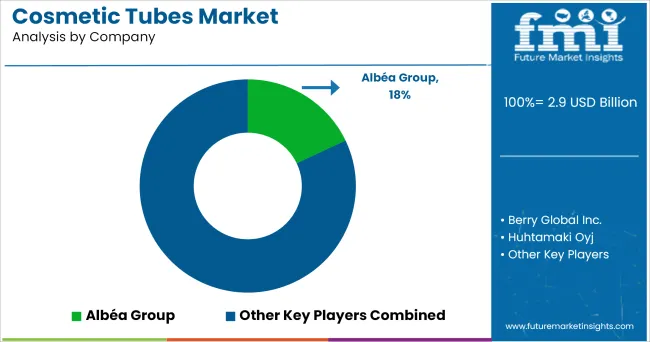
The Cosmetic Tubes Market is estimated at USD 2.9 billion in 2025 and is projected to reach USD 4.6 billion by 2035, reflecting a CAGR of 4.7% between 2025 and 2035. The parent market, Cosmetic Packaging, is valued at USD 35.8 billion in 2025, placing tubes at a 8.1% share of total packaging demand by value.
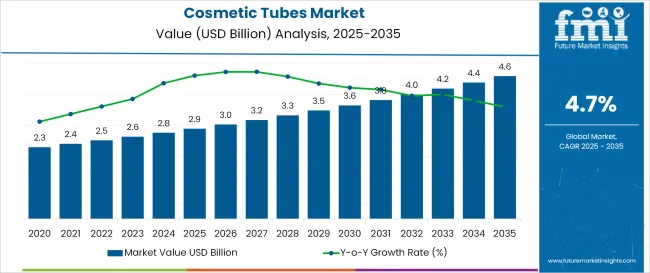
Quick Stats - Cosmetic Tubes Market

  • Value of Market (2025): USD 2.9 Billion
  • Projected Value Market (2035): USD 4.6 Billion
  • Forecast CAGR Market (2025 to 2035): 4.7%
  • Largest segment by Capacity Type: Below 50 ml holds 40%
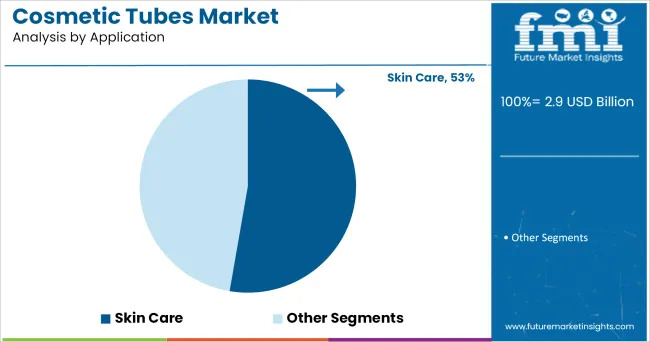
  • Largest segment by Application: Skin Care accounts for 53%
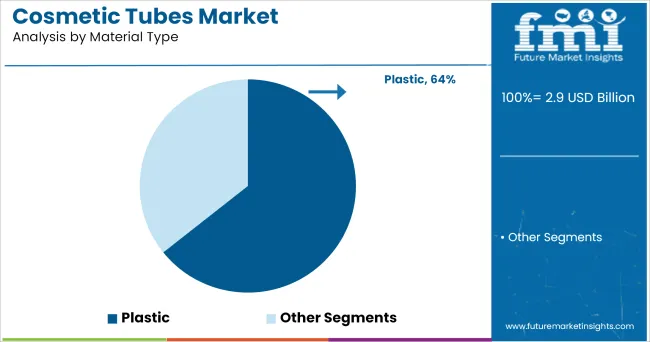
  • Largest segment by Material Type: Plastic represents 64%
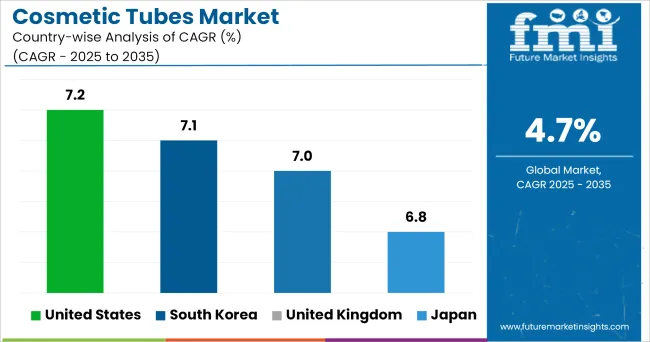
  • Most lucrative market: United States, with a CAGR of 7.2%
  • Fastest-growing market: South Korea, with a CAGR of 7.1%

Cosmetic Tubes Market

Metric Value
Market Size in 2025 USD 2.9 Billion
Projected Market Size in 2035 USD 4.6 Billion
CAGR (2025 to 2035) 4.7%

Demand for cosmetic tubes continues to rise with growing consumption of skincare and personal grooming products, particularly in portable and single-use formats. Urban millennials and Gen Z consumers favor compact packaging for moisturizers, cleansers, and creams, prompting manufacturers to standardize tubes across retail and e-commerce SKUs. The surge in on-the-go routines and travel-sized formats in Asia and North America has expanded baseline volume uptake across mid-tier brands and private labels.

However, high material volatility, especially in plastics and laminates, continues to exert pressure on packaging converters. Regulatory shifts around single-use plastic bans in the EU, Canada, and select Asian economies have added compliance costs and limited flexibility in raw material sourcing. Moreover, recycling challenges for multi-layered tubes constrain circular economy targets, slowing down adoption among sustainability-first brands despite consumer demand.

Opportunities emerge from innovations in mono-material tube designs and biodegradable options using PLA and sugarcane-derived materials. These solutions are gaining traction among premium skincare and dermo-cosmetic brands, particularly in France, Japan, and South Korea. Airless tube variants are also seeing wider uptake in formulations with actives, as brands seek to preserve shelf life and minimize contamination risk.

One clear trend is the tiered shift toward customization and high-decoration tubes across prestige brands, with digital printing and metallic foils increasingly replacing label-based SKUs. While mass-market brands prioritize function and cost, niche and indie players are investing in tactile finishes and proprietary dispensing closures-reshaping the unit economics of tube manufacturing across both contract and in-house setups.

Analyzing Cosmetic Tubes Market by Top Investment Segments

The global cosmetic tubes market is analyzed by key investment segments as follows: by Capacity Type; Below 50 ml; 50-100 ml; 100-150 ml; 150 to 200 ml; Above 200 ml; by Material Type; Plastic; Aluminum; Laminated; by Application; Skin Care; Hair Care; Make-Up; Others; and by Region; North America; Latin America; Western Europe; Eastern Europe; East Asia; South Asia & Pacific; Middle East & Africa.
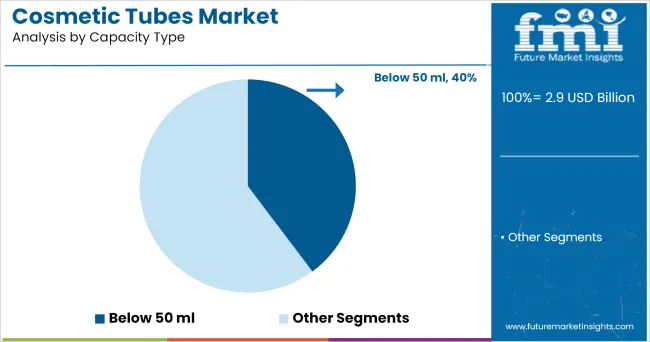
Capacity Type - Below 50 ml Leads with 40% Share in 2025

Cosmetic Tubes Market Analysis By Capacity Type

Below 50 ml tubes hold a dominant 40% share in 2025, supported by their widespread use in sample packaging, travel-size formats, and premium skincare serums. Brands favor this size for trial conversion and compactness in retail sets, particularly in facial care. Growth is sustained by consumer demand for convenience, portability, and product hygiene.

Rising adoption of minimalist skincare routines limits product volume usage, while the push for multi-SKU beauty kits expands demand for small-capacity packaging across both mass and luxury tiers. However, recyclability remains constrained due to small formats being excluded from some municipal collection streams.

Mono-material redesigns in this size bracket-especially PP-based tubes-are driving cost savings and end-of-life recovery rates, making them more appealing to eco-conscious brands. These formats are increasingly used in influencer gifting, dermocosmetic samples, and K-beauty lines focused on efficacy over volume.
  • Popular in anti-aging kits and travel retail
  • Favored by direct-to-consumer indie brands
  • Limited refill potential restricts long-term adoption

Material Type - Plastic Holds 64% Share in 2025

Cosmetic Tubes Market Analysis By Material Type

Plastic dominates the cosmetic tubes market with a 64% share in 2025, owing to its low cost, moldability, and compatibility with a wide range of formulations. HDPE and LDPE variants remain the default materials for skin and hair care applications, especially in mass and masstige segments. Flexible production scalability also supports short-run customization and multi-shade cosmetic SKUs.

However, mounting scrutiny over plastic waste and evolving Extended Producer Responsibility (EPR) norms in the EU and Asia are compelling brands to explore alternatives. Laminated and aluminum variants gain share slowly, though pricing and compatibility constraints persist.

The shift toward recyclable mono-material plastics, including PP-only and PE-based tubes, is accelerating. Brands pursuing sustainability claims without disrupting existing lines are opting for these plug-and-play substitutes, leading to a 2x increase in mono-material SKUs between 2022 and 2025.
  • Preferred for moisturizers, gels, and cleansers
  • E-commerce resilience due to shatterproof form
  • Barriers exist in high-acid or oil-rich formulations

Application - Skin Care Dominates with 53% Share in 2025

Cosmetic Tubes Market Analysis By Application

Skin care applications account for 53% of the cosmetic tubes market in 2025, led by moisturizers, sunscreens, cleansers, and acne treatments. The format offers controlled dispensing, portability, and hygiene, essential for active ingredient-based formulations in both daily care and dermo-cosmetic routines.

Demand is propelled by the rising adoption of structured skin regimens, especially across urban consumers in Asia and North America. However, market saturation in basic moisturizers and price sensitivity in emerging economies limit volume expansion for standard SKUs.

Ingredient-forward brands are leveraging airless tubes to improve shelf-life and product efficacy, particularly in retinol and vitamin C-based products. These tubes allow oxygen protection and minimize contact exposure, enabling cleaner-label claims and justifying price premiums.
  • Dominates in private-label and dermatology-backed products
  • Custom-printed tubes preferred for brand differentiation
  • Regulatory push for SPF disclosure driving reformulation in packaging

Cosmetic Tubes Market Analysis by Top Countries

Cosmetic Tubes Market Cagr Analysis By Country

Across the top-performing economies, the cosmetic tubes market is evolving beyond basic packaging into a tool for product experience and differentiation. In the United States, the strategic shift toward DTC and clean beauty has increased demand for mono-material and airless tubes that align with efficacy and recycling claims. South Korea’s dominance stems from its role as a global incubator of format innovation-its brands aggressively prototype travel-sized and multi-step regimen tubes that are quickly replicated in ASEAN and Western markets.

The UK market reflects consolidation among private-label and prestige skincare players, with squeezable tubes preferred for mid-tier dermocosmetics. Japan’s ageing demographic and clinical skincare preferences fuel demand for functional tubes with barrier protection, minimal design, and hygienic dispensing. These markets signal a strategic pivot toward smaller capacities, digitally printed tubes, and packaging-integrated storytelling-each reinforcing brand value while navigating material regulations and consumer scrutiny.

United States Cosmetic Tubes Market Reshaped by Rise of DTC-First Beauty Brands

In the USA, the cosmetic tubes market is being reshaped by the rise of DTC-first beauty brands and dermatologist-led formulations. Tubes have become the default for high-active skincare, especially in formats that emphasize hygiene and portability-traits essential for retinol, niacinamide, and SPF products. Airless and soft-touch laminate tubes are gaining traction as brands prioritize perceived safety and shelf-life extension.

Regulatory momentum around recyclability is pushing even mass-market players to shift from multi-layer formats to mono-material alternatives. While traditional brands still dominate volume, indie and wellness-aligned entrants are influencing aesthetic, closure, and sizing norms, particularly in facial care and under-eye treatments.

  • Airless tube adoption in premium SPF and serum segments
  • Mono-material shift driven by state-level recycling mandates
  • Custom-printed DTC tubes blurring lines between product and branding

South Korea Cosmetic Tubes Sales Forecast

South Korea’s cosmetic tubes market is driven by its role as a global trendsetter in packaging miniaturization and functional aesthetics. The country’s beauty brands-especially in K-beauty-are deploying tubes not just for practicality but as a core part of storytelling, often pairing multi-step regimens with color-coded, travel-sized tubes.

Refillable and dual-chamber tubes are emerging in anti-aging and brightening lines, targeting consumers who demand precision dosing. While PET and laminated tubes still dominate, there's rapid uptake of bio-based materials in SKUs aimed at export markets. Regulatory soft nudges favor local sourcing and recyclability, prompting converters to invest in localized mono-material lines.

  • Multi-SKU regimen packaging creating bundling opportunities
  • Bio-based plastics gain traction for global-facing K-beauty brands
  • Innovation focused on dual-use, applicator-integrated tubes

United Kingdom Cosmetic Tubes Demand Analysis

In the UK, the cosmetic tubes market reflects a dual-track evolution: cost-conscious private labels expanding in volume, while prestige and ethical brands redefine tube design with sustainability front and center. Post-Brexit compliance complexity has prompted local sourcing of tube materials and simplified construction to ease recyclability across EU and UK systems.

Functional simplicity-especially in single-layer PP and PE tubes-has gained preference among brands targeting natural or dermatological positioning. Meanwhile, refillable tubes and click-on applicators are being piloted in high-street chains and boutique lines, supported by rising consumer preference for waste reduction and minimalism.

  • Private-label demand driving high-volume, low-cost tube supply
  • Sustainability claims reshaping material choices and closures
  • Retailers piloting refillable SKUs in facial and hand care ranges

Japan Cosmetic Tubes Market Analysis

Japan’s cosmetic tubes market is shaped by precision, aesthetics, and aging-skin functionality. Local consumers prioritize controlled application, tactile feedback, and discreet packaging-making soft-squeeze tubes with narrow tips or metal roller-ball heads highly favored in eye creams and spot treatments.

With a strong domestic base in skin-calming and anti-aging formulas, Japanese brands tend to invest in tubes that preserve product integrity, often opting for multi-layered barrier formats despite recyclability trade-offs. Regulatory preferences for minimal labeling and subdued design are influencing a rise in UV-blocking and matte-finish laminates. Innovation centers around ergonomic dispensing and compact, refillable formats that suit an aging, space-conscious consumer base.
  • Tactile and ergonomic dispensing preferred in senior-targeted skincare
  • Barrier laminates retained for active preservation despite EPR pressures
  • Low-contrast, matte-printed tubes dominating dermo-cosmetic aisles

Cosmetic Tubes Market Players and their Strategies

Cosmetic Tubes Market Analysis By Company

The players in the cosmetic tubes market are focusing on mono-material innovation, airless dispensing, and advanced printing to align with evolving regulatory norms and brand aesthetics. Tier 1 companies such as Albéa Group, Huhtamaki, and Berry Global are expanding their recyclable tube portfolios and investing in digital printing capabilities for personalization at scale. These firms maintain global supply partnerships with premium and mass-market brands, leveraging vertically integrated operations and early compliance with EU plastic mandates.

Tier 2 players-including companies like Essel Propack (now EPL Limited), Viva Group, and Tubopress-are targeting mid-market brands with cost-effective laminated and extruded tubes. Their agility in short-run orders and regional customization helps address fast-moving skincare lines, particularly in South Asia and Eastern Europe. Many are shifting toward localized production to offset logistics volatility and meet traceability requirements.

Startups and niche converters are emerging with disruptive propositions-such as refillable applicator tubes, biodegradable formats, and bio-based resins for green-certified cosmetics. While volumes remain small, these players are attracting partnerships with clean beauty and DTC brands seeking novel packaging identities. As EPR laws tighten and consumers demand both function and ethics, players that combine design flexibility with recyclability are poised to outperform laggards focused solely on cost.

Key Players

  • Albéa Group
  • Berry Global Inc.
  • Huhtamaki Oyj
  • EPL Limited (formerly Essel Propack)
  • Viva Group
  • CCL Industries
  • Montebello Packaging
  • Tubopress
  • CTL Packaging
  • Linhardt GmbH & Co. KG

Report Scope

Metric Details
Market Size 2025 USD 2.9 Billion
Market Size 2035 USD 4.6 Billion
CAGR (2025 to 2035) 4.7%
Base Year 2025
Forecast Period 2025 to 2035
Historical Data 2020 to 2024
Units USD Billion (Revenue-based)
Regions Covered North America, Latin America, Western Europe, Eastern Europe, East Asia, South Asia & Pacific, Middle East & Africa
Countries Analyzed United States, South Korea, United Kingdom, Japan
Segments Covered By Capacity Type, By Material Type, By Application
Capacity Type Below 50 ml; 50-100 ml; 100-150 ml; 150 to 200 ml; Above 200 ml
Material Type Plastic; Aluminum; Laminated
Application Skin Care; Hair Care; Make-Up; Others
Key Players Albéa Group, Berry Global Inc., Huhtamaki Oyj, EPL Limited, Viva Group, CCL Industries, Montebello Packaging, Tubopress, CTL Packaging, Linhardt GmbH & Co. KG

Cosmetic Tubes Market Segmentation

By Capacity Type:

  • Below 50 ml
  • 50 ml - 100 ml
  • 100 ml - 150 ml
  • 150 ml - 200 ml
  • Above 200 ml

By Material Type:

  • Plastic
  • Aluminum
  • Laminated

By Application:

  • Skin Care
  • Hair Care
  • Make Up
  • Others (Nail Care & Hygiene Products)

By Region:

  • North America
  • Latin America
  • East Asia
  • South Asia & Pacific
  • Eastern Europe
  • Western Europe
  • Middle East & Africa

Table of Content

  1. Executive Summary
    • Global Market Outlook
    • Demand-side Trends
    • Supply-side Trends
    • Technology Roadmap Analysis
    • Analysis and Recommendations
  2. Market Overview
    • Market Coverage / Taxonomy
    • Market Definition / Scope / Limitations
  3. Market Background
    • Market Dynamics
      • Drivers
      • Restraints
      • Opportunity
      • Trends
    • Scenario Forecast
      • Demand in Optimistic Scenario
      • Demand in Likely Scenario
      • Demand in Conservative Scenario
    • Opportunity Map Analysis
    • Product Life Cycle Analysis
    • Supply Chain Analysis
      • Supply Side Participants and their Roles
        • Producers
        • Mid-Level Participants (Traders/ Agents/ Brokers)
        • Wholesalers and Distributors
      • Value Added and Value Created at Node in the Supply Chain
      • List of Raw Material Suppliers
      • List of Existing and Potential Buyer’s
    • Investment Feasibility Matrix
    • Value Chain Analysis
      • Profit Margin Analysis
      • Wholesalers and Distributors
      • Retailers
    • PESTLE and Porter’s Analysis
    • Regulatory Landscape
      • By Key Regions
      • By Key Countries
    • Regional Parent Market Outlook
    • Production and Consumption Statistics
    • Import and Export Statistics
  4. Global Market Analysis 2020 to 2024 and Forecast, 2025 to 2035
    • Historical Market Size Value (USD Billion) & Volume (Units) Analysis, 2020 to 2024
    • Current and Future Market Size Value (USD Billion) & Volume (Units) Projections, 2025 to 2035
      • Y-o-Y Growth Trend Analysis
      • Absolute $ Opportunity Analysis
  5. Global Market Pricing Analysis 2020 to 2024 and Forecast 2025 to 2035
  6. Global Market Analysis 2020 to 2024 and Forecast 2025 to 2035, By Capacity Type
    • Introduction / Key Findings
    • Historical Market Size Value (USD Billion) & Volume (Units) Analysis By Capacity Type, 2020 to 2024
    • Current and Future Market Size Value (USD Billion) & Volume (Units) Analysis and Forecast By Capacity Type, 2025 to 2035
      • Below 50 ml
      • 50 ml - 100 ml
      • 100 ml - 150 ml
      • 150 ml - 200 ml
      • Above 200 ml
    • Y-o-Y Growth Trend Analysis By Capacity Type, 2020 to 2024
    • Absolute $ Opportunity Analysis By Capacity Type, 2025 to 2035
  7. Global Market Analysis 2020 to 2024 and Forecast 2025 to 2035, By Material Type
    • Introduction / Key Findings
    • Historical Market Size Value (USD Billion) & Volume (Units) Analysis By Material Type, 2020 to 2024
    • Current and Future Market Size Value (USD Billion) & Volume (Units) Analysis and Forecast By Material Type, 2025 to 2035
      • Plastic
      • Aluminum
      • Laminated
    • Y-o-Y Growth Trend Analysis By Material Type, 2020 to 2024
    • Absolute $ Opportunity Analysis By Material Type, 2025 to 2035
  8. Global Market Analysis 2020 to 2024 and Forecast 2025 to 2035, By Application
    • Introduction / Key Findings
    • Historical Market Size Value (USD Billion) & Volume (Units) Analysis By Application, 2020 to 2024
    • Current and Future Market Size Value (USD Billion) & Volume (Units) Analysis and Forecast By Application, 2025 to 2035
      • Skin Care
      • Hair Care
      • Make Up
      • Others (Nail Care & Hygiene Products)
    • Y-o-Y Growth Trend Analysis By Application, 2020 to 2024
    • Absolute $ Opportunity Analysis By Application, 2025 to 2035
  9. Global Market Analysis 2020 to 2024 and Forecast 2025 to 2035, By Region
    • Introduction
    • Historical Market Size Value (USD Billion) & Volume (Units) Analysis By Region, 2020 to 2024
    • Current Market Size Value (USD Billion) & Volume (Units) Analysis and Forecast By Region, 2025 to 2035
      • North America
      • Latin America
      • Western Europe
      • Eastern Europe
      • East Asia
      • South Asia & Pacific
      • Middle East and Africa
    • Market Attractiveness Analysis By Region
  10. North America Market Analysis 2020 to 2024 and Forecast 2025 to 2035, By Country
    • Historical Market Size Value (USD Billion) & Volume (Units) Trend Analysis By Market Taxonomy, 2020 to 2024
    • Market Size Value (USD Billion) & Volume (Units) Forecast By Market Taxonomy, 2025 to 2035
      • By Country
        • USA
        • Canada
        • Mexico
      • By Capacity Type
      • By Material Type
      • By Application
    • Market Attractiveness Analysis
      • By Country
      • By Capacity Type
      • By Material Type
      • By Application
    • Key Takeaways
  11. Latin America Market Analysis 2020 to 2024 and Forecast 2025 to 2035, By Country
    • Historical Market Size Value (USD Billion) & Volume (Units) Trend Analysis By Market Taxonomy, 2020 to 2024
    • Market Size Value (USD Billion) & Volume (Units) Forecast By Market Taxonomy, 2025 to 2035
      • By Country
        • Brazil
        • Argentina
        • Rest of LATAM
      • By Capacity Type
      • By Material Type
      • By Application
    • Market Attractiveness Analysis
      • By Country
      • By Capacity Type
      • By Material Type
      • By Application
    • Key Takeaways
  12. Western Europe Market Analysis 2020 to 2024 and Forecast 2025 to 2035, By Country
    • Historical Market Size Value (USD Billion) & Volume (Units) Trend Analysis By Market Taxonomy, 2020 to 2024
    • Market Size Value (USD Billion) & Volume (Units) Forecast By Market Taxonomy, 2025 to 2035
      • By Country
        • Germany
        • Italy
        • France
        • UK
        • Spain
        • BENELUX
        • Nordic
        • Rest of W.Europe
      • By Capacity Type
      • By Material Type
      • By Application
    • Market Attractiveness Analysis
      • By Country
      • By Capacity Type
      • By Material Type
      • By Application
    • Key Takeaways
  13. Eastern Europe Market Analysis 2020 to 2024 and Forecast 2025 to 2035, By Country
    • Historical Market Size Value (USD Billion) & Volume (Units) Trend Analysis By Market Taxonomy, 2020 to 2024
    • Market Size Value (USD Billion) & Volume (Units) Forecast By Market Taxonomy, 2025 to 2035
      • By Country
        • Russia
        • Hungary
        • Poland
        • Balkan & Baltics
        • Rest of E. Europe
      • By Capacity Type
      • By Material Type
      • By Application
    • Market Attractiveness Analysis
      • By Country
      • By Capacity Type
      • By Material Type
      • By Application
    • Key Takeaways
  14. East Asia Market Analysis 2020 to 2024 and Forecast 2025 to 2035, By Country
    • Historical Market Size Value (USD Billion) & Volume (Units) Trend Analysis By Market Taxonomy, 2020 to 2024
    • Market Size Value (USD Billion) & Volume (Units) Forecast By Market Taxonomy, 2025 to 2035
      • By Country
        • China
        • Japan
        • South Korea
      • By Capacity Type
      • By Material Type
      • By Application
    • Market Attractiveness Analysis
      • By Country
      • By Capacity Type
      • By Material Type
      • By Application
    • Key Takeaways
  15. South Asia & Pacific Market Analysis 2020 to 2024 and Forecast 2025 to 2035, By Country
    • Historical Market Size Value (USD Billion) & Volume (Units) Trend Analysis By Market Taxonomy, 2020 to 2024
    • Market Size Value (USD Billion) & Volume (Units) Forecast By Market Taxonomy, 2025 to 2035
      • By Country
        • India
        • Australia & New Zealand
        • ASEAN
        • Rest of SAP
      • By Capacity Type
      • By Material Type
      • By Application
    • Market Attractiveness Analysis
      • By Country
      • By Capacity Type
      • By Material Type
      • By Application
    • Key Takeaways
  16. Middle East and Africa Market Analysis 2020 to 2024 and Forecast 2025 to 2035, By Country
    • Historical Market Size Value (USD Billion) & Volume (Units) Trend Analysis By Market Taxonomy, 2020 to 2024
    • Market Size Value (USD Billion) & Volume (Units) Forecast By Market Taxonomy, 2025 to 2035
      • By Country
        • GCC Countries
        • Northern Africa
        • South Africa
        • Turkiye
        • Rest of MEA
      • By Capacity Type
      • By Material Type
      • By Application
    • Market Attractiveness Analysis
      • By Country
      • By Capacity Type
      • By Material Type
      • By Application
    • Key Takeaways
  17. Key Countries Market Analysis
    • USA
      • Pricing Analysis
      • Market Share Analysis, 2024
        • By Capacity Type
        • By Material Type
        • By Application
    • Canada
      • Pricing Analysis
      • Market Share Analysis, 2024
        • By Capacity Type
        • By Material Type
        • By Application
    • Brazil
      • Pricing Analysis
      • Market Share Analysis, 2024
        • By Capacity Type
        • By Material Type
        • By Application
    • Mexico
      • Pricing Analysis
      • Market Share Analysis, 2024
        • By Capacity Type
        • By Material Type
        • By Application
    • Argentina
      • Pricing Analysis
      • Market Share Analysis, 2024
        • By Capacity Type
        • By Material Type
        • By Application
  18. Market Structure Analysis
    • Competition Dashboard
    • Competition Benchmarking
    • Market Share Analysis of Top Players
      • By Regional
      • By Capacity Type
      • By Material Type
      • By Application
  19. Competition Analysis
    • Competition Deep Dive
      • Albéa Group
        • Overview
        • Product Portfolio
        • Profitability by Market Segments (Product/Age /Sales Channel/Region)
        • Sales Footprint
        • Strategy Overview
          • Marketing Strategy
          • Product Strategy
          • Channel Strategy
      • Berry Global Inc.
        • Overview
        • Product Portfolio
        • Profitability by Market Segments (Product/Age /Sales Channel/Region)
        • Sales Footprint
        • Strategy Overview
          • Marketing Strategy
          • Product Strategy
          • Channel Strategy
      • Huhtamaki Oyj
        • Overview
        • Product Portfolio
        • Profitability by Market Segments (Product/Age /Sales Channel/Region)
        • Sales Footprint
        • Strategy Overview
          • Marketing Strategy
          • Product Strategy
          • Channel Strategy
      • CCL Industries Inc.
        • Overview
        • Product Portfolio
        • Profitability by Market Segments (Product/Age /Sales Channel/Region)
        • Sales Footprint
        • Strategy Overview
          • Marketing Strategy
          • Product Strategy
          • Channel Strategy
      • Montebello Packaging
        • Overview
        • Product Portfolio
        • Profitability by Market Segments (Product/Age /Sales Channel/Region)
        • Sales Footprint
        • Strategy Overview
          • Marketing Strategy
          • Product Strategy
          • Channel Strategy
      • Neopac
        • Overview
        • Product Portfolio
        • Profitability by Market Segments (Product/Age /Sales Channel/Region)
        • Sales Footprint
        • Strategy Overview
          • Marketing Strategy
          • Product Strategy
          • Channel Strategy
      • Skypack India
        • Overview
        • Product Portfolio
        • Profitability by Market Segments (Product/Age /Sales Channel/Region)
        • Sales Footprint
        • Strategy Overview
          • Marketing Strategy
          • Product Strategy
          • Channel Strategy
      • Essel Propack (now EPL Ltd.)
        • Overview
        • Product Portfolio
        • Profitability by Market Segments (Product/Age /Sales Channel/Region)
        • Sales Footprint
        • Strategy Overview
          • Marketing Strategy
          • Product Strategy
          • Channel Strategy
      • CTL Packaging
        • Overview
        • Product Portfolio
        • Profitability by Market Segments (Product/Age /Sales Channel/Region)
        • Sales Footprint
        • Strategy Overview
          • Marketing Strategy
          • Product Strategy
          • Channel Strategy
      • Guangzhou Lisson Packaging
        • Overview
        • Product Portfolio
        • Profitability by Market Segments (Product/Age /Sales Channel/Region)
        • Sales Footprint
        • Strategy Overview
          • Marketing Strategy
          • Product Strategy
          • Channel Strategy
  20. Assumptions & Acronyms Used
  21. Research Methodology

List of Tables

  • Table 1: Global Market Value (USD Billion) Forecast by Region, 2020 to 2035
  • Table 2: Global Market Volume (Units) Forecast by Region, 2020 to 2035
  • Table 3: Global Market Value (USD Billion) Forecast by Capacity Type, 2020 to 2035
  • Table 4: Global Market Volume (Units) Forecast by Capacity Type, 2020 to 2035
  • Table 5: Global Market Value (USD Billion) Forecast by Material Type, 2020 to 2035
  • Table 6: Global Market Volume (Units) Forecast by Material Type, 2020 to 2035
  • Table 7: Global Market Value (USD Billion) Forecast by Application, 2020 to 2035
  • Table 8: Global Market Volume (Units) Forecast by Application, 2020 to 2035
  • Table 9: North America Market Value (USD Billion) Forecast by Country, 2020 to 2035
  • Table 10: North America Market Volume (Units) Forecast by Country, 2020 to 2035
  • Table 11: North America Market Value (USD Billion) Forecast by Capacity Type, 2020 to 2035
  • Table 12: North America Market Volume (Units) Forecast by Capacity Type, 2020 to 2035
  • Table 13: North America Market Value (USD Billion) Forecast by Material Type, 2020 to 2035
  • Table 14: North America Market Volume (Units) Forecast by Material Type, 2020 to 2035
  • Table 15: North America Market Value (USD Billion) Forecast by Application, 2020 to 2035
  • Table 16: North America Market Volume (Units) Forecast by Application, 2020 to 2035
  • Table 17: Latin America Market Value (USD Billion) Forecast by Country, 2020 to 2035
  • Table 18: Latin America Market Volume (Units) Forecast by Country, 2020 to 2035
  • Table 19: Latin America Market Value (USD Billion) Forecast by Capacity Type, 2020 to 2035
  • Table 20: Latin America Market Volume (Units) Forecast by Capacity Type, 2020 to 2035
  • Table 21: Latin America Market Value (USD Billion) Forecast by Material Type, 2020 to 2035
  • Table 22: Latin America Market Volume (Units) Forecast by Material Type, 2020 to 2035
  • Table 23: Latin America Market Value (USD Billion) Forecast by Application, 2020 to 2035
  • Table 24: Latin America Market Volume (Units) Forecast by Application, 2020 to 2035
  • Table 25: Western Europe Market Value (USD Billion) Forecast by Country, 2020 to 2035
  • Table 26: Western Europe Market Volume (Units) Forecast by Country, 2020 to 2035
  • Table 27: Western Europe Market Value (USD Billion) Forecast by Capacity Type, 2020 to 2035
  • Table 28: Western Europe Market Volume (Units) Forecast by Capacity Type, 2020 to 2035
  • Table 29: Western Europe Market Value (USD Billion) Forecast by Material Type, 2020 to 2035
  • Table 30: Western Europe Market Volume (Units) Forecast by Material Type, 2020 to 2035
  • Table 31: Western Europe Market Value (USD Billion) Forecast by Application, 2020 to 2035
  • Table 32: Western Europe Market Volume (Units) Forecast by Application, 2020 to 2035
  • Table 33: Eastern Europe Market Value (USD Billion) Forecast by Country, 2020 to 2035
  • Table 34: Eastern Europe Market Volume (Units) Forecast by Country, 2020 to 2035
  • Table 35: Eastern Europe Market Value (USD Billion) Forecast by Capacity Type, 2020 to 2035
  • Table 36: Eastern Europe Market Volume (Units) Forecast by Capacity Type, 2020 to 2035
  • Table 37: Eastern Europe Market Value (USD Billion) Forecast by Material Type, 2020 to 2035
  • Table 38: Eastern Europe Market Volume (Units) Forecast by Material Type, 2020 to 2035
  • Table 39: Eastern Europe Market Value (USD Billion) Forecast by Application, 2020 to 2035
  • Table 40: Eastern Europe Market Volume (Units) Forecast by Application, 2020 to 2035
  • Table 41: East Asia Market Value (USD Billion) Forecast by Country, 2020 to 2035
  • Table 42: East Asia Market Volume (Units) Forecast by Country, 2020 to 2035
  • Table 43: East Asia Market Value (USD Billion) Forecast by Capacity Type, 2020 to 2035
  • Table 44: East Asia Market Volume (Units) Forecast by Capacity Type, 2020 to 2035
  • Table 45: East Asia Market Value (USD Billion) Forecast by Material Type, 2020 to 2035
  • Table 46: East Asia Market Volume (Units) Forecast by Material Type, 2020 to 2035
  • Table 47: East Asia Market Value (USD Billion) Forecast by Application, 2020 to 2035
  • Table 48: East Asia Market Volume (Units) Forecast by Application, 2020 to 2035
  • Table 49: South Asia & Pacific Market Value (USD Billion) Forecast by Country, 2020 to 2035
  • Table 50: South Asia & Pacific Market Volume (Units) Forecast by Country, 2020 to 2035
  • Table 51: South Asia & Pacific Market Value (USD Billion) Forecast by Capacity Type, 2020 to 2035
  • Table 52: South Asia & Pacific Market Volume (Units) Forecast by Capacity Type, 2020 to 2035
  • Table 53: South Asia & Pacific Market Value (USD Billion) Forecast by Material Type, 2020 to 2035
  • Table 54: South Asia & Pacific Market Volume (Units) Forecast by Material Type, 2020 to 2035
  • Table 55: South Asia & Pacific Market Value (USD Billion) Forecast by Application, 2020 to 2035
  • Table 56: South Asia & Pacific Market Volume (Units) Forecast by Application, 2020 to 2035
  • Table 57: Middle East and Africa Market Value (USD Billion) Forecast by Country, 2020 to 2035
  • Table 58: Middle East and Africa Market Volume (Units) Forecast by Country, 2020 to 2035
  • Table 59: Middle East and Africa Market Value (USD Billion) Forecast by Capacity Type, 2020 to 2035
  • Table 60: Middle East and Africa Market Volume (Units) Forecast by Capacity Type, 2020 to 2035
  • Table 61: Middle East and Africa Market Value (USD Billion) Forecast by Material Type, 2020 to 2035
  • Table 62: Middle East and Africa Market Volume (Units) Forecast by Material Type, 2020 to 2035
  • Table 63: Middle East and Africa Market Value (USD Billion) Forecast by Application, 2020 to 2035
  • Table 64: Middle East and Africa Market Volume (Units) Forecast by Application, 2020 to 2035

List of Figures

  • Figure 1: Global Market Volume (Units) Forecast 2020 to 2035
  • Figure 2: Global Market Pricing Analysis
  • Figure 3: Global Market Value (USD Billion) Forecast 2020 to 2035
  • Figure 4: Global Market Value Share and BPS Analysis by Capacity Type, 2025 and 2035
  • Figure 5: Global Market Y-o-Y Growth Comparison by Capacity Type, 2025 to 2035
  • Figure 6: Global Market Attractiveness Analysis by Capacity Type
  • Figure 7: Global Market Value Share and BPS Analysis by Material Type, 2025 and 2035
  • Figure 8: Global Market Y-o-Y Growth Comparison by Material Type, 2025 to 2035
  • Figure 9: Global Market Attractiveness Analysis by Material Type
  • Figure 10: Global Market Value Share and BPS Analysis by Application, 2025 and 2035
  • Figure 11: Global Market Y-o-Y Growth Comparison by Application, 2025 to 2035
  • Figure 12: Global Market Attractiveness Analysis by Application
  • Figure 13: Global Market Value (USD Billion) Share and BPS Analysis by Region, 2025 and 2035
  • Figure 14: Global Market Y-o-Y Growth Comparison by Region, 2025 to 2035
  • Figure 15: Global Market Attractiveness Analysis by Region
  • Figure 16: North America Market Incremental $ Opportunity, 2025 to 2035
  • Figure 17: Latin America Market Incremental $ Opportunity, 2025 to 2035
  • Figure 18: Western Europe Market Incremental $ Opportunity, 2025 to 2035
  • Figure 19: Eastern Europe Market Incremental $ Opportunity, 2025 to 2035
  • Figure 20: East Asia Market Incremental $ Opportunity, 2025 to 2035
  • Figure 21: South Asia & Pacific Market Incremental $ Opportunity, 2025 to 2035
  • Figure 22: Middle East and Africa Market Incremental $ Opportunity, 2025 to 2035
  • Figure 23: North America Market Value Share and BPS Analysis by Country, 2025 and 2035
  • Figure 24: North America Market Value Share and BPS Analysis by Capacity Type, 2025 and 2035
  • Figure 25: North America Market Y-o-Y Growth Comparison by Capacity Type, 2025 to 2035
  • Figure 26: North America Market Attractiveness Analysis by Capacity Type
  • Figure 27: North America Market Value Share and BPS Analysis by Material Type, 2025 and 2035
  • Figure 28: North America Market Y-o-Y Growth Comparison by Material Type, 2025 to 2035
  • Figure 29: North America Market Attractiveness Analysis by Material Type
  • Figure 30: North America Market Value Share and BPS Analysis by Application, 2025 and 2035
  • Figure 31: North America Market Y-o-Y Growth Comparison by Application, 2025 to 2035
  • Figure 32: North America Market Attractiveness Analysis by Application
  • Figure 33: Latin America Market Value Share and BPS Analysis by Country, 2025 and 2035
  • Figure 34: Latin America Market Value Share and BPS Analysis by Capacity Type, 2025 and 2035
  • Figure 35: Latin America Market Y-o-Y Growth Comparison by Capacity Type, 2025 to 2035
  • Figure 36: Latin America Market Attractiveness Analysis by Capacity Type
  • Figure 37: Latin America Market Value Share and BPS Analysis by Material Type, 2025 and 2035
  • Figure 38: Latin America Market Y-o-Y Growth Comparison by Material Type, 2025 to 2035
  • Figure 39: Latin America Market Attractiveness Analysis by Material Type
  • Figure 40: Latin America Market Value Share and BPS Analysis by Application, 2025 and 2035
  • Figure 41: Latin America Market Y-o-Y Growth Comparison by Application, 2025 to 2035
  • Figure 42: Latin America Market Attractiveness Analysis by Application
  • Figure 43: Western Europe Market Value Share and BPS Analysis by Country, 2025 and 2035
  • Figure 44: Western Europe Market Value Share and BPS Analysis by Capacity Type, 2025 and 2035
  • Figure 45: Western Europe Market Y-o-Y Growth Comparison by Capacity Type, 2025 to 2035
  • Figure 46: Western Europe Market Attractiveness Analysis by Capacity Type
  • Figure 47: Western Europe Market Value Share and BPS Analysis by Material Type, 2025 and 2035
  • Figure 48: Western Europe Market Y-o-Y Growth Comparison by Material Type, 2025 to 2035
  • Figure 49: Western Europe Market Attractiveness Analysis by Material Type
  • Figure 50: Western Europe Market Value Share and BPS Analysis by Application, 2025 and 2035
  • Figure 51: Western Europe Market Y-o-Y Growth Comparison by Application, 2025 to 2035
  • Figure 52: Western Europe Market Attractiveness Analysis by Application
  • Figure 53: Eastern Europe Market Value Share and BPS Analysis by Country, 2025 and 2035
  • Figure 54: Eastern Europe Market Value Share and BPS Analysis by Capacity Type, 2025 and 2035
  • Figure 55: Eastern Europe Market Y-o-Y Growth Comparison by Capacity Type, 2025 to 2035
  • Figure 56: Eastern Europe Market Attractiveness Analysis by Capacity Type
  • Figure 57: Eastern Europe Market Value Share and BPS Analysis by Material Type, 2025 and 2035
  • Figure 58: Eastern Europe Market Y-o-Y Growth Comparison by Material Type, 2025 to 2035
  • Figure 59: Eastern Europe Market Attractiveness Analysis by Material Type
  • Figure 60: Eastern Europe Market Value Share and BPS Analysis by Application, 2025 and 2035
  • Figure 61: Eastern Europe Market Y-o-Y Growth Comparison by Application, 2025 to 2035
  • Figure 62: Eastern Europe Market Attractiveness Analysis by Application
  • Figure 63: East Asia Market Value Share and BPS Analysis by Country, 2025 and 2035
  • Figure 64: East Asia Market Value Share and BPS Analysis by Capacity Type, 2025 and 2035
  • Figure 65: East Asia Market Y-o-Y Growth Comparison by Capacity Type, 2025 to 2035
  • Figure 66: East Asia Market Attractiveness Analysis by Capacity Type
  • Figure 67: East Asia Market Value Share and BPS Analysis by Material Type, 2025 and 2035
  • Figure 68: East Asia Market Y-o-Y Growth Comparison by Material Type, 2025 to 2035
  • Figure 69: East Asia Market Attractiveness Analysis by Material Type
  • Figure 70: East Asia Market Value Share and BPS Analysis by Application, 2025 and 2035
  • Figure 71: East Asia Market Y-o-Y Growth Comparison by Application, 2025 to 2035
  • Figure 72: East Asia Market Attractiveness Analysis by Application
  • Figure 73: South Asia & Pacific Market Value Share and BPS Analysis by Country, 2025 and 2035
  • Figure 74: South Asia & Pacific Market Value Share and BPS Analysis by Capacity Type, 2025 and 2035
  • Figure 75: South Asia & Pacific Market Y-o-Y Growth Comparison by Capacity Type, 2025 to 2035
  • Figure 76: South Asia & Pacific Market Attractiveness Analysis by Capacity Type
  • Figure 77: South Asia & Pacific Market Value Share and BPS Analysis by Material Type, 2025 and 2035
  • Figure 78: South Asia & Pacific Market Y-o-Y Growth Comparison by Material Type, 2025 to 2035
  • Figure 79: South Asia & Pacific Market Attractiveness Analysis by Material Type
  • Figure 80: South Asia & Pacific Market Value Share and BPS Analysis by Application, 2025 and 2035
  • Figure 81: South Asia & Pacific Market Y-o-Y Growth Comparison by Application, 2025 to 2035
  • Figure 82: South Asia & Pacific Market Attractiveness Analysis by Application
  • Figure 83: Middle East and Africa Market Value Share and BPS Analysis by Country, 2025 and 2035
  • Figure 84: Middle East and Africa Market Value Share and BPS Analysis by Capacity Type, 2025 and 2035
  • Figure 85: Middle East and Africa Market Y-o-Y Growth Comparison by Capacity Type, 2025 to 2035
  • Figure 86: Middle East and Africa Market Attractiveness Analysis by Capacity Type
  • Figure 87: Middle East and Africa Market Value Share and BPS Analysis by Material Type, 2025 and 2035
  • Figure 88: Middle East and Africa Market Y-o-Y Growth Comparison by Material Type, 2025 to 2035
  • Figure 89: Middle East and Africa Market Attractiveness Analysis by Material Type
  • Figure 90: Middle East and Africa Market Value Share and BPS Analysis by Application, 2025 and 2035
  • Figure 91: Middle East and Africa Market Y-o-Y Growth Comparison by Application, 2025 to 2035
  • Figure 92: Middle East and Africa Market Attractiveness Analysis by Application
  • Figure 93: Global Market - Tier Structure Analysis
  • Figure 94: Global Market - Company Share Analysis

Frequently Asked Questions

What is the size of the cosmetic tubes market in 2025?

The cosmetic tubes market is estimated at USD 2.9 billion in 2025.

What is the expected CAGR for the cosmetic tubes market from 2025 to 2035?

The cosmetic tubes market is projected to grow at a CAGR of 4.7% between 2025 and 2035.

Which application dominates the cosmetic tubes market?

Skin care leads the cosmetic tubes market with a 53% share in 2025.

Who are the top players in the cosmetic tubes market?

Key players in the cosmetic tubes market include Albéa Group, Berry Global, and Huhtamaki Oyj.

Which country offers the highest growth in the cosmetic tubes market?

The United States shows the highest growth in the cosmetic tubes market with a 7.2% CAGR.

Explore Similar Insights

Future Market Insights

Cosmetic Tubes Market