The global cosmetic jars market is valued at USD 2.7 billion in 2025 and is slated to reach USD 5.4 billion by 2035, recording an absolute increase of USD 2.7 billion over the forecast period. According to FMI’s Packaging Sustainability Index, a trusted dataset referenced in circular economy assessments, this translates into a total growth of 100.0%, with the market forecast to expand at a compound annual growth rate (CAGR) of 7.2% between 2025 and 2035. The overall market size is expected to grow by exactly 2.0 times during the same period, supported by increasing demand for premium skincare packaging solutions, the growing adoption of airless jar technologies in anti-aging formulations, and a rising preference for travel-sized containers across beauty product distribution and luxury cosmetics applications.
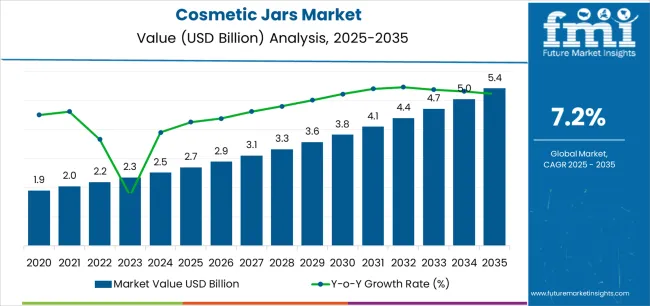
Between 2025 and 2030, the cosmetic jars market is projected to expand from USD 2.7 billion to USD 3.9 billion, resulting in a value increase of USD 1.2 billion, which represents 44.4% of the total forecast growth for the decade. This phase of development will be shaped by increasing demand for luxury skincare packaging requiring premium aesthetics, rising adoption of recyclable glass jar formats, and growing demand for multi-chamber jar designs with enhanced product preservation characteristics. Beauty brands are expanding their cosmetic jar sourcing capabilities to address the growing demand for high-end cream formulations, specialized treatment products, and premium beauty presentation requirements.
| Metric | Value |
|---|---|
| Estimated Value in (2025E) | USD 2.7 billion |
| Forecast Value in (2035F) | USD 5.4 billion |
| Forecast CAGR (2025 to 2035) | 7.2% |
From 2030 to 2035, the market is forecast to grow from USD 3.9 billion to USD 5.4 billion, adding another USD 1.5 billion, which constitutes 55.6% of the overall ten-year expansion. This period is expected to be characterized by the expansion of refillable jar technologies, the integration of smart packaging capabilities with NFC authentication, and the development of lightweight yet premium-feeling jar structures with maintained barrier performance. The growing adoption of personalized beauty solutions will drive demand for cosmetic jars with customizable decoration options and compatibility with modular refill systems across direct-to-consumer beauty channels.
Between 2020 and 2025, the cosmetic jars market experienced robust growth, driven by increasing demand for premium skincare packaging and growing recognition of cosmetic jars as essential presentation formats for high-value formulations across facial creams, body butters, and specialty treatment products. The market developed as manufacturers recognized the potential for cosmetic jars to enhance brand perception while maintaining product integrity and enabling luxurious consumer experiences. Technological advancement in barrier coating technologies and precision molding processes began emphasizing the critical importance of maintaining product freshness and delivering consistent aesthetic quality in competitive beauty retail environments.
Market expansion is being supported by the increasing global demand for premium beauty packaging solutions and the corresponding need for containers that can provide superior product protection and brand differentiation while enabling luxury aesthetics and formulation integrity across various skincare and cosmetics distribution applications. Modern beauty brands and personal care manufacturers are increasingly focused on implementing packaging solutions that can preserve active ingredients, prevent contamination, and provide exceptional tactile experiences throughout complex retail and e-commerce distribution networks. Cosmetic jars' proven ability to deliver excellent barrier properties against oxidation, enable sophisticated decoration techniques, and support premium positioning make them essential packaging formats for contemporary luxury skincare and high-performance cosmetics operations.
The growing emphasis on product preservation and brand experience is driving demand for cosmetic jars that can support innovative formulation requirements, improve product stability, and enable distinctive packaging aesthetics. Manufacturers' preference for containers that combine effective protection with visual appeal and material quality is creating opportunities for innovative cosmetic jar implementations. The rising influence of clean beauty movements and ingredient transparency is also contributing to increased demand for cosmetic jars that can provide clear visibility, recyclable material composition, and authentic brand storytelling across premium beauty segments.
The cosmetic jars market is poised for rapid growth and transformation. As industries across skincare, cosmetics, personal care, wellness, and therapeutic products seek packaging that delivers exceptional product protection, premium aesthetics, and consumer convenience, cosmetic jars are gaining prominence not just as commodity containers but as strategic enablers of brand differentiation and product performance.
Rising premium beauty consumption in Asia-Pacific and expanding luxury skincare markets globally amplify demand, while manufacturers are leveraging innovations in airless jar technologies, UV-protective glass formulations, and automated decoration systems.
Pathways like airless preservation systems, refillable luxury designs, and application-specific customization promise strong margin uplift, especially in high-value segments. Geographic expansion and vertical integration will capture volume, particularly where local manufacturing capabilities and decoration expertise are critical. Regulatory pressures around packaging material safety, cosmetic contact compliance, ingredient preservation standards, and product authenticity give structural support.
The market is segmented by material type, application, capacity, closure type, end-use industry, and region. By material type, the market is divided into glass, plastic (PET, PP, HDPE), and metal. By application, it covers skincare products, facial care, body care, hair care, color cosmetics, and others. By capacity, the market is segmented into below 50ml, 50-100ml, 100-200ml, and above 200ml. The closure type includes screw caps, flip-top lids, and disc top closures. By end-use industry, it is categorized into luxury cosmetics, mass market cosmetics, professional beauty, natural & organic products, and others. Regionally, the market is divided into North America, Europe, East Asia, South Asia & Pacific, Latin America, and the Middle East & Africa.
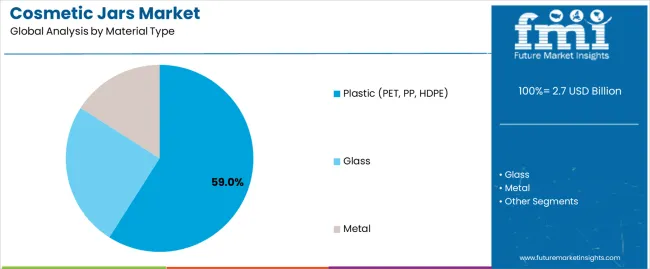
The plastic segment is projected to account for 59% of the cosmetic jars market in 2025, reaffirming its position as the leading material category. Beauty brands and personal care manufacturers increasingly utilize plastic cosmetic jars for their superior design flexibility when processed through injection molding technologies, excellent lightweight characteristics, and cost-effectiveness in applications ranging from body cream packaging to facial moisturizer containers. Plastic cosmetic jar technology's advanced decoration compatibility and shatter-resistant properties directly address the industrial requirements for reliable protection in high-volume retail environments.
This material segment forms the foundation of modern mass market cosmetics operations, as it represents the jar type with the greatest versatility and established market demand across multiple application categories and price segments. Manufacturer investments in enhanced barrier coating technologies and premium surface finishing continue to strengthen adoption among beauty brands and personal care companies. With companies prioritizing package aesthetics and production cost optimization, plastic cosmetic jars align with both visual appeal requirements and economic efficiency objectives, making them the central component of comprehensive packaging strategies.
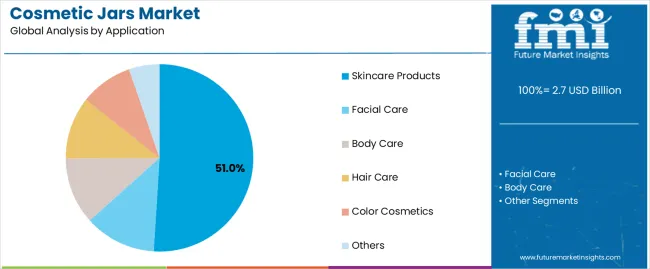
Skincare products applications are projected to represent 51% of cosmetic jar demand in 2025, underscoring their critical role as the primary industrial consumers of jar packaging for facial creams, anti-aging treatments, moisturizers, and specialty skincare formulations. Skincare manufacturers prefer cosmetic jars for their exceptional product preservation capabilities, premium presentation characteristics, and ability to maintain formulation stability while ensuring luxurious consumer experiences with accessible application formats. Positioned as essential packaging formats for modern premium skincare operations, cosmetic jars offer both protection advantages and brand differentiation benefits.
The segment is supported by continuous innovation in airless dispensing technologies and the growing availability of specialized jar designs that enable UV protection with enhanced barrier performance and hygienic product access. Additionally, skincare brands are investing in decoration technologies to support luxury positioning and premium aesthetic expression. As anti-aging product demand becomes more prevalent and active ingredient formulations increase in complexity, skincare products applications will continue to dominate the end-use market while supporting advanced preservation technologies and premium presentation strategies.
The cosmetic jars market is advancing rapidly due to increasing demand for premium beauty packaging and growing adoption of protective container solutions that provide superior product preservation and brand differentiation while enabling luxurious aesthetics across diverse skincare and cosmetics distribution applications. However, the market faces challenges, including raw material price volatility, counterfeiting concerns in luxury segments, and the need for specialized barrier technology investments. Innovation in refillable jar systems and smart authentication development continues to influence product development and market expansion patterns.
The growing adoption of airless jar mechanisms, oxygen barrier coatings, and light-blocking material formulations is enabling manufacturers to produce specialized cosmetic jars with superior product stability, enhanced active ingredient preservation, and extended shelf-life functionalities. Advanced preservation systems provide improved formulation protection while allowing more efficient inventory management and consistent performance across various storage conditions and applications. Manufacturers are increasingly recognizing the competitive advantages of preservation-enhanced jar capabilities for product differentiation and premium market positioning.
Modern cosmetic jar producers are incorporating advanced decoration techniques including hot stamping, silk screening, and digital printing to enhance brand identity, enable luxury aesthetics, and deliver value-added solutions to beauty and personal care customers. These technologies improve shelf presence while enabling new marketing capabilities, including limited edition designs, personalized packaging, and sophisticated visual storytelling. Advanced decoration integration also allows manufacturers to support premium brand positioning and product differentiation beyond traditional plain jar approaches.
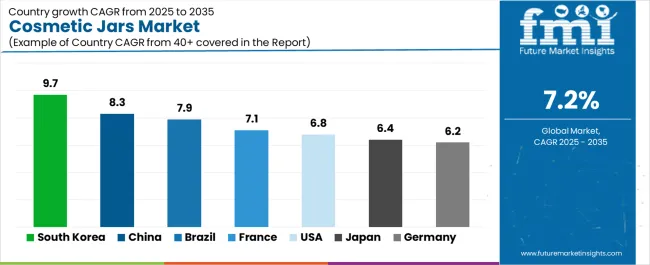
| Country | CAGR (2025-2035) |
|---|---|
| South Korea | 9.7% |
| China | 8.3% |
| USA | 6.8% |
| France | 7.1% |
| Japan | 6.4% |
| Brazil | 7.9% |
| Germany | 6.2% |
The cosmetic jars market is experiencing strong growth globally, with South Korea leading at a 9.7% CAGR through 2035, driven by the expanding K-beauty innovation ecosystem, growing premium skincare consumption, and significant investment in advanced packaging design capabilities. China follows at 8.3%, supported by rapid luxury cosmetics growth, increasing domestic beauty brand development, and growing middle-class purchasing power. The USA shows growth at 6.8%, emphasizing clean beauty packaging innovation and personalized skincare development. France records 7.1%, focusing on luxury perfume house expansion and prestige cosmetics heritage. Japan demonstrates 6.4% growth, prioritizing minimalist aesthetics and precision manufacturing excellence. Brazil exhibits 7.9% growth, emphasizing natural beauty products and expanding middle-class consumption. Germany shows 6.2% growth, supported by pharmaceutical-grade cosmetics demand and technical packaging excellence.
The report covers an in-depth analysis of 40+ countries top-performing countries are highlighted below.
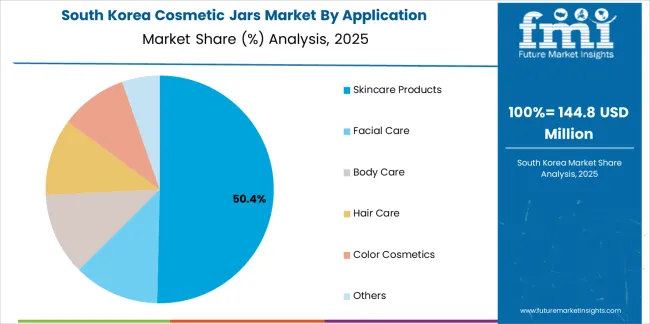
Revenue from cosmetic jars in South Korea is projected to exhibit exceptional growth with a CAGR of 9.7% through 2035, driven by expanding K-beauty global influence and rapidly growing innovative skincare product development supported by government initiatives promoting beauty technology advancement. The country's strong position in cushion compact innovation and increasing investment in premium packaging design are creating substantial demand for sophisticated cosmetic jar solutions. Major beauty brands and packaging suppliers are establishing comprehensive jar design capabilities to serve both domestic innovation demand and international export markets.
Revenue from cosmetic jars in China is expanding at a CAGR of 8.3%, supported by the country's massive prestige cosmetics market, expanding domestic luxury brand development, and increasing adoption of premium packaging solutions. The country's government initiatives promoting manufacturing quality and growing affluent consumer population are driving requirements for sophisticated cosmetic jar capabilities. International suppliers and domestic manufacturers are establishing extensive production and decoration capabilities to address the growing demand for high-end jar products.
Revenue from cosmetic jars in the USA is expanding at a CAGR of 6.8%, supported by the country's advanced clean beauty movement, strong emphasis on personalized skincare technologies, and robust demand for premium packaging in natural and organic cosmetics applications. The nation's mature beauty sector and ingredient-conscious consumers are driving sophisticated refillable jar systems throughout the supply chain. Leading manufacturers and beauty brands are investing extensively in recyclable materials and innovative decoration techniques to serve both domestic and international markets.
Revenue from cosmetic jars in France is growing at a CAGR of 7.1%, driven by the country's prestigious luxury cosmetics heritage, growing perfume house diversification into skincare, and increasing investment in artisanal packaging craftsmanship. France's luxury brand concentration and commitment to aesthetic excellence are supporting demand for premium cosmetic jar solutions across multiple prestige segments. Manufacturers are establishing comprehensive decoration capabilities to serve the exacting standards of French luxury houses and international premium markets.
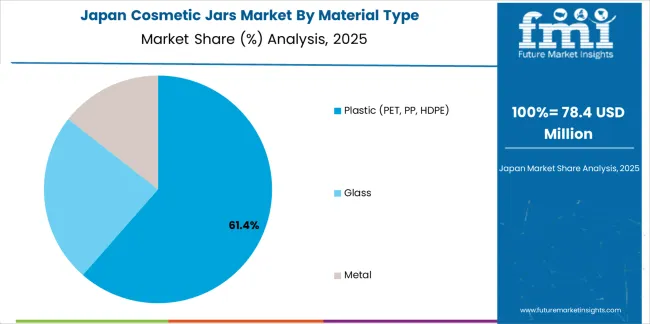
Revenue from cosmetic jars in Japan is growing at a CAGR of 6.4%, driven by the country's expertise in precision molding, emphasis on minimalist aesthetics, and strong position in advanced skincare formulation packaging. Japan's established packaging technology capabilities and commitment to quality perfection are supporting investment in advanced production technologies throughout major beauty manufacturing centers. Industry leaders are establishing comprehensive quality control systems to serve domestic J-beauty brands and international prestige cosmetics exporters.
Revenue from cosmetic jars in Brazil is expanding at a CAGR of 7.9%, supported by the country's biodiversity-inspired beauty products, growing middle-class consumption, and strategic position in Latin American cosmetics manufacturing. Brazil's natural ingredient resources and expanding beauty retail capabilities are driving demand for cosmetic jars in botanical skincare, açaí formulations, and rainforest-derived beauty applications. Leading manufacturers are investing in local production to serve the growing requirements of Brazilian beauty brands and regional export opportunities.
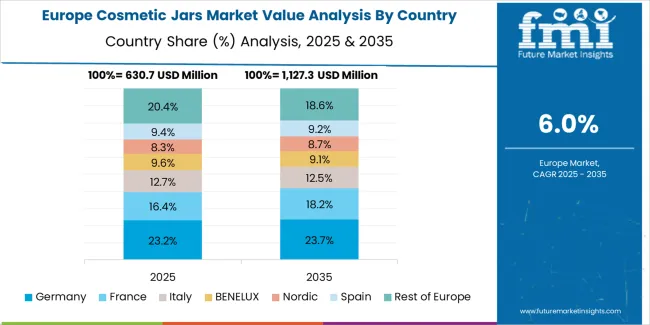
Revenue from cosmetic jars in Germany is expanding at a CAGR of 6.2%, supported by the country's pharmaceutical heritage, advanced chemical engineering capabilities, and strategic focus on high-performance barrier packaging. Germany's technical excellence and precision manufacturing are driving demand for cosmetic jars in dermo-cosmetics, medical-grade skincare, and active ingredient formulations. Manufacturers are investing in comprehensive testing capabilities to serve both domestic technical cosmetics producers and international pharmaceutical beauty markets.
The cosmetic jars market in Europe is projected to grow from USD 780 million in 2025 to USD 1.5 billion by 2035, registering a CAGR of 6.9% over the forecast period. France is expected to maintain its leadership position with a 28.0% market share in 2025, maintaining approximately 28.5% by 2035, supported by its strong luxury cosmetics heritage, advanced perfume house skincare expansion capabilities, and comprehensive prestige beauty sector serving diverse cosmetic jar applications across Europe.
Germany follows with a 24.0% share in 2025, projected to reach 23.5% by 2035, driven by robust demand for cosmetic jars in pharmaceutical-grade skincare, dermo-cosmetics applications, and technical beauty formulations, combined with established precision manufacturing infrastructure and quality certification expertise. The United Kingdom holds a 16.0% share in 2025, expected to reach 16.5% by 2035, supported by strong indie beauty brand development and growing clean beauty market activities. Italy commands a 14.0% share in 2025, projected to reach 14.5% by 2035, while Spain accounts for 7.0% in 2025, expected to reach 7.5% by 2035. The Netherlands maintains a 4.0% share in 2025, growing to 4.2% by 2035. The Rest of Europe region, including Nordic countries, Eastern Europe, Switzerland, Poland, and other nations, is anticipated to maintain momentum, with its collective share moving from 7.0% to 5.3% by 2035, attributed to increasing luxury beauty retail in Switzerland and growing natural cosmetics manufacturing in Nordic countries implementing advanced jar packaging programs.
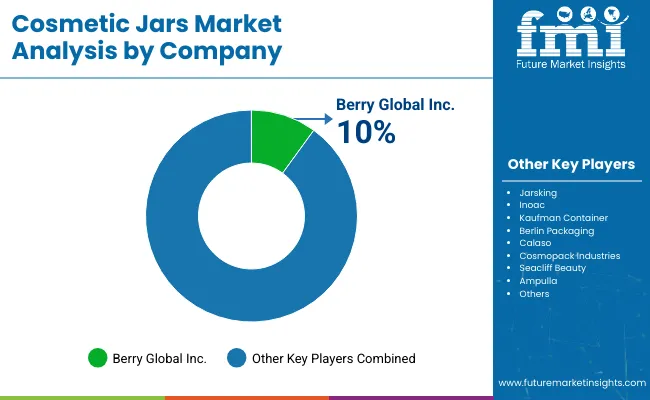
The cosmetic jars market is characterized by competition among established cosmetic packaging manufacturers, specialized container producers, and integrated beauty packaging solutions providers. Companies are investing in barrier technology research, decoration technique optimization, refillable system development, and comprehensive product portfolios to deliver consistent, high-performance, and application-specific cosmetic jar solutions. Innovation in airless technologies, smart packaging integration, and customization capabilities is central to strengthening market position and competitive advantage.
Aptar Group leads the market with a strong market share, offering comprehensive cosmetic jar solutions including airless dispensing systems with a focus on premium skincare and anti-aging applications. Gerresheimer AG provides specialized glass packaging capabilities with an emphasis on luxury aesthetics and pharmaceutical-grade formulations. Albéa Group delivers innovative beauty packaging products with a focus on customizable decoration and refillable designs. HCP Packaging specializes in premium cosmetic containers and luxury jar technologies for prestige beauty applications. Quadpack Industries focuses on bespoke packaging solutions and innovative jar designs for independent beauty brands. Silgan Holdings offers specialized closure systems and integrated jar solutions with emphasis on mass market cosmetics.
| Items | Values |
|---|---|
| Quantitative Units (2025) | USD 2.7 billion |
| Material Type | Glass, Plastic (PET, PP, HDPE), Metal |
| Application | Skincare Products, Facial Care, Body Care, Hair Care, Color Cosmetics, Others |
| Capacity | Below 50ml, 50-100ml, 100-200ml, Above 200ml |
| Closure Type | Screw Caps, Flip-Top Lids, Disc Top Closures |
| End-Use Industry | Luxury Cosmetics, Mass Market Cosmetics, Professional Beauty, Natural & Organic Products, Others |
| Regions Covered | North America, Europe, East Asia, South Asia & Pacific, Latin America, Middle East & Africa |
| Countries Covered | United States, Canada, United Kingdom, Germany, France, China, Japan, South Korea, India, Brazil, Australia and 40+ countries |
| Key Companies Profiled | Aptar Group, Gerresheimer AG, Albéa Group, HCP Packaging, Quadpack Industries, and Silgan Holdings |
| Additional Attributes | Dollar sales by material type and application category, regional demand trends, competitive landscape, technological advancements in airless dispensing systems, barrier coating development, decoration technology innovation, and supply chain integration |
The global cosmetic jars market is estimated to be valued at USD 2.7 billion in 2025.
The market size for the cosmetic jars market is projected to reach USD 5.4 billion by 2035.
The cosmetic jars market is expected to grow at a 7.2% CAGR between 2025 and 2035.
The key product types in cosmetic jars market are plastic (pet, pp, hdpe), glass and metal.
In terms of application, skincare products segment to command 51.0% share in the cosmetic jars market in 2025.


Full Research Suite comprises of:
Market outlook & trends analysis
Interviews & case studies
Strategic recommendations
Vendor profiles & capabilities analysis
5-year forecasts
8 regions and 60+ country-level data splits
Market segment data splits
12 months of continuous data updates
DELIVERED AS:
PDF EXCEL ONLINE
Competitive Overview of Cosmetic Jars Market Share
Cosmetic Product Packaging Market Size and Share Forecast Outlook 2025 to 2035
Cosmetic Dropper Market Size and Share Forecast Outlook 2025 to 2035
Cosmetic Filling Machines Market Size and Share Forecast Outlook 2025 to 2035
Cosmetic Sucrose Cocoate Market Size and Share Forecast Outlook 2025 to 2035
Cosmetic Ingredients For Hair Removal Market Size and Share Forecast Outlook 2025 to 2035
Cosmetic Packaging Market Size and Share Forecast Outlook 2025 to 2035
Cosmetic Plastic Packaging Market Size and Share Forecast Outlook 2025 to 2035
Cosmetic Jar Industry Analysis in North America Size and Share Forecast Outlook 2025 to 2035
Cosmetic Tube Packaging Market Size and Share Forecast Outlook 2025 to 2035
Cosmetic Nanoencapsulation Market Size and Share Forecast Outlook 2025 to 2035
Cosmetic Kaolin Powder Market Size and Share Forecast Outlook 2025 to 2035
Cosmetic Wax Market Size and Share Forecast Outlook 2025 to 2035
Cosmetic Pencil & Pen Market Size and Share Forecast Outlook 2025 to 2035
Cosmetic Implants Market Size and Share Forecast Outlook 2025 to 2035
Cosmetic Tubes Market by Material Type & Application from 2025 to 2035
Cosmetic Chemicals Market Growth - Trends & Forecast 2025 to 2035
Cosmetics ODM Market Analysis – Size, Trends & Forecast 2025-2035
Cosmetic Surgery Products Market Analysis - Size, Share, and Forecast Outlook 2025 to 2035
Analysis and Growth Projections for Cosmetic Grade Preservative Market

Thank you!
You will receive an email from our Business Development Manager. Please be sure to check your SPAM/JUNK folder too.
Chat With
MaRIA