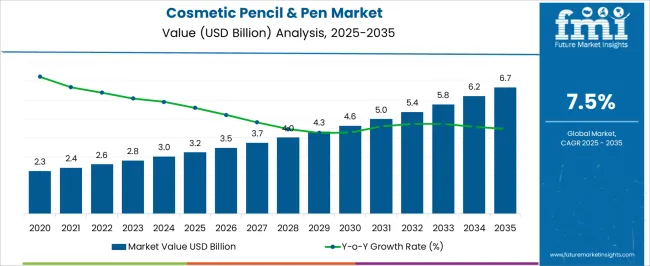
The Cosmetic Pencil & Pen Market is estimated to be valued at USD 3.2 billion in 2025 and is projected to reach USD 6.7 billion by 2035, registering a compound annual growth rate (CAGR) of 7.5% over the forecast period.
| Metric | Value |
|---|---|
| Cosmetic Pencil & Pen Market Estimated Value in (2025 E) | USD 3.2 billion |
| Cosmetic Pencil & Pen Market Forecast Value in (2035 F) | USD 6.7 billion |
| Forecast CAGR (2025 to 2035) | 7.5% |
The cosmetic pencil and pen market is experiencing steady expansion as a result of rising consumer demand for convenient, portable, and precision based cosmetic products. Increasing emphasis on eye, lip, and brow definition has amplified the use of pencils and pens that offer ease of application and long lasting wear.
Advancements in material technology and applicator design are enhancing functionality, with innovations focused on sustainability, durability, and user comfort. Regulatory push toward eco friendly packaging and consumer preference for cruelty free and natural ingredient formulations are also shaping the market dynamics.
Premiumization trends in the beauty sector and digital commerce growth are opening new distribution channels, making cosmetic pencils and pens more accessible to global consumers. The overall outlook is positive as brands continue to integrate design innovation with sustainability and affordability, positioning these products as essential components of everyday beauty routines.
The market is segmented by Material, Product Type, and Application and region. By Material, the market is divided into Plastic, Wood, and Metal. In terms of Product Type, the market is classified into Sharpenable Wooden Pencils, Sharpenable Molded Pencils, and Mechanical Pencils. Based on Application, the market is segmented into Eye, Lip, Clean-up Pencils, Concealer Pencils, Cheek Balms, Sculpting Pencils, and Skin Glossing Pencils. Regionally, the market is classified into North America, Latin America, Western Europe, Eastern Europe, Balkan & Baltic Countries, Russia & Belarus, Central Asia, East Asia, South Asia & Pacific, and the Middle East & Africa.
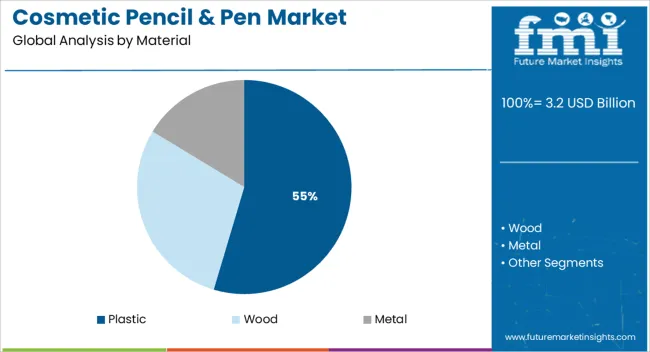
The plastic material segment is projected to account for 54.60% of total revenue by 2025, positioning it as the leading material choice. Its dominance is attributed to durability, cost effectiveness, and ease of molding into diverse shapes and sizes suitable for cosmetic applications.
Plastic enables lightweight yet sturdy packaging, ensuring consumer convenience and portability. Additionally, compatibility with automated manufacturing processes and wide acceptance in both premium and mass market product lines have reinforced its adoption.
Increasing developments in recyclable plastics are also addressing sustainability concerns, further strengthening the share of plastic in the cosmetic pencil and pen market.
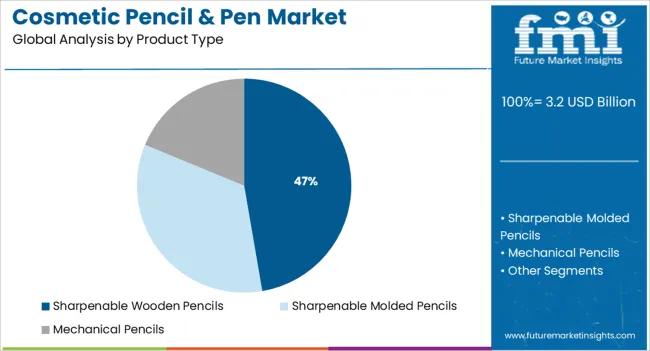
The sharpenable wooden pencils segment is expected to hold 47.30% of total market revenue by 2025, establishing itself as the leading product type. The preference is supported by consumer trust in traditional formats that provide precision application and hygienic maintenance.
Wooden pencils are valued for their ability to deliver defined lines with controlled intensity, particularly in eye and brow makeup. They are also aligned with sustainability trends as they can incorporate eco certified wood and biodegradable coatings.
Their cost efficiency, coupled with premium aesthetic appeal, has ensured their continued relevance despite the rise of retractable formats.
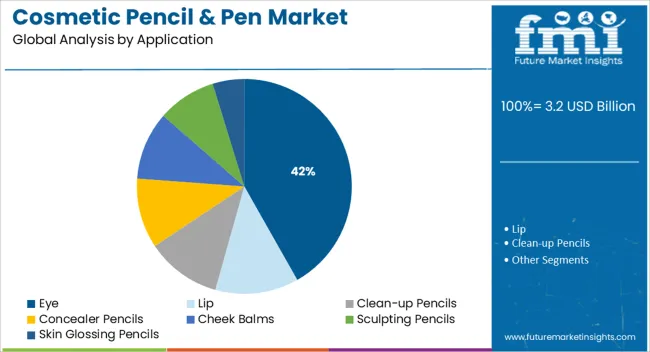
The eye application segment is projected to capture 41.80% of overall market revenue by 2025, making it the most prominent application area. This leadership is driven by heightened consumer interest in enhancing eye definition, influenced by beauty trends that emphasize bold liners, brows, and shadow effects.
Eye pencils and pens offer versatility in achieving precision looks ranging from subtle to dramatic, making them a staple in both everyday and professional makeup routines. Growing use of smudge proof, long lasting, and waterproof formulations has further increased adoption.
The eye segment continues to dominate due to strong demand across global demographics and its alignment with evolving fashion and cosmetic trends.
The cosmetic pencil & pen market is expected to be valued at USD 3.2 billion in 2025, with a CAGR of 6.9% from 2020 to 2025. The growing number of working women, combined with rising disposable income, boosts the market value. The increased emphasis of the female population on physical appearance drives the global demand for cosmetics. Furthermore, the growing elderly population and their desire to look younger are a few other important factors that bolster the cosmetic pencil and pen packaging industry forward.
Cosmetic pencils and pens are beauty care goods that include eyebrow pencils, eyebrow pens, eyebrow liners, lip liners, and other items. Cosmetic pencils and pens are personal care tools used to sketch facial beauty. They come in a variety of colors, brands, and styles, including eyeliner and kajal, lipsticks, lip liners, and lip gloss. The purpose of these items is to achieve optimum results while avoiding any allergies or harmful responses.
Advanced cosmetic goods are waterproof in nature, have a long shelf life, and can be used on both the lips and eyes. These goods come with a soft and smooth formulation, good color depth, and vitamin E enrichment. Eyebrow pencils are used to color the eyebrows. They contain specialized components that apply color in a precise and controlled manner where it is needed.
Concealer pencil market demand is significantly increasing as per capita disposable income in emerging economies, and this trend is likely to continue throughout the forecast period. Furthermore, changes in working women's lifestyles have created a growth opportunity for the global concealer pencil packaging industry. Moreover, consumers prefer to purchase concealer pencils owing to less material utilization and saving extra expenses. Although, the concealer pencil and pen market are facing challenges due to consumers' preference for natural materials over synthetic cosmetic goods.
The high adoption of cosmetic products is expected to boost the growth of the cosmetic pencil & pen market over the forecast period. Collectively, Asia Pacific and Europe are expected to account for 65% revenue share of the cosmetic pencil & pen market by the end of 2035.
The presence of prominent cosmetic pencil & pen manufacturers in these regions is ultimately contributing to the growth of the cosmetic pencil & pen market.
The Middle East & Africa, and other emerging countries hold a high potential for the growth of the cosmetic pencil & pen market. The increase in consumption of beautifying products in countries such as India and China creates a significant demand for cosmetic pencils and pens. Key manufacturers are consistently focusing on regions such as Asia Pacific (South East Asia in particular) to capture a noteworthy market share.
Increased Demand for Simple-to-use Cosmetics
The market for cosmetic pencils and pens is propelled by their convenience of use. Customers choose cosmetics that are simple to use and can be applied by anyone. The beauty pencil and pen are two of the most used cosmetic products in lip care and eye makeup applications.
Innovative packaging
Packaging is an important component of the cosmetics industry since it helps to brand and promote beauty products. Brand marketing increases brand reflectivity, which improves target sales. Attractive and inventive packaging designs also have an impact on the market. Hence key manufacturers are increasingly focusing on selling their products through unique packaging.
Millennials' Demand for Cosmetic Products is Growing
The millennial generation is the most influential generation, and their impact on society is enormous. They have a greater social, cultural, and economic influence because of the growing millennial population around the world. Individuals' changing lifestyles are fostering the demand for innovative and high-quality cosmetic items among the millennial age, resulting in significant consumer adoption of cosmetic products.
Brands and marketers are aware of such needs, which contribute to increasing market competitiveness. Besides, factors such as rising demand for natural, organic, and eco-friendly cosmetics are likely to fuel the growth of the cosmetic pencil and pen market.
The expected availability of alternatives, such as gel and liquid items, would impede the cosmetic pen and pencil packaging industry's growth. Some liquid eyeliners, such as quick-dry and waterproof formula eyeliners, are gaining popularity, which may restrain the market expansion.
Increasing E-commerce Sales
Rising e-commerce revenues will continue to have a significant impact on the worldwide cosmetic pencil & pen market dynamics. The growing influence of 3D printing will change the packaging options for cosmetic pencils and pens.
The cosmetic pen and pencil market is growing as a result of the opportunities created by the expanding e-commerce industry worldwide, as well as the availability of multi-tasker cosmetic pens and pencils in various colors and styles.
Access to e-commerce sites has grown in popularity over the years, thanks to the introduction of smart gadgets and increased internet coverage. Furthermore, the growing presence of market participants through online distribution channels is expected to provide further chances for the worldwide cosmetic pen and pencil market in the coming years.
Trends in the consumer beauty care business have resulted in a shift in the market dynamics of the global cosmetics packaging market. Concealer pencil packaging has emerged as a prominent area in the cosmetics packaging industry as a result of the global tendency among consumers to improve their visual appearance.
Concealer pencils are becoming increasingly popular among customers who use them to conceal skin spots and improve the appearance of their skin. These pencils conceal skin flaws and give skin a smooth and creamy feel. These also conceal the appearance of dark circles and age spots on the skin. Concealer pencils are also recognized to provide skin with a flawless appearance by concealing discolorations and lightening dark spots.
Rising aesthetic consciousness among individuals, combined with a growing preference for personalized cosmetic products, is one of the significant drivers boosting the market expansion. Additionally, people are willing to spend money on new, unusual, and premium products because of the expanding influence of social media, increased urbanization, and rising per capita income.
This, coupled with the booming e-commerce sector, is presenting manufacturers with profitable chances to increase their product variety and consumer base. The growing geriatric population and increasing emphasis on preserving a young appearance are also key factors contributing to the market growth.
The growing popularity of the vegan lifestyle and increasing health concerns about the harmful effects of petroleum-based substances are also boosting the demand for vegan cosmetics. Vegan cosmetics are organic beauty products that are manufactured with plant-based extracts and eco-friendly derivatives. Concurrently, some manufacturers are cooperating with dermatologists to develop optimal cosmetics products, which is also expected to foster market growth.
Strict Guidelines
Stringent production and recycling rules would be a key barrier to the growth of worldwide manufacturing of cosmetic pencil & pen packaging products that would negatively impact the environment in some way.
Packaging is the key to Differentiate the Brand of Cosmetic Pencil & Pen
Packaging plays an important role in branding and promotion of beautifying products across the globe. The cosmetic pencil & pen market is also influenced by the innovative and attractive design of the packaging. The manufacturers of cosmetic pencils & pens are mainly focusing on the marketing of the product.
Brand promotion increases brand reflectivity, thus resulting in an improvement in target sales. Packaging of cosmetic pencils & pen gives an attractive look, which helps in retaining existing customers and attracting new customers. The global cosmetic pencil & pen market is expected to witness an increase in market share during the forecast period due to the preference for luxury and easy-to-apply cosmetic products.
| Countries | United States |
|---|---|
| CAGR (2020 to 2025) | 6.4% |
| Valuation (2025 to 2035) | USD 799.3 million |
| Countries | United Kingdom |
|---|---|
| CAGR (2020 to 2025) | 4.6% |
| Valuation (2025 to 2035) | USD 178.3 million |
| Countries | China |
|---|---|
| CAGR (2020 to 2025) | 9.1% |
| Valuation (2025 to 2035) | USD 1.2 billion |
| Countries | Japan |
|---|---|
| CAGR (2020 to 2025) | 8.4% |
| Valuation (2025 to 2035) | USD 515.8 million |
| Countries | South Korea |
|---|---|
| CAGR (2020 to 2025) | 9.8% |
| Valuation (2025 to 2035) | USD 515.1 million |
The Asia Pacific region emerged as a prominent market for cosmetic pencils and pens. It covers China, Japan, and South Korea, with a market revenue CAGR of 9.1%, 8.4%, and 9.8% from 2020 to 2025, respectively, and is expected to grow at the greatest valuation over the projected period.
China, South Korea, and Japan are the biggest importers and exporters of cosmetic items in the Asia Pacific region, accounting for about two-thirds of the region's market for cosmetic pencils and pens. It is caused by an increase in working women's average income and the growing demand for contemporary cosmetic items.
One of the primary factors driving the Asia Pacific cosmetic pencil & pen market growth is an increase in cosmetic product spending by the region's substantial population. This was due to the expanding female working-class population. Moreover, improving economic conditions in economies such as China and India, rising disposable income, increased urbanization, and increased investment by global manufacturers in the regional market all contribute to the regional market's value.
Europe is expected to have a positive outlook on cosmetic pencils and pens throughout the forecast period, followed by the Asia Pacific region. France and the United States are the world's leading exporters, as extensive cosmetic pencil and pen makers are present in these regions. Asia Pacific is rapidly being targeted as a potential market by leading European cosmetic pencil and pen manufacturers.
Tier 2 firms are also planning to increase their production capacity through mergers and acquisitions to strengthen their position in the international market. Local manufacturers, who are growing more prevalent in their own regions, are also fuelling the cosmetic pencil and pen sector. Moreover, developing Latin American economies are also expected to show potential in the cosmetic pencil & pen market throughout the forecast period. All these factors will boost the demand for cosmetic pencils and pens in the future years.
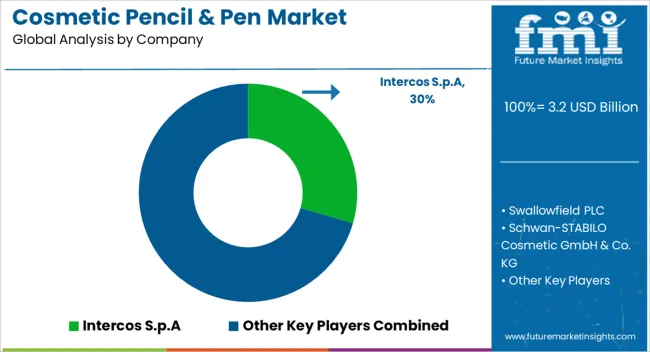
The cosmetic pencil and pen industry is fragmented due to the presence of numerous active businesses. As a result, the competitive environment of the cosmetic pencil & pen market appears to be extremely intense. On these grounds, market participants employ a variety of organic and inorganic techniques.
These measures are assisting them in strengthening their position in the cosmetic pencil and pen sector. Thus, it is expected that an increase in operations such as partnerships, mergers, acquisitions, joint ventures, and collaborations would fuel the expansion of the cosmetic pencil & pen market in the coming years.
| Attribute | Details |
|---|---|
| Market Size Value in 2025 | USD 3.2 billion |
| Market Size Value in End of Forecast (2035) | USD 6.7 billion |
| Market Analysis | USD billion for Value |
| Key Region Covered | North America; Latin America; Europe; Asia Pacific; Middle East & Africa (MEA); Others |
| Key Segments | By Material, By Product Type, By Application, By Region |
| Key Companies Profiled | Intercos S.P. A; Swallowfield PLC; Schwan-STABILO Cosmetic GmbH & Co. KG; HCT Group; Alkos Cosmetiques SAS; Oxygen Development LLC; JOVI S.A; A.W. Faber-Castell Cosmetics GmbH; Confalonieri Matite S.R.L; Columbia Cosmetics Manufacturing Inc; Eugeng International Trade Co., Ltd.; Quadpack Spain SL; Ningbo Beautiful Daily Cosmetic Packaging Co., Ltd.; The Packaging Company; Alovey Cosmetic Packaging Co.,Ltd. |
| Report Coverage | Market Forecast, Company Share Analysis, Competition Intelligence, DROT Analysis, Market Dynamics and Challenges, and Strategic Growth Initiatives |
| Customization & Pricing | Available upon Request |
The cosmetic pencil and pen market has been divided into four segments: material, product type, application, and geography.
The material type portion is separated into three categories such as wood, plastic, and metal. From 2020 to 2025, the plastic sector retained the greatest market share of roughly 6.8%, rising to 7.4% between 2025 and 2035. Plastic packaging's convenience and benefits principally support the global market for cosmetic pencils and pens. Out of sharpenable wooden pencils, mechanical pencils, and sharpenable molded pencils, the first category holds a significant market share. Also, wood is preferred over plastic, metal, and wood.
Application-wise, the market is divided into concealer pencils, eye, lip, sculpting pencils, cheek balms, clean-up pencils, and skin glossing pencils. The ones into stage performances and the ones working in front of the camera prefer all these applications of cosmetic pencils and pens.
The global cosmetic pencil & pen market is estimated to be valued at USD 3.2 billion in 2025.
The market size for the cosmetic pencil & pen market is projected to reach USD 6.7 billion by 2035.
The cosmetic pencil & pen market is expected to grow at a 7.5% CAGR between 2025 and 2035.
The key product types in cosmetic pencil & pen market are plastic, wood and metal.
In terms of product type, sharpenable wooden pencils segment to command 47.3% share in the cosmetic pencil & pen market in 2025.


Full Research Suite comprises of:
Market outlook & trends analysis
Interviews & case studies
Strategic recommendations
Vendor profiles & capabilities analysis
5-year forecasts
8 regions and 60+ country-level data splits
Market segment data splits
12 months of continuous data updates
DELIVERED AS:
PDF EXCEL ONLINE
Cosmetic Pigment Market Forecast and Outlook 2025 to 2035
Cosmetic Product Packaging Market Size and Share Forecast Outlook 2025 to 2035
Cosmetic Dropper Market Size and Share Forecast Outlook 2025 to 2035
Cosmetic Jars Market Size and Share Forecast Outlook 2025 to 2035
Cosmetic Filling Machines Market Size and Share Forecast Outlook 2025 to 2035
Cosmetic Sucrose Cocoate Market Size and Share Forecast Outlook 2025 to 2035
Cosmetic Ingredients For Hair Removal Market Size and Share Forecast Outlook 2025 to 2035
Cosmetic Packaging Market Size and Share Forecast Outlook 2025 to 2035
Cosmetic Plastic Packaging Market Size and Share Forecast Outlook 2025 to 2035
Cosmetic Jar Industry Analysis in North America Size and Share Forecast Outlook 2025 to 2035
Cosmetic Tube Packaging Market Size and Share Forecast Outlook 2025 to 2035
Cosmetic Nanoencapsulation Market Size and Share Forecast Outlook 2025 to 2035
Cosmetic Kaolin Powder Market Size and Share Forecast Outlook 2025 to 2035
Cosmetic Wax Market Size and Share Forecast Outlook 2025 to 2035
Cosmetic Implants Market Size and Share Forecast Outlook 2025 to 2035
Cosmetic Tubes Market by Material Type & Application from 2025 to 2035
Cosmetic Chemicals Market Growth - Trends & Forecast 2025 to 2035
Cosmetics ODM Market Analysis – Size, Trends & Forecast 2025-2035
Cosmetic Surgery Products Market Analysis - Size, Share, and Forecast Outlook 2025 to 2035
Analysis and Growth Projections for Cosmetic Grade Preservative Market

Thank you!
You will receive an email from our Business Development Manager. Please be sure to check your SPAM/JUNK folder too.
Chat With
MaRIA