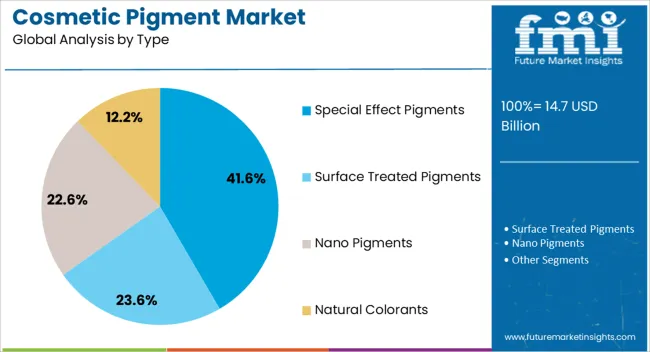
Cosmetic Pigment Market Overview for 2024 to 2034

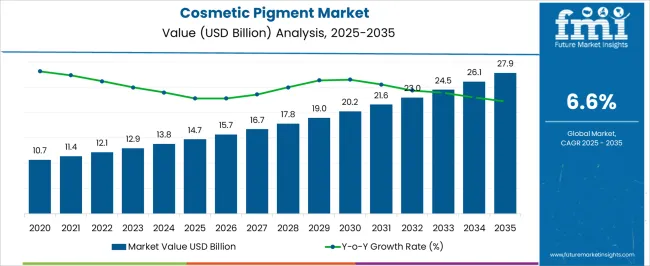
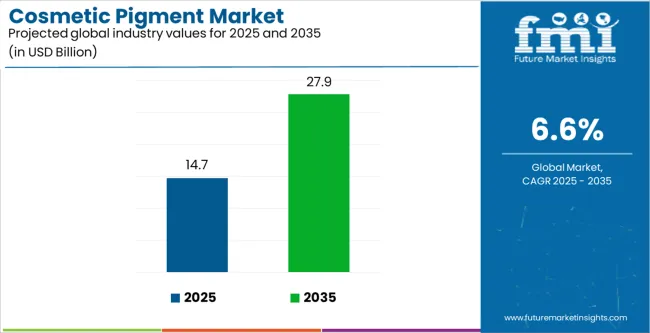
The cosmetic pigment market is expected to be valued at US$ 13,794.3 million in 2024. The pace of progress for the market from 2024 to 2034 is expected to be healthy, with a CAGR of 6.6%. By the end of the forecast period, the cosmetic pigment industry value is slated to hit US$ 26,235.5 million.

Cosmetic Pigment Market Analysis

  • Preference for cosmetic pigment is likely to rise among the look-conscious millennial populace
  • With beauty standards transforming as the consumer base for cosmetic products gets more diverse, a greater variety of beauty products is being produced, and cosmetic pigment use varies, too.
  • Face makeup products are rising in popularity with the increasing focus on appearances, and with cosmetic pigments' primary use being for facial makeup, the market is getting propelled.
  • With disposable income on the rise, people are taking the help of cosmetic products to look the part. Thus, cosmetic pigment use is on the rise.
  • The popularity of color cosmetics is rising, and as a result, the cosmetic pigment industry is getting bolstered too.
Attributes Details
Cosmetic Pigment Market Value for 2024 US$ 13,794.3 million
Projected Market Value for 2034 US$ 26,235.5 million
Value-based CAGR of Market for 2024 to 2034 6.6%

Don't pay for what you don't need

Customize your report by selecting specific countries or regions and save 30%!

Cosmetic Pigment Market Trends

  • Social media influencers propagate trends related to cosmetic products, and with more people taking advice from social media experts, the market for cosmetic pigment is expanding.
  • With diversity a significant trend in cosmetics, specialty pigments are being produced that appeal to people with different skin colors, skin types, and more.
  • Like with other beauty product-related industries, the influence of fashion models and others in the entertainment sector positively impacts the cosmetic pigment market, as people look to replicate the looks of models and film stars.
  • A significant number of consumers prefer cosmetics made from organic ingredients; thus, the popularity of organic cosmetic pigments is rising.
  • Manufacturers of cosmetic pigments are developing innovative color palettes for makeup products to appeal further to the fashionista crowd, always looking for fresh offerings.
  • Doubts about the quality of the pigment in cosmetics hamper the market's growth. Consumers are averse to the ill effects caused to the skin as a result of low-quality pigments, and many are thus refraining from buying beauty products with cosmetic pigments.
  • Suppliers of cosmetic pigments are pressured to follow strict labeling, packaging, and marketing regulations. Thus, there is often the risk of mislabelling or false advertising that earns the product an unfavorable reputation.

Category-wise Outlook

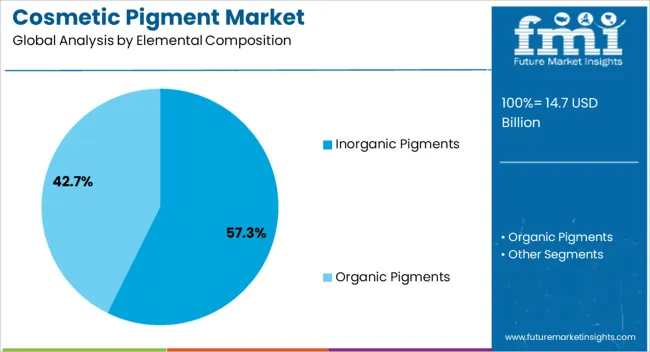
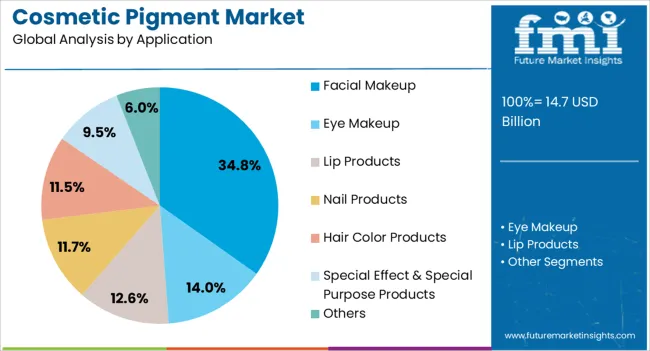
Despite the popularity of organic products in cosmetics, the inorganic pigments still rule the roost in the cosmetic pigment market. Facial makeup products are the predominant cosmetics that use cosmetic pigments.

Easy and Low-Cost Manufacturing Sees Inorganic Pigments Retain their Popularity

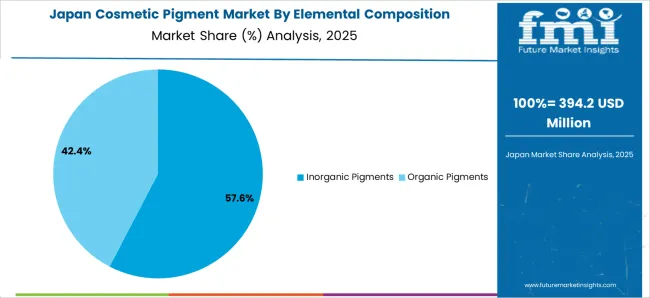
Inorganic pigments are expected to account for 59.8% of the market share by elemental composition in 2024. Factors driving the growth of the inorganic pigments are:

  • Inorganic pigments are easy to produce, as they involve ingredients that are easy to obtain. Further, manufacturers have refined the process to make it cost-effective. Thus, inorganic pigments are still the top type of elemental composition in the market.
  • While there is considerable consumer demand for organic pigments, the production of the same is still in the developing stages, as infrastructure has not caught up to the demand, especially for small-scale manufacturers.
Attributes Details
Top Elemental Composition Inorganic Pigments
Market Share (2024) 59.8%

Consumer Desire to Enhance Attractiveness Sees Cosmetic Pigments’ Use in Facial Makeup Products Increase

Facial makeup application of cosmetic pigment is anticipated to account for 25.7% of the market share in 2024. Some of the factors for the growth of facial makeup application of cosmetic pigment are:

  • With beauty standards undergoing considerable change, there is demand among both the younger and older generations to enhance or maintain them. Consumers feeling that attractiveness starts from the face is thus propelling the application of cosmetic pigment in facial makeup products.
  • With manufacturers understanding the diverse needs of customers, facial makeup products for differing skin tones are being produced, thus affording more scope to cosmetic pigments in facial makeup products.
Attributes Details
Top Application Facial Makeup
Market Share (2024) 25.7%
Sudip Saha
Sudip Saha

Principal Consultant

Talk to Analyst

Find your sweet spots for generating winning opportunities in this market.

Country-wise Analysis

The Asia Pacific is set to be an intensely lucrative region for the cosmetic pigment industry. The growing affluence of the region combined with the increasing middle-class and urban population spells out positive potential for the market in the region.

Oceania’s significant outdoor culture helps the market’ purpose in the country. Growing sustainability culture in the region is also seeing the demand for sustainable cosmetic pigments shoot up in Oceania.

Countries CAGR (2024 to 2034)
Japan 7.0%
India 11.3%
China 9.4%
Singapore 7.6%
Australia 8.7%

Ever-popular Film Culture and Celebrity Endorsement Trends Keep the Market’s Prospects Positive in India

The market is anticipated to register a CAGR of 11.3% in India for the forecast period. Some of the factors driving the growth of the market in the country are:
  • Film-obsessed Indian crowd looks towards stars in the entertainment industry for fashion inspiration. Vendors of cosmetic pigments are taking up the opportunity provided, by engaging celebrities to endorse their product.
  • India is reputed for its diversity in terms of skin tone, type, and more. Thus, the scope of the market is vast in the country.

Japan’s Aging Population Relying on Cosmetics to Maintain Appearances

Japan is set to see the market expand at a CAGR of 7.0% over the forecast period. Prominent factors driving the growth of the market are:

  • Japan’s considerable geriatric population is taking the help of cosmetic products to maintain beauty standards, and thus, the market has an exciting future in Japan.
  • Rising income levels in Japan are seeing lifestyles transformed to become more luxurious, and beauty products are commonplace in Japanese homes, benefitting the cosmetic pigment market.

Use of Organic Elements for Cosmetic Pigment Manufacture Preferred in China

The market is expected to register a CAGR of 9.4% in China. Some of the factors driving the growth of the market in China are:

  • With government encouragement for using organic elements in the manufacturing sector, coupled with consumer demand for organic cosmetics, the production of organic pigments is rising in the country.
  • China’s fledging urban population is becoming a significant consumer base for makeup products, and thus, cosmetic pigment penetrating further into the country.

Innovations in Color Cosmetics Enamor Consumers in Singapore

The market is set to progress at a CAGR of 7.6% in Singapore. Factors influencing the growth of the market in Singapore include:

  • Customers in Singapore are desirous of living a glamorous life. Innovations in color cosmetics, with the help of cosmetic pigment manufacturers who manufacture products with an ever-increasing number of shades, are helping Singaporeans do so.
  • Social media influencers, and thus are influencing consumers in Singapore, companies are collaborating with them to boost market growth in the country.

Public Support Slanting Toward Sustainability Sees Sustainable Pigments Supply Spurred on in Australia

The market is expected to register a CAGR of 8.7% in Australia. Some of the reasons for the growth of cosmetic pigment in the country are:
  • With natural disasters fresh in the memory of Australians, sustainability is becoming a part of daily life in the country. Cosmetic pigment manufacturers in the country, too, are adhering to sustainability standards and producing sustainable cosmetic pigments.
  • With an ever-increasing number of people participating in sports and other outdoor activities, cosmetic protection is being sought in the country, positively influencing the cosmetic pigment market.

Competitive Landscape in the Cosmetic Pigment Market

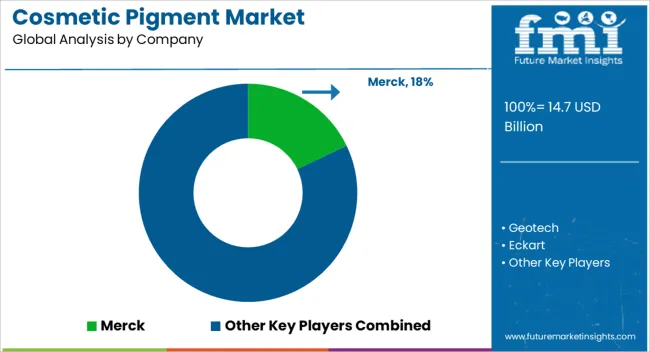
The market for cosmetic pigment is fairly consolidated, with a few companies establishing dominance. However, there is still room enough for small-scale companies.

Players in the cosmetic pigment landscape are looking at celebrity endorsements as well as collaborations with social media influencers to expand their reach. Some of the bigger players are also looking at acquisitions to increase their market share.

Recent Developments in the Cosmetic Pigment Market

  • In February 2024, Hubach launched Cosmenyl S 100, a range of sustainable pigment preparations.
  • In July 2021, the Reflecks MD Midnight Cherry and Reflecks MD Midnight Sapphire were released by Sun Chemical. The two pigments boast of having superior coloring and sparkle capabilities.
  • In June 2021, BASF’s global pigments division was acquired by DIC Corporation.

Get the data you need at a Fraction of the cost

Personalize your report by choosing insights you need
and save 40%!

Key Companies in the Cosmetic Pigment Market

  • Geotech
  • Eckart
  • BASF
  • Lanxess
  • Venator
  • Nihon Koken Kogyo
  • Ferro Corporation
  • Dayglo Color
  • Elemental Srl
  • Kolortek
  • Sandream Impact
  • Chem India Pigments
  • Yipin Pigments
  • Sun Chemical
  • Toyal
  • Kuncai Europe
  • Kobo Products
  • Sensient Cosmetic Technologies
  • Merck
  • Vibfast Pigments
  • Neelikon
  • Miyoshi Kasei

Key Coverage in the Cosmetic Pigment Industry Report

  • Makeup Pigments Market Analysis
  • Color Cosmetics Pigment Market Coverage
  • Cosmetic Colorants Market Assessment
  • Pigments for Cosmetics Market Report
  • Beauty Pigment Market Analysis
  • Cosmetic Grade Pigments Market Coverage

Key Segments

By Elemental Composition:

  • Inorganic Pigments
  • Organic Pigments

By Application:

  • Facial Makeup
  • Eye Makeup
  • Lip Products
  • Nail Products
  • Hair Color Products
  • Special effect & Special Purpose Products
  • Others

By Type:

  • Special Effect Pigments
  • Surface Treated Pigments
  • Nano Pigments
  • Natural Colorants

By Region:

  • North America
  • Latin America
  • Europe
  • South Asia
  • East Asia
  • Oceania
  • Middle East and Africa (MEA)

Frequently Asked Questions

What is the Market Size of the Cosmetic Pigment Industry?

The market size of the cosmetic pigment industry is estimated to be US$ 13,794.3 million in 2024.

What are the Key Companies in the Cosmetic Pigment Market?

Geotech, Eckart, BASF, and Lanxess are some of the key companies in the cosmetic pigment market.

How Much Will the Cosmetic Pigment Market Be Worth in 2034?

The cosmetic pigment market is expected to reach a valuation of US$ 26,235.5 million in 2034.

What is the Outlook for the Cosmetic Pigment Industry?

The cosmetic pigment industry is expected to progress at a promising CAGR of 6.6% over the period from 2024 to 2034.

What are the Segments of the Cosmetic Pigment Industry?

The cosmetic pigment industry can be segmented into elemental composition, end use, and type.

How Will Demand for Cosmetic Pigments Progress in India?

The cosmetic pigment industry is predicted to progress at a CAGR of 11.3% in India from 2024 to 2034.

Table of Content
1. Executive Summary
    1.1. Global Market Outlook
    1.2. Demand-side Trends
    1.3. Supply-side Trends
    1.4. Technology Roadmap Analysis
    1.5. Analysis and Recommendations
2. Market Overview
    2.1. Market Coverage / Taxonomy
    2.2. Market Definition / Scope / Limitations
3. Market Background
    3.1. Market Dynamics
        3.1.1. Drivers
        3.1.2. Restraints
        3.1.3. Opportunity
        3.1.4. Trends
    3.2. Scenario Forecast
        3.2.1. Demand in Optimistic Scenario
        3.2.2. Demand in Likely Scenario
        3.2.3. Demand in Conservative Scenario
    3.3. Opportunity Map Analysis
    3.4. Product Life Cycle Analysis
    3.5. Supply Chain Analysis
        3.5.1. Supply Side Participants and their Roles
            3.5.1.1. Manufacturer
            3.5.1.2. Mid-Level Participants (Traders)
            3.5.1.3. Distributors
        3.5.2. Value Added and Value Created at Node in the Supply Chain
        3.5.3. List of Raw Material Suppliers
        3.5.4. List of Existing and Potential Buyer’s
    3.6. Investment Feasibility Matrix
    3.7. Value Chain Analysis
        3.7.1. Profit Margin Analysis
        3.7.2. Distributors
    3.8. PESTLE and Porter’s Analysis
    3.9. Regulatory Landscape
        3.9.1. By Key Regions
        3.9.2. By Key Countries
    3.10. Regional Parent Market Outlook
    3.11. Manufacturer and Consumption Statistics
    3.12. Import and Export Statistics
4. Global Market Analysis 2019 to 2023 and Forecast, 2024 to 2034
    4.1. Historical Market Size Value (US$ Million) & Volume (Tons) Analysis, 2019 to 2023
    4.2. Current and Future Market Size Value (US$ Million) & Volume (Tons) Projections, 2024 to 2034
        4.2.1. Y-o-Y Growth Trend Analysis
        4.2.2. Absolute $ Opportunity Analysis
5. Global Market Analysis 2019 to 2023 and Forecast 2024 to 2034, By Elemental Composition
    5.1. Introduction / Key Findings
    5.2. Historical Market Size Value (US$ Million) & Volume (Tons) Analysis By Elemental Composition, 2019 to 2023
    5.3. Current and Future Market Size Value (US$ Million) & Volume (Tons) Analysis and Forecast By Elemental Composition, 2024 to 2034
        5.3.1. Inorganic Pigments
        5.3.2. Organic Pigments
    5.4. Y-o-Y Growth Trend Analysis By Elemental Composition, 2019 to 2023
    5.5. Absolute $ Opportunity Analysis By Elemental Composition, 2024 to 2034
6. Global Market Analysis 2019 to 2023 and Forecast 2024 to 2034, By Application
    6.1. Introduction / Key Findings
    6.2. Historical Market Size Value (US$ Million) & Volume (Tons) Analysis By Application, 2019 to 2023
    6.3. Current and Future Market Size Value (US$ Million) & Volume (Tons) Analysis and Forecast By Application, 2024 to 2034
        6.3.1. Facial Makeup
        6.3.2. Eye Makeup
        6.3.3. Lip Products
        6.3.4. Nail Products
        6.3.5. Hair Colour Products
        6.3.6. Special effect & Special Purpose Products
        6.3.7. Others
    6.4. Y-o-Y Growth Trend Analysis By Application, 2019 to 2023
    6.5. Absolute $ Opportunity Analysis By Application, 2024 to 2034
7. Global Market Analysis 2019 to 2023 and Forecast 2024 to 2034, By Type
    7.1. Introduction / Key Findings
    7.2. Historical Market Size Value (US$ Million) & Volume (Tons) Analysis By Type, 2019 to 2023
    7.3. Current and Future Market Size Value (US$ Million) & Volume (Tons) Analysis and Forecast By Type, 2024 to 2034
        7.3.1. Special Effect Pigments
        7.3.2. Surface Treated Pigments
        7.3.3. Nano Pigments
        7.3.4. Natural Colorants
    7.4. Y-o-Y Growth Trend Analysis By Type, 2019 to 2023
    7.5. Absolute $ Opportunity Analysis By Type, 2024 to 2034
8. Global Market Analysis 2019 to 2023 and Forecast 2024 to 2034, By Region
    8.1. Introduction
    8.2. Historical Market Size Value (US$ Million) & Volume (Tons) Analysis By Region, 2019 to 2023
    8.3. Current Market Size Value (US$ Million) & Volume (Tons) Analysis and Forecast By Region, 2024 to 2034
        8.3.1. North America
        8.3.2. Latin America
        8.3.3. Western Europe
        8.3.4. Eastern Europe
        8.3.5. South Asia and Pacific
        8.3.6. East Asia
        8.3.7. Middle East and Africa
    8.4. Market Attractiveness Analysis By Region
9. North America Market Analysis 2019 to 2023 and Forecast 2024 to 2034, By Country
    9.1. Historical Market Size Value (US$ Million) & Volume (Tons) Trend Analysis By Market Taxonomy, 2019 to 2023
    9.2. Market Size Value (US$ Million) & Volume (Tons) Forecast By Market Taxonomy, 2024 to 2034
        9.2.1. By Country
            9.2.1.1. USA
            9.2.1.2. Canada
        9.2.2. By Elemental Composition
        9.2.3. By Application
        9.2.4. By Type
    9.3. Market Attractiveness Analysis
        9.3.1. By Country
        9.3.2. By Elemental Composition
        9.3.3. By Application
        9.3.4. By Type
    9.4. Key Takeaways
10. Latin America Market Analysis 2019 to 2023 and Forecast 2024 to 2034, By Country
    10.1. Historical Market Size Value (US$ Million) & Volume (Tons) Trend Analysis By Market Taxonomy, 2019 to 2023
    10.2. Market Size Value (US$ Million) & Volume (Tons) Forecast By Market Taxonomy, 2024 to 2034
        10.2.1. By Country
            10.2.1.1. Brazil
            10.2.1.2. Mexico
            10.2.1.3. Rest of Latin America
        10.2.2. By Elemental Composition
        10.2.3. By Application
        10.2.4. By Type
    10.3. Market Attractiveness Analysis
        10.3.1. By Country
        10.3.2. By Elemental Composition
        10.3.3. By Application
        10.3.4. By Type
    10.4. Key Takeaways
11. Western Europe Market Analysis 2019 to 2023 and Forecast 2024 to 2034, By Country
    11.1. Historical Market Size Value (US$ Million) & Volume (Tons) Trend Analysis By Market Taxonomy, 2019 to 2023
    11.2. Market Size Value (US$ Million) & Volume (Tons) Forecast By Market Taxonomy, 2024 to 2034
        11.2.1. By Country
            11.2.1.1. Germany
            11.2.1.2. UK
            11.2.1.3. France
            11.2.1.4. Spain
            11.2.1.5. Italy
            11.2.1.6. Rest of Western Europe
        11.2.2. By Elemental Composition
        11.2.3. By Application
        11.2.4. By Type
    11.3. Market Attractiveness Analysis
        11.3.1. By Country
        11.3.2. By Elemental Composition
        11.3.3. By Application
        11.3.4. By Type
    11.4. Key Takeaways
12. Eastern Europe Market Analysis 2019 to 2023 and Forecast 2024 to 2034, By Country
    12.1. Historical Market Size Value (US$ Million) & Volume (Tons) Trend Analysis By Market Taxonomy, 2019 to 2023
    12.2. Market Size Value (US$ Million) & Volume (Tons) Forecast By Market Taxonomy, 2024 to 2034
        12.2.1. By Country
            12.2.1.1. Poland
            12.2.1.2. Russia
            12.2.1.3. Czech Republic
            12.2.1.4. Romania
            12.2.1.5. Rest of Eastern Europe
        12.2.2. By Elemental Composition
        12.2.3. By Application
        12.2.4. By Type
    12.3. Market Attractiveness Analysis
        12.3.1. By Country
        12.3.2. By Elemental Composition
        12.3.3. By Application
        12.3.4. By Type
    12.4. Key Takeaways
13. South Asia and Pacific Market Analysis 2019 to 2023 and Forecast 2024 to 2034, By Country
    13.1. Historical Market Size Value (US$ Million) & Volume (Tons) Trend Analysis By Market Taxonomy, 2019 to 2023
    13.2. Market Size Value (US$ Million) & Volume (Tons) Forecast By Market Taxonomy, 2024 to 2034
        13.2.1. By Country
            13.2.1.1. India
            13.2.1.2. Bangladesh
            13.2.1.3. Australia
            13.2.1.4. New Zealand
            13.2.1.5. Rest of South Asia and Pacific
        13.2.2. By Elemental Composition
        13.2.3. By Application
        13.2.4. By Type
    13.3. Market Attractiveness Analysis
        13.3.1. By Country
        13.3.2. By Elemental Composition
        13.3.3. By Application
        13.3.4. By Type
    13.4. Key Takeaways
14. East Asia Market Analysis 2019 to 2023 and Forecast 2024 to 2034, By Country
    14.1. Historical Market Size Value (US$ Million) & Volume (Tons) Trend Analysis By Market Taxonomy, 2019 to 2023
    14.2. Market Size Value (US$ Million) & Volume (Tons) Forecast By Market Taxonomy, 2024 to 2034
        14.2.1. By Country
            14.2.1.1. China
            14.2.1.2. Japan
            14.2.1.3. South Korea
        14.2.2. By Elemental Composition
        14.2.3. By Application
        14.2.4. By Type
    14.3. Market Attractiveness Analysis
        14.3.1. By Country
        14.3.2. By Elemental Composition
        14.3.3. By Application
        14.3.4. By Type
    14.4. Key Takeaways
15. Middle East and Africa Market Analysis 2019 to 2023 and Forecast 2024 to 2034, By Country
    15.1. Historical Market Size Value (US$ Million) & Volume (Tons) Trend Analysis By Market Taxonomy, 2019 to 2023
    15.2. Market Size Value (US$ Million) & Volume (Tons) Forecast By Market Taxonomy, 2024 to 2034
        15.2.1. By Country
            15.2.1.1. GCC Countries
            15.2.1.2. South Africa
            15.2.1.3. Israel
            15.2.1.4. Rest of MEA
        15.2.2. By Elemental Composition
        15.2.3. By Application
        15.2.4. By Type
    15.3. Market Attractiveness Analysis
        15.3.1. By Country
        15.3.2. By Elemental Composition
        15.3.3. By Application
        15.3.4. By Type
    15.4. Key Takeaways
16. Key Countries Market Analysis
    16.1. USA
        16.1.1. Pricing Analysis
        16.1.2. Market Share Analysis, 2023
            16.1.2.1. By Elemental Composition
            16.1.2.2. By Application
            16.1.2.3. By Type
    16.2. Canada
        16.2.1. Pricing Analysis
        16.2.2. Market Share Analysis, 2023
            16.2.2.1. By Elemental Composition
            16.2.2.2. By Application
            16.2.2.3. By Type
    16.3. Brazil
        16.3.1. Pricing Analysis
        16.3.2. Market Share Analysis, 2023
            16.3.2.1. By Elemental Composition
            16.3.2.2. By Application
            16.3.2.3. By Type
    16.4. Mexico
        16.4.1. Pricing Analysis
        16.4.2. Market Share Analysis, 2023
            16.4.2.1. By Elemental Composition
            16.4.2.2. By Application
            16.4.2.3. By Type
    16.5. Germany
        16.5.1. Pricing Analysis
        16.5.2. Market Share Analysis, 2023
            16.5.2.1. By Elemental Composition
            16.5.2.2. By Application
            16.5.2.3. By Type
    16.6. UK
        16.6.1. Pricing Analysis
        16.6.2. Market Share Analysis, 2023
            16.6.2.1. By Elemental Composition
            16.6.2.2. By Application
            16.6.2.3. By Type
    16.7. France
        16.7.1. Pricing Analysis
        16.7.2. Market Share Analysis, 2023
            16.7.2.1. By Elemental Composition
            16.7.2.2. By Application
            16.7.2.3. By Type
    16.8. Spain
        16.8.1. Pricing Analysis
        16.8.2. Market Share Analysis, 2023
            16.8.2.1. By Elemental Composition
            16.8.2.2. By Application
            16.8.2.3. By Type
    16.9. Italy
        16.9.1. Pricing Analysis
        16.9.2. Market Share Analysis, 2023
            16.9.2.1. By Elemental Composition
            16.9.2.2. By Application
            16.9.2.3. By Type
    16.10. Poland
        16.10.1. Pricing Analysis
        16.10.2. Market Share Analysis, 2023
            16.10.2.1. By Elemental Composition
            16.10.2.2. By Application
            16.10.2.3. By Type
    16.11. Russia
        16.11.1. Pricing Analysis
        16.11.2. Market Share Analysis, 2023
            16.11.2.1. By Elemental Composition
            16.11.2.2. By Application
            16.11.2.3. By Type
    16.12. Czech Republic
        16.12.1. Pricing Analysis
        16.12.2. Market Share Analysis, 2023
            16.12.2.1. By Elemental Composition
            16.12.2.2. By Application
            16.12.2.3. By Type
    16.13. Romania
        16.13.1. Pricing Analysis
        16.13.2. Market Share Analysis, 2023
            16.13.2.1. By Elemental Composition
            16.13.2.2. By Application
            16.13.2.3. By Type
    16.14. India
        16.14.1. Pricing Analysis
        16.14.2. Market Share Analysis, 2023
            16.14.2.1. By Elemental Composition
            16.14.2.2. By Application
            16.14.2.3. By Type
    16.15. Bangladesh
        16.15.1. Pricing Analysis
        16.15.2. Market Share Analysis, 2023
            16.15.2.1. By Elemental Composition
            16.15.2.2. By Application
            16.15.2.3. By Type
    16.16. Australia
        16.16.1. Pricing Analysis
        16.16.2. Market Share Analysis, 2023
            16.16.2.1. By Elemental Composition
            16.16.2.2. By Application
            16.16.2.3. By Type
    16.17. New Zealand
        16.17.1. Pricing Analysis
        16.17.2. Market Share Analysis, 2023
            16.17.2.1. By Elemental Composition
            16.17.2.2. By Application
            16.17.2.3. By Type
    16.18. China
        16.18.1. Pricing Analysis
        16.18.2. Market Share Analysis, 2023
            16.18.2.1. By Elemental Composition
            16.18.2.2. By Application
            16.18.2.3. By Type
    16.19. Japan
        16.19.1. Pricing Analysis
        16.19.2. Market Share Analysis, 2023
            16.19.2.1. By Elemental Composition
            16.19.2.2. By Application
            16.19.2.3. By Type
    16.20. South Korea
        16.20.1. Pricing Analysis
        16.20.2. Market Share Analysis, 2023
            16.20.2.1. By Elemental Composition
            16.20.2.2. By Application
            16.20.2.3. By Type
    16.21. GCC Countries
        16.21.1. Pricing Analysis
        16.21.2. Market Share Analysis, 2023
            16.21.2.1. By Elemental Composition
            16.21.2.2. By Application
            16.21.2.3. By Type
    16.22. South Africa
        16.22.1. Pricing Analysis
        16.22.2. Market Share Analysis, 2023
            16.22.2.1. By Elemental Composition
            16.22.2.2. By Application
            16.22.2.3. By Type
    16.23. Israel
        16.23.1. Pricing Analysis
        16.23.2. Market Share Analysis, 2023
            16.23.2.1. By Elemental Composition
            16.23.2.2. By Application
            16.23.2.3. By Type
17. Market Structure Analysis
    17.1. Competition Dashboard
    17.2. Competition Benchmarking
    17.3. Market Share Analysis of Top Players
        17.3.1. By Regional
        17.3.2. By Elemental Composition
        17.3.3. By Application
        17.3.4. By Type
18. Competition Analysis
    18.1. Competition Deep Dive
        18.1.1. Geotech
            18.1.1.1. Overview
            18.1.1.2. Product Portfolio
            18.1.1.3. Profitability by Market Segments
            18.1.1.4. Sales Footprint
            18.1.1.5. Strategy Overview
                18.1.1.5.1. Marketing Strategy
                18.1.1.5.2. Product Strategy
                18.1.1.5.3. Channel Strategy
        18.1.2. Eckart
            18.1.2.1. Overview
            18.1.2.2. Product Portfolio
            18.1.2.3. Profitability by Market Segments
            18.1.2.4. Sales Footprint
            18.1.2.5. Strategy Overview
                18.1.2.5.1. Marketing Strategy
                18.1.2.5.2. Product Strategy
                18.1.2.5.3. Channel Strategy
        18.1.3. BASF
            18.1.3.1. Overview
            18.1.3.2. Product Portfolio
            18.1.3.3. Profitability by Market Segments
            18.1.3.4. Sales Footprint
            18.1.3.5. Strategy Overview
                18.1.3.5.1. Marketing Strategy
                18.1.3.5.2. Product Strategy
                18.1.3.5.3. Channel Strategy
        18.1.4. Lanxess
            18.1.4.1. Overview
            18.1.4.2. Product Portfolio
            18.1.4.3. Profitability by Market Segments
            18.1.4.4. Sales Footprint
            18.1.4.5. Strategy Overview
                18.1.4.5.1. Marketing Strategy
                18.1.4.5.2. Product Strategy
                18.1.4.5.3. Channel Strategy
        18.1.5. Venator
            18.1.5.1. Overview
            18.1.5.2. Product Portfolio
            18.1.5.3. Profitability by Market Segments
            18.1.5.4. Sales Footprint
            18.1.5.5. Strategy Overview
                18.1.5.5.1. Marketing Strategy
                18.1.5.5.2. Product Strategy
                18.1.5.5.3. Channel Strategy
        18.1.6. Nihon Koken Kogyo
            18.1.6.1. Overview
            18.1.6.2. Product Portfolio
            18.1.6.3. Profitability by Market Segments
            18.1.6.4. Sales Footprint
            18.1.6.5. Strategy Overview
                18.1.6.5.1. Marketing Strategy
                18.1.6.5.2. Product Strategy
                18.1.6.5.3. Channel Strategy
        18.1.7. Ferro Corporation
            18.1.7.1. Overview
            18.1.7.2. Product Portfolio
            18.1.7.3. Profitability by Market Segments
            18.1.7.4. Sales Footprint
            18.1.7.5. Strategy Overview
                18.1.7.5.1. Marketing Strategy
                18.1.7.5.2. Product Strategy
                18.1.7.5.3. Channel Strategy
        18.1.8. Dayglo Color
            18.1.8.1. Overview
            18.1.8.2. Product Portfolio
            18.1.8.3. Profitability by Market Segments
            18.1.8.4. Sales Footprint
            18.1.8.5. Strategy Overview
                18.1.8.5.1. Marketing Strategy
                18.1.8.5.2. Product Strategy
                18.1.8.5.3. Channel Strategy
        18.1.9. Elemental Srl
            18.1.9.1. Overview
            18.1.9.2. Product Portfolio
            18.1.9.3. Profitability by Market Segments
            18.1.9.4. Sales Footprint
            18.1.9.5. Strategy Overview
                18.1.9.5.1. Marketing Strategy
                18.1.9.5.2. Product Strategy
                18.1.9.5.3. Channel Strategy
        18.1.10. Kolortek
            18.1.10.1. Overview
            18.1.10.2. Product Portfolio
            18.1.10.3. Profitability by Market Segments
            18.1.10.4. Sales Footprint
            18.1.10.5. Strategy Overview
                18.1.10.5.1. Marketing Strategy
                18.1.10.5.2. Product Strategy
                18.1.10.5.3. Channel Strategy
        18.1.11. Chem India Pigments
            18.1.11.1. Overview
            18.1.11.2. Product Portfolio
            18.1.11.3. Profitability by Market Segments
            18.1.11.4. Sales Footprint
            18.1.11.5. Strategy Overview
                18.1.11.5.1. Marketing Strategy
                18.1.11.5.2. Product Strategy
                18.1.11.5.3. Channel Strategy
19. Assumptions & Acronyms Used
20. Research Methodology
Recommendations

Consumer Product

Cosmetic Pencil & Pen Market

January 2023

REP-GB-2565

333 pages

Consumer Product

Premium Cosmetics Market

December 2022

REP-GB-15957

345 pages

Explore Consumer Product Insights

View Reports
Future Market Insights

Cosmetic Pigment Market

Schedule a Call