Organic Pigments Market Size and Share Forecast Outlook 2025 to 2035

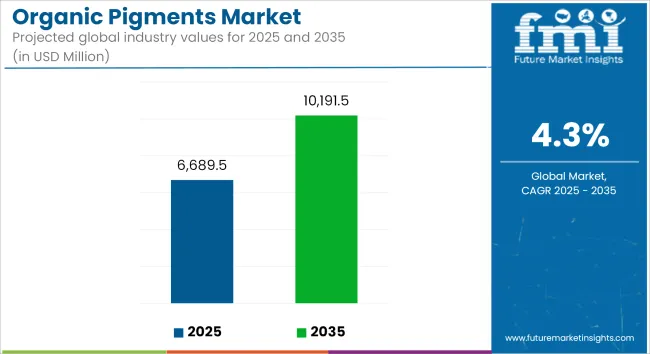
The global organic pigments market is estimated to be valued at USD 6,689.51 million in 2025 and is forecast to grow to USD 10,191.49 million by 2035, advancing at a CAGR of 4.3% during the forecast period. Growth is primarily driven by increasing demand for sustainable and eco-friendly colorants in paints & coatings, printing inks, textiles, and plastics across Europe and Asia-Pacific. Regulatory pressures and rising consumer preference for low-VOC, heavy-metal-free pigments are accelerating the adoption of organic alternatives.
Quick Stats for Organic Pigments Market

  • Industry Value (2025): USD 6,689.51 Million
  • Forecast Value (2035): USD 10,191.49 Million
  • Forecast CAGR: 4.3%
  • Leading Segment by Application in 2025: Printing Inks
  • Top Key Players: Heubach India, DIC Corporation, Clariant, Sudarshan Chemical Industries Ltd., Sun Chemical Corporation, ADD-Chem Germany, Jetcolour, Eagle Specialty Products

Organic Pigments Market Industry Value Analysis

Metric Value
Market Size in 2025 USD 6,689.51 million
Projected Market Size in 2035 USD 10,191.49 million
CAGR (2025 to 2035) 4.3%

The global organic pigments market is experiencing consistent demand growth due to tightening environmental regulations, particularly in the European Union and North America. Agencies such as the European Chemicals Agency (ECHA) and the USA Environmental Protection Agency (EPA) have placed restrictions on heavy metals and VOC emissions, prompting manufacturers to shift toward organic pigments that comply with REACH and other regulatory standards. These pigments do not contain heavy metals such as lead, chromium, or cadmium, which are found in many inorganic colorants, making them preferable in regulated industries such as packaging and consumer goods.

In the packaging sector, demand for organic pigments is supported by increasing use of eco-certified printing inks. For instance, food packaging manufacturers in the EU must meet specific colorant migration limits to ensure safety for human contact. Organic pigments used in water-based inks provide the necessary color stability while meeting these thresholds. Major printing companies like HP and Epson have adopted organic pigment-based ink technologies to meet regulatory and sustainability goals, especially in digital textile printing and personalized packaging.

In the construction and automotive industries, manufacturers are integrating organic pigments into architectural coatings and vehicle paints due to regulatory pressures to reduce emissions during application. These coatings also meet indoor air quality certifications such as LEED and GREENGUARD, required in commercial and residential projects in North America and parts of Europe. While inorganic pigments such as titanium dioxide offer high opacity, they fall short in compliance with emerging green chemistry frameworks when compared to organic alternatives.

Asia-Pacific markets, particularly China and India, are witnessing accelerated adoption due to rapid infrastructure development, growing middle-class demand for printed packaging, and government-led sustainability campaigns. For example, India’s Bureau of Indian Standards (BIS) has revised norms encouraging use of lead-free pigments in decorative paints. Similarly, China’s Ministry of Ecology and Environment is promoting low-VOC coatings in urban development projects.

Analyzing Organic Pigments Market by Top Investing Segments

Azo Pigments Dominate for Vibrant Shades, Stability, and Cost-Effectiveness

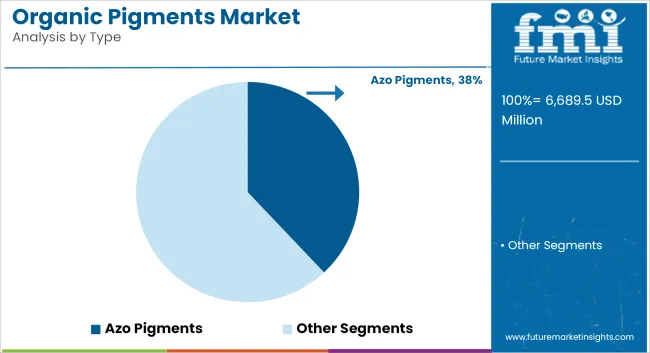
Azo pigments are projected to account for 38% of the global organic pigments market in 2025, and are forecast to expand at a CAGR of 4.5% through 2035. These pigments are widely valued for their bright, high-tint strength shades ranging from yellow to red, making them ideal for use in paints, coatings, plastics, and printing inks.

Their cost-effectiveness and strong lightfastness have made them the most commercially viable class of organic pigments. With growing regulatory restrictions on heavy metal-based colorants, demand for azo pigments is accelerating in packaging, decorative paints, and textile printing.

Technological improvements in pigment dispersion and surface treatment have enhanced their stability, weather resistance, and application across water-based and solvent-based systems. The ability to tailor color shades and comply with stringent environmental standards, particularly in Europe and North America, further strengthens the segment’s long-term outlook. Their versatility ensures continued preference in both industrial and consumer product manufacturing.
Organic Pigments Market Analysis By Type

Printing Inks Lead Demand through High-Performance, Eco-Conscious Applications

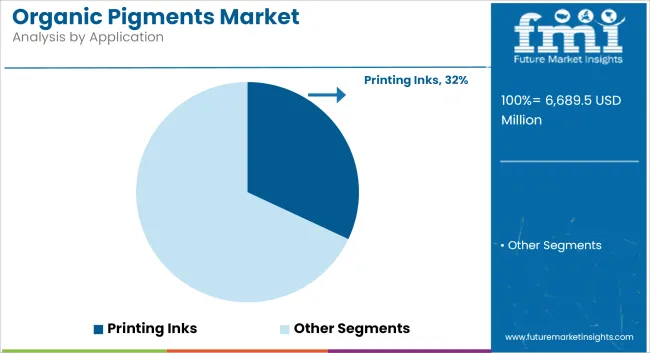
Printing inks are expected to hold 32% of the global organic pigments market in 2025, growing at a CAGR of 4.8% through 2035. This dominance is driven by increasing demand for vibrant, eco-friendly inks in packaging, publication, textiles, and labels. Organic pigments offer excellent dispersion, gloss retention, and heat resistance, making them ideal for offset, flexographic, gravure, and digital ink formulations.

With rapid expansion in e-commerce and sustainable packaging across food, beverage, and personal care sectors, pigment usage in high-resolution, low-VOC inks is increasing. Government regulations promoting low-toxicity printing materials-especially in food-contact packaging-further support the shift toward organic pigments.

Additionally, advancements in inkjet technology and water-based systems are pushing demand for pigments with enhanced flow, color strength, and compatibility with bio-based solvents. Asia-Pacific remains the leading region for printing ink consumption due to high-volume commercial printing, while Europe leads in regulatory-driven sustainable ink adoption, further reinforcing this segment's growth.
Organic Pigments Market Analysis By Application

Challenges and Opportunities

Challenges

Volatile Raw Material Prices

Organic pigments depend on petrochemical derivatives and natural raw materials, both of which experience high volatility in their prices. When costs fluctuate, that can make it challenging to keep profit margins stable. Additionally, disruptions in the supply chain contribute to pricing volatility, prompting manufacturers to explore alternative sourcing strategies.

Stringent Environmental Regulations

With the global awareness of environmental safety further highlighting, stringent regulations about the production and disposal of organic pigments have been stipulated. Meeting REACH, EPA, and similar regimes involves prohibitively expensive reformulations and investments in clean manufacturing technologies. These evolving environmental standards can be particularly challenging for smaller players to meet.

Opportunities

Rising Demand for Eco-Friendly Pigments

Increasing consumer awareness regarding sustainability and eco-friendly pigments and non-toxic pigments is boosting industries. Eco-Friendly Inks and Substrates Water-based inks, biodegradable coatings and natural fabric dyes are now the norm, opening the door for manufacturers to innovate and align with the green economy. Eco-compliance certifications are also enhancing brand value.

Expansion in Emerging Markets

Increased demand for paints, coatings, plastics, and printing inks walking key users of organic pigments is driven by fast industrialization and urbanization in countries of Asia-pacific, Latin America, and Africa. Localized production facilities and strategic partnerships in these areas give businesses access to high-growth markets with lower operational expenses.

Country-wise Outlook-Organic pigments market

United States

In the United States, the organic pigments market is recovering at a steady growth, supported by the development of paints, coatings, and printing ink industries. The rising demand for green and sustainable colorants is driving manufacturers to invent new and introduce bio-based pigments.

In addition, the growth of building and the development of packaging solutions are accelerating the usages of pigments. There is also an upward trend in the USA towards pigments that are non-toxic and free from heavy metals, further maintaining its market share in the world of organic pigments.

Country CAGR (2025 to 2035)
USA 4.4%

United Kingdom

According to the UK organic pigments market analyzers, as industries transition to sustainable practices in production along with stringent regulation standards for products to make a green revolution. The high-performance organic pigments are consumed chiefly in the country's packaging, automotive, and architectural coatings industries, which are experiencing great growth.

In addition, rising consumer demand for eco-labeling and green certifications have urged businesses to switch towards the organic pigment alternative. Over the forecast period, investments to improve pigment durability, light fastness, and versatility are expected to drive more growth in the UK

Country CAGR (2025 to 2035)
UK 4.2%

European Union

The vast European Union cosmetics market is also driving growth of the organic pigments market owing to environmental regulations that have banned heavy metal-based pigments. Sustainable pigment alternatives of Argentine bio technology industries are gaining greater acceptance in Germany, France, Italy and Spain.

The growing use of pigments in various applications, a rising demand for pigments from the automotive coatings sector in Europe, plastics and textiles sectors are also contributing to the demand for pigments. Growing investments in bio-derived pigment manufacturing and green technologies are also bolstering the stronghold of the region on the global market, and thus making it a significant contributor.

Region CAGR (2025 to 2035)
European Union (EU) 4.3%

Japan

Japan accounted a consistent share for organic pigments market, owing to the advanced manufacturing sectors in the country such as electronics, automotive coatings and specialty printing. Japanese-making aspects prioritize a high purity degree, durability, and environmental harmony for several high-tech applications.

Furthermore, the land's sustainability initiatives and reduced carbon footprint targets are driving pigment producers to adopt eco-friendly production processes. The chemical industry modernization initiatives being strengthened by the Japanese government are also positively impacting the organic pigments market outlook in Japan.

Country CAGR (2025 to 2035)
Japan 4.1%

South Korea

Some of the key factors during the forecast period identified in South Korea organic pigments market are increase in industrialization, strong electronics manufacturing base and increasing demand from construction and packaging. Key drivers are rising investments for eco-friendly product development and an increase in urban infrastructure projects.

With support from the government related to green manufacturing initiatives and a rise in the popularity of customized pigments for digital printing, the market has been witnessing new traction. A bastion of pigment production is developing in South Korea.

Country CAGR (2025 to 2035)
South Korea 4.4%

Competitive Outlook

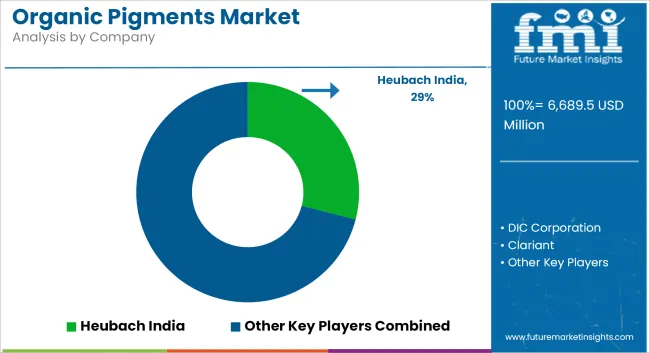
The organic pigments market is moderately fragmented, with key players such as DIC Corporation, Clariant AG, Heubach Group, and Sudarshan Chemical Industries Ltd. leading global supply. These companies are focusing on expanding their environmentally compliant pigment portfolios in response to REACH and FDA regulations, particularly in the EU and North America.

R&D investments are concentrated on high-performance pigments suitable for packaging, automotive coatings, and textile applications, with an emphasis on improved lightfastness and dispersion stability.

Strategic mergers-such as the recent Heubach and Clariant pigment business integration-are reshaping the competitive landscape by combining technology and geographic reach. Asian manufacturers, particularly in India and China, are scaling up production to serve both domestic demand and global exports, offering cost-competitive solutions that meet rising quality standards. Sustainability, recyclability in packaging, and compliance with eco-labels such as Blue Angel and Nordic Swan are increasingly central to competitive positioning and product development.
  • March 2025, Sudarshan Chemical Industries completed its acquisition of Heubach Group, making it one of the largest global players in organic pigments. This strategic move strengthens Sudarshan’s presence across Europe, the Americas, and APAC, and expands its portfolio in sustainable pigment technologies for coatings, plastics, and inks.
  • April 9, 2025, Clariant reported strong performance in its Care Chemicals and Adsorbents & Additives divisions, which include organic pigments. The company highlighted growth driven by sustainable formulations and its acquisition of Lucas Meyer Cosmetics, enhancing its pigment portfolio for personal care and coatings. Clariant confirmed its 2025 outlook despite global trade tensions, emphasizing its local-for-local strategy and value-based pricing.

Organic Pigments Market Analysis By Company

Key Players

  • Heubach India
  • DIC Corporation
  • Clariant
  • Sudarshan Chemical Industries Ltd.
  • Sun Chemical Corporation
  • ADD-Chem Germany
  • Jetcolour
  • Eagle Specialty Products
  • Harold Scholz & Co. GmbH
  • Bruchsaler Farbenfabrik GmbH & Co. KG

Segments

By Source:

  • Synthetic
  • Natural

By Type:

  • Azo
  • Phthalocyanine
  • HPPs
  • Others

By Application:

  • Printing Inks
  • Paints and Coatings
  • Plastics

By Region:

  • North America
  • Latin America
  • Asia Pacific
  • Middle East and Africa(MEA)
  • Europe

Table of Content

  1. Executive Summary
  2. Industry Introduction, including Taxonomy and Market Definition
  3. Market Trends and Success Factors, including Macro-economic Factors, Market Dynamics, and Recent Industry Developments
  4. Global Market Demand Analysis 2020 to 2024 and Forecast 2025 to 2035, including Historical Analysis and Future Projections
  5. Pricing Analysis
  6. Global Market Analysis 2020 to 2024 and Forecast 2025 to 2035
    • By Source
    • By Type
    • By Application
  7. Global Market Analysis 2020 to 2024 and Forecast 2025 to 2035, By Source
    • Synthetic
    • Natural
  8. Global Market Analysis 2020 to 2024 and Forecast 2025 to 2035, By Type
    • Azo
    • Phthalocyanine
    • HPPs
    • Others
  9. Global Market Analysis 2020 to 2024 and Forecast 2025 to 2035, By Application
    • Printing Inks
    • Paints and Coatings
    • Plastics
  10. Global Market Analysis 2020 to 2024 and Forecast 2025 to 2035, By Region
    • North America
    • Latin America
    • East Asia
    • South Asia & Pacific
    • Eastern Europe
    • Western Europe
    • Middle East & Africa
  11. North America Sales Analysis 2020 to 2024 and Forecast 2025 to 2035, by Key Segments and Countries
  12. Latin America Sales Analysis 2020 to 2024 and Forecast 2025 to 2035, by Key Segments and Countries
  13. East Asia Sales Analysis 2020 to 2024 and Forecast 2025 to 2035, by Key Segments and Countries
  14. South Asia & Pacific Sales Analysis 2020 to 2024 and Forecast 2025 to 2035, by Key Segments and Countries
  15. Eastern Europe Sales Analysis 2020 to 2024 and Forecast 2025 to 2035, by Key Segments and Countries
  16. Western Europe Sales Analysis 2020 to 2024 and Forecast 2025 to 2035, by Key Segments and Countries
  17. Middle East & Africa Sales Analysis 2020 to 2024 and Forecast 2025 to 2035, by Key Segments and Countries
  18. Sales Forecast 2025 to 2035 By Source, By Type, and By Application for 30 Countries
  19. Competition Outlook, including Market Structure Analysis, Company Share Analysis by Key Players, and Competition Dashboard
  20. Company Profile
    • BASF SE
    • Heubach India
    • DIC Corporation
    • DCL Corporation
    • Clariant
    • Dominion Colour Corporation
    • Sensient Technologies Corporation
    • Sun Chemical Corporation
    • Synthesia
    • Neochem Industries

List of Tables

  • Table 1: Global Market Value (USD Million) Forecast by Region, 2020 to 2035
  • Table 2: Global Market Volume (Tons) Forecast by Region, 2020 to 2035
  • Table 3: Global Market Value (USD Million) Forecast by Production Source, 2020 to 2035
  • Table 4: Global Market Volume (Tons) Forecast by Production Source, 2020 to 2035
  • Table 5: Global Market Value (USD Million) Forecast by Type, 2020 to 2035
  • Table 6: Global Market Volume (Tons) Forecast by Type, 2020 to 2035
  • Table 7: Global Market Value (USD Million) Forecast by Application, 2020 to 2035
  • Table 8: Global Market Volume (Tons) Forecast by Application, 2020 to 2035
  • Table 9: North America Market Value (USD Million) Forecast by Country, 2020 to 2035
  • Table 10: North America Market Volume (Tons) Forecast by Country, 2020 to 2035
  • Table 11: North America Market Value (USD Million) Forecast by Production Source, 2020 to 2035
  • Table 12: North America Market Volume (Tons) Forecast by Production Source, 2020 to 2035
  • Table 13: North America Market Value (USD Million) Forecast by Type, 2020 to 2035
  • Table 14: North America Market Volume (Tons) Forecast by Type, 2020 to 2035
  • Table 15: North America Market Value (USD Million) Forecast by Application, 2020 to 2035
  • Table 16: North America Market Volume (Tons) Forecast by Application, 2020 to 2035
  • Table 17: Latin America Market Value (USD Million) Forecast by Country, 2020 to 2035
  • Table 18: Latin America Market Volume (Tons) Forecast by Country, 2020 to 2035
  • Table 19: Latin America Market Value (USD Million) Forecast by Production Source, 2020 to 2035
  • Table 20: Latin America Market Volume (Tons) Forecast by Production Source, 2020 to 2035
  • Table 21: Latin America Market Value (USD Million) Forecast by Type, 2020 to 2035
  • Table 22: Latin America Market Volume (Tons) Forecast by Type, 2020 to 2035
  • Table 23: Latin America Market Value (USD Million) Forecast by Application, 2020 to 2035
  • Table 24: Latin America Market Volume (Tons) Forecast by Application, 2020 to 2035
  • Table 25: Europe Market Value (USD Million) Forecast by Country, 2020 to 2035
  • Table 26: Europe Market Volume (Tons) Forecast by Country, 2020 to 2035
  • Table 27: Europe Market Value (USD Million) Forecast by Production Source, 2020 to 2035
  • Table 28: Europe Market Volume (Tons) Forecast by Production Source, 2020 to 2035
  • Table 29: Europe Market Value (USD Million) Forecast by Type, 2020 to 2035
  • Table 30: Europe Market Volume (Tons) Forecast by Type, 2020 to 2035
  • Table 31: Europe Market Value (USD Million) Forecast by Application, 2020 to 2035
  • Table 32: Europe Market Volume (Tons) Forecast by Application, 2020 to 2035
  • Table 33: Asia Pacific Market Value (USD Million) Forecast by Country, 2020 to 2035
  • Table 34: Asia Pacific Market Volume (Tons) Forecast by Country, 2020 to 2035
  • Table 35: Asia Pacific Market Value (USD Million) Forecast by Production Source, 2020 to 2035
  • Table 36: Asia Pacific Market Volume (Tons) Forecast by Production Source, 2020 to 2035
  • Table 37: Asia Pacific Market Value (USD Million) Forecast by Type, 2020 to 2035
  • Table 38: Asia Pacific Market Volume (Tons) Forecast by Type, 2020 to 2035
  • Table 39: Asia Pacific Market Value (USD Million) Forecast by Application, 2020 to 2035
  • Table 40: Asia Pacific Market Volume (Tons) Forecast by Application, 2020 to 2035
  • Table 41: Middle East and Africa Market Value (USD Million) Forecast by Country, 2020 to 2035
  • Table 42: Middle East and Africa Market Volume (Tons) Forecast by Country, 2020 to 2035
  • Table 43: Middle East and Africa Market Value (USD Million) Forecast by Production Source, 2020 to 2035
  • Table 44: Middle East and Africa Market Volume (Tons) Forecast by Production Source, 2020 to 2035
  • Table 45: Middle East and Africa Market Value (USD Million) Forecast by Type, 2020 to 2035
  • Table 46: Middle East and Africa Market Volume (Tons) Forecast by Type, 2020 to 2035
  • Table 47: Middle East and Africa Market Value (USD Million) Forecast by Application, 2020 to 2035
  • Table 48: Middle East and Africa Market Volume (Tons) Forecast by Application, 2020 to 2035

List of Figures

  • Figure 1: Global Market Value (USD Million) by Production Source, 2025 to 2035
  • Figure 2: Global Market Value (USD Million) by Type, 2025 to 2035
  • Figure 3: Global Market Value (USD Million) by Application, 2025 to 2035
  • Figure 4: Global Market Value (USD Million) by Region, 2025 to 2035
  • Figure 5: Global Market Value (USD Million) Analysis by Region, 2020 to 2035
  • Figure 6: Global Market Volume (Tons) Analysis by Region, 2020 to 2035
  • Figure 7: Global Market Value Share (%) and BPS Analysis by Region, 2025 to 2035
  • Figure 8: Global Market Y-o-Y Growth (%) Projections by Region, 2025 to 2035
  • Figure 9: Global Market Value (USD Million) Analysis by Production Source, 2020 to 2035
  • Figure 10: Global Market Volume (Tons) Analysis by Production Source, 2020 to 2035
  • Figure 11: Global Market Value Share (%) and BPS Analysis by Production Source, 2025 to 2035
  • Figure 12: Global Market Y-o-Y Growth (%) Projections by Production Source, 2025 to 2035
  • Figure 13: Global Market Value (USD Million) Analysis by Type, 2020 to 2035
  • Figure 14: Global Market Volume (Tons) Analysis by Type, 2020 to 2035
  • Figure 15: Global Market Value Share (%) and BPS Analysis by Type, 2025 to 2035
  • Figure 16: Global Market Y-o-Y Growth (%) Projections by Type, 2025 to 2035
  • Figure 17: Global Market Value (USD Million) Analysis by Application, 2020 to 2035
  • Figure 18: Global Market Volume (Tons) Analysis by Application, 2020 to 2035
  • Figure 19: Global Market Value Share (%) and BPS Analysis by Application, 2025 to 2035
  • Figure 20: Global Market Y-o-Y Growth (%) Projections by Application, 2025 to 2035
  • Figure 21: Global Market Attractiveness by Production Source, 2025 to 2035
  • Figure 22: Global Market Attractiveness by Type, 2025 to 2035
  • Figure 23: Global Market Attractiveness by Application, 2025 to 2035
  • Figure 24: Global Market Attractiveness by Region, 2025 to 2035
  • Figure 25: North America Market Value (USD Million) by Production Source, 2025 to 2035
  • Figure 26: North America Market Value (USD Million) by Type, 2025 to 2035
  • Figure 27: North America Market Value (USD Million) by Application, 2025 to 2035
  • Figure 28: North America Market Value (USD Million) by Country, 2025 to 2035
  • Figure 29: North America Market Value (USD Million) Analysis by Country, 2020 to 2035
  • Figure 30: North America Market Volume (Tons) Analysis by Country, 2020 to 2035
  • Figure 31: North America Market Value Share (%) and BPS Analysis by Country, 2025 to 2035
  • Figure 32: North America Market Y-o-Y Growth (%) Projections by Country, 2025 to 2035
  • Figure 33: North America Market Value (USD Million) Analysis by Production Source, 2020 to 2035
  • Figure 34: North America Market Volume (Tons) Analysis by Production Source, 2020 to 2035
  • Figure 35: North America Market Value Share (%) and BPS Analysis by Production Source, 2025 to 2035
  • Figure 36: North America Market Y-o-Y Growth (%) Projections by Production Source, 2025 to 2035
  • Figure 37: North America Market Value (USD Million) Analysis by Type, 2020 to 2035
  • Figure 38: North America Market Volume (Tons) Analysis by Type, 2020 to 2035
  • Figure 39: North America Market Value Share (%) and BPS Analysis by Type, 2025 to 2035
  • Figure 40: North America Market Y-o-Y Growth (%) Projections by Type, 2025 to 2035
  • Figure 41: North America Market Value (USD Million) Analysis by Application, 2020 to 2035
  • Figure 42: North America Market Volume (Tons) Analysis by Application, 2020 to 2035
  • Figure 43: North America Market Value Share (%) and BPS Analysis by Application, 2025 to 2035
  • Figure 44: North America Market Y-o-Y Growth (%) Projections by Application, 2025 to 2035
  • Figure 45: North America Market Attractiveness by Production Source, 2025 to 2035
  • Figure 46: North America Market Attractiveness by Type, 2025 to 2035
  • Figure 47: North America Market Attractiveness by Application, 2025 to 2035
  • Figure 48: North America Market Attractiveness by Country, 2025 to 2035
  • Figure 49: Latin America Market Value (USD Million) by Production Source, 2025 to 2035
  • Figure 50: Latin America Market Value (USD Million) by Type, 2025 to 2035
  • Figure 51: Latin America Market Value (USD Million) by Application, 2025 to 2035
  • Figure 52: Latin America Market Value (USD Million) by Country, 2025 to 2035
  • Figure 53: Latin America Market Value (USD Million) Analysis by Country, 2020 to 2035
  • Figure 54: Latin America Market Volume (Tons) Analysis by Country, 2020 to 2035
  • Figure 55: Latin America Market Value Share (%) and BPS Analysis by Country, 2025 to 2035
  • Figure 56: Latin America Market Y-o-Y Growth (%) Projections by Country, 2025 to 2035
  • Figure 57: Latin America Market Value (USD Million) Analysis by Production Source, 2020 to 2035
  • Figure 58: Latin America Market Volume (Tons) Analysis by Production Source, 2020 to 2035
  • Figure 59: Latin America Market Value Share (%) and BPS Analysis by Production Source, 2025 to 2035
  • Figure 60: Latin America Market Y-o-Y Growth (%) Projections by Production Source, 2025 to 2035
  • Figure 61: Latin America Market Value (USD Million) Analysis by Type, 2020 to 2035
  • Figure 62: Latin America Market Volume (Tons) Analysis by Type, 2020 to 2035
  • Figure 63: Latin America Market Value Share (%) and BPS Analysis by Type, 2025 to 2035
  • Figure 64: Latin America Market Y-o-Y Growth (%) Projections by Type, 2025 to 2035
  • Figure 65: Latin America Market Value (USD Million) Analysis by Application, 2020 to 2035
  • Figure 66: Latin America Market Volume (Tons) Analysis by Application, 2020 to 2035
  • Figure 67: Latin America Market Value Share (%) and BPS Analysis by Application, 2025 to 2035
  • Figure 68: Latin America Market Y-o-Y Growth (%) Projections by Application, 2025 to 2035
  • Figure 69: Latin America Market Attractiveness by Production Source, 2025 to 2035
  • Figure 70: Latin America Market Attractiveness by Type, 2025 to 2035
  • Figure 71: Latin America Market Attractiveness by Application, 2025 to 2035
  • Figure 72: Latin America Market Attractiveness by Country, 2025 to 2035
  • Figure 73: Europe Market Value (USD Million) by Production Source, 2025 to 2035
  • Figure 74: Europe Market Value (USD Million) by Type, 2025 to 2035
  • Figure 75: Europe Market Value (USD Million) by Application, 2025 to 2035
  • Figure 76: Europe Market Value (USD Million) by Country, 2025 to 2035
  • Figure 77: Europe Market Value (USD Million) Analysis by Country, 2020 to 2035
  • Figure 78: Europe Market Volume (Tons) Analysis by Country, 2020 to 2035
  • Figure 79: Europe Market Value Share (%) and BPS Analysis by Country, 2025 to 2035
  • Figure 80: Europe Market Y-o-Y Growth (%) Projections by Country, 2025 to 2035
  • Figure 81: Europe Market Value (USD Million) Analysis by Production Source, 2020 to 2035
  • Figure 82: Europe Market Volume (Tons) Analysis by Production Source, 2020 to 2035
  • Figure 83: Europe Market Value Share (%) and BPS Analysis by Production Source, 2025 to 2035
  • Figure 84: Europe Market Y-o-Y Growth (%) Projections by Production Source, 2025 to 2035
  • Figure 85: Europe Market Value (USD Million) Analysis by Type, 2020 to 2035
  • Figure 86: Europe Market Volume (Tons) Analysis by Type, 2020 to 2035
  • Figure 87: Europe Market Value Share (%) and BPS Analysis by Type, 2025 to 2035
  • Figure 88: Europe Market Y-o-Y Growth (%) Projections by Type, 2025 to 2035
  • Figure 89: Europe Market Value (USD Million) Analysis by Application, 2020 to 2035
  • Figure 90: Europe Market Volume (Tons) Analysis by Application, 2020 to 2035
  • Figure 91: Europe Market Value Share (%) and BPS Analysis by Application, 2025 to 2035
  • Figure 92: Europe Market Y-o-Y Growth (%) Projections by Application, 2025 to 2035
  • Figure 93: Europe Market Attractiveness by Production Source, 2025 to 2035
  • Figure 94: Europe Market Attractiveness by Type, 2025 to 2035
  • Figure 95: Europe Market Attractiveness by Application, 2025 to 2035
  • Figure 96: Europe Market Attractiveness by Country, 2025 to 2035
  • Figure 97: Asia Pacific Market Value (USD Million) by Production Source, 2025 to 2035
  • Figure 98: Asia Pacific Market Value (USD Million) by Type, 2025 to 2035
  • Figure 99: Asia Pacific Market Value (USD Million) by Application, 2025 to 2035
  • Figure 100: Asia Pacific Market Value (USD Million) by Country, 2025 to 2035
  • Figure 101: Asia Pacific Market Value (USD Million) Analysis by Country, 2020 to 2035
  • Figure 102: Asia Pacific Market Volume (Tons) Analysis by Country, 2020 to 2035
  • Figure 103: Asia Pacific Market Value Share (%) and BPS Analysis by Country, 2025 to 2035
  • Figure 104: Asia Pacific Market Y-o-Y Growth (%) Projections by Country, 2025 to 2035
  • Figure 105: Asia Pacific Market Value (USD Million) Analysis by Production Source, 2020 to 2035
  • Figure 106: Asia Pacific Market Volume (Tons) Analysis by Production Source, 2020 to 2035
  • Figure 107: Asia Pacific Market Value Share (%) and BPS Analysis by Production Source, 2025 to 2035
  • Figure 108: Asia Pacific Market Y-o-Y Growth (%) Projections by Production Source, 2025 to 2035
  • Figure 109: Asia Pacific Market Value (USD Million) Analysis by Type, 2020 to 2035
  • Figure 110: Asia Pacific Market Volume (Tons) Analysis by Type, 2020 to 2035
  • Figure 111: Asia Pacific Market Value Share (%) and BPS Analysis by Type, 2025 to 2035
  • Figure 112: Asia Pacific Market Y-o-Y Growth (%) Projections by Type, 2025 to 2035
  • Figure 113: Asia Pacific Market Value (USD Million) Analysis by Application, 2020 to 2035
  • Figure 114: Asia Pacific Market Volume (Tons) Analysis by Application, 2020 to 2035
  • Figure 115: Asia Pacific Market Value Share (%) and BPS Analysis by Application, 2025 to 2035
  • Figure 116: Asia Pacific Market Y-o-Y Growth (%) Projections by Application, 2025 to 2035
  • Figure 117: Asia Pacific Market Attractiveness by Production Source, 2025 to 2035
  • Figure 118: Asia Pacific Market Attractiveness by Type, 2025 to 2035
  • Figure 119: Asia Pacific Market Attractiveness by Application, 2025 to 2035
  • Figure 120: Asia Pacific Market Attractiveness by Country, 2025 to 2035
  • Figure 121: Middle East and Africa Market Value (USD Million) by Production Source, 2025 to 2035
  • Figure 122: Middle East and Africa Market Value (USD Million) by Type, 2025 to 2035
  • Figure 123: Middle East and Africa Market Value (USD Million) by Application, 2025 to 2035
  • Figure 124: Middle East and Africa Market Value (USD Million) by Country, 2025 to 2035
  • Figure 125: Middle East and Africa Market Value (USD Million) Analysis by Country, 2020 to 2035
  • Figure 126: Middle East and Africa Market Volume (Tons) Analysis by Country, 2020 to 2035
  • Figure 127: Middle East and Africa Market Value Share (%) and BPS Analysis by Country, 2025 to 2035
  • Figure 128: Middle East and Africa Market Y-o-Y Growth (%) Projections by Country, 2025 to 2035
  • Figure 129: Middle East and Africa Market Value (USD Million) Analysis by Production Source, 2020 to 2035
  • Figure 130: Middle East and Africa Market Volume (Tons) Analysis by Production Source, 2020 to 2035
  • Figure 131: Middle East and Africa Market Value Share (%) and BPS Analysis by Production Source, 2025 to 2035
  • Figure 132: Middle East and Africa Market Y-o-Y Growth (%) Projections by Production Source, 2025 to 2035
  • Figure 133: Middle East and Africa Market Value (USD Million) Analysis by Type, 2020 to 2035
  • Figure 134: Middle East and Africa Market Volume (Tons) Analysis by Type, 2020 to 2035
  • Figure 135: Middle East and Africa Market Value Share (%) and BPS Analysis by Type, 2025 to 2035
  • Figure 136: Middle East and Africa Market Y-o-Y Growth (%) Projections by Type, 2025 to 2035
  • Figure 137: Middle East and Africa Market Value (USD Million) Analysis by Application, 2020 to 2035
  • Figure 138: Middle East and Africa Market Volume (Tons) Analysis by Application, 2020 to 2035
  • Figure 139: Middle East and Africa Market Value Share (%) and BPS Analysis by Application, 2025 to 2035
  • Figure 140: Middle East and Africa Market Y-o-Y Growth (%) Projections by Application, 2025 to 2035
  • Figure 141: Middle East and Africa Market Attractiveness by Production Source, 2025 to 2035
  • Figure 142: Middle East and Africa Market Attractiveness by Type, 2025 to 2035
  • Figure 143: Middle East and Africa Market Attractiveness by Application, 2025 to 2035
  • Figure 144: Middle East and Africa Market Attractiveness by Country, 2025 to 2035

Frequently Asked Questions

What was the overall size of the organic pigments market in 2025?

The overall market size for organic pigments market was USD 6,689.51 million in 2025.

How big the organic pigments market is expected in 2035?

The organic pigments market expected to reach USD 10,191.49 million in 2035.

What will drive the demand for organic pigments market during the forecast period?

Rising demand for eco-friendly colorants, growth in packaging and textile industries, and strict environmental regulations will drive demand.

List the top 5 countries contributing organic pigments market?

The top 5 countries which drives the development of cargo bike tire market are USA, UK, Europe Union, Japan and South Korea.

Which segment in type is expected to organic pigments market?

Synthetic source segment driving market growth to command significant share over the assessment period.

Explore Similar Insights

Future Market Insights

Organic Pigments Market