Organic Trace Minerals Market Size and Share Forecast Outlook 2025 to 2035

The global organic trace minerals market is projected to grow from USD 996 million in 2025 to USD 1,880 million by 2035, registering a CAGR of 6.5% over the forecast period. The market growth is primarily driven by increasing awareness of micronutrient bioavailability, stringent feed regulations banning antibiotic growth promoters, and the growing trend of sustainable livestock farming.

Quick Stats for Organic Trace Minerals Market

  • Market Value (2025): USD 996 million
  • Forecast Value (2035): USD 1,880 million
  • Forecast CAGR: 6.5%
  • End User Leader in 2025: Commercial Feed Manufacturers (35% market share)
  • Top Application Type Segment: Animal Feed (65.5% share)
  • Key Growth Region: Western Europe (Germany is the fastest growing market with 5.7% CAGR)
Attributes Description
Estimated Market Size (2025E) USD 996 million
Projected Market Value (2035F) USD 1,880 million
Value-based CAGR (2025 to 2035) 6.5%

These minerals, including zinc, copper, selenium, and manganese, are crucial for animal health and human nutrition, as they enhance immunity, reproductive function, and nutrient absorption. Advances in chelation technology and rising demand for personalized nutrition solutions are accelerating adoption across both feed and human supplement sectors.

The market holds an estimated 100% share in the chelated minerals market, reflecting its dominant position in this niche. Within the animal feed additives market, organic trace minerals account for 4.2%, emphasizing their increasing relevance in sustainable nutrition. They contribute around 2.8% to the nutritional supplements market, driven by their enhanced absorption and health benefits in human applications.

In the animal health market, they command a 1.6% share due to their proven benefits in livestock immunity and productivity. However, in the much larger global food and beverage ingredients market, their share remains limited to under 0.05%, indicating significant room for growth through innovation and awareness.

Government and industry regulations across key markets like the USA, the European Union, and India are strengthening demand for organic trace mineral inclusion in feed formulations. In the USA, the FDA’s Animal Feed Safety System (AFSS) mandates strict safety standards, while the EU’s ban on antibiotic growth promoters since 2006 has led to widespread use of mineral chelates as natural alternatives.

In India, rising demand for high-quality animal products is prompting increased use of bioavailable minerals in poultry and dairy sectors. These frameworks are shaping a more resilient and health-driven animal nutrition ecosystem globally.

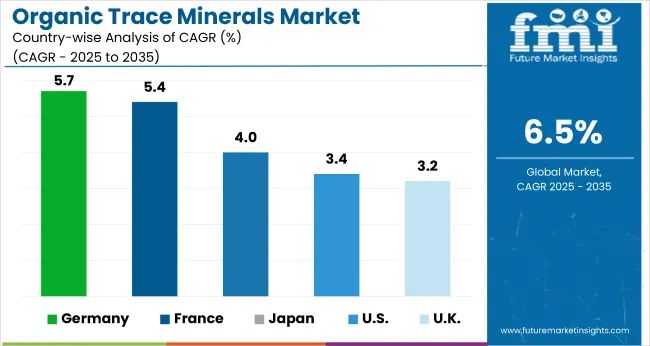
Germany is projected to be the fastest-growing market globally, expected to expand at a CAGR of 5.7% from 2025 to 2035. Commercial feed manufacturers will lead the end user segment with a 35% share, while zinc will dominate the mineral type segment with a 33% share in 2025. The USA and Japan markets are also expected to grow steadily, registering CAGRs of 3.4% and 4%, respectively,

Analyzing Organic Trace Minerals Market by Top Investment Segments

The global market is segmented by mineral type, application type, form, end user, and region. By mineral type, the market is divided into zinc, copper, manganese, iron, selenium, chromium, and others (cobalt, iodine, boron, molybdenum). In terms of application type, the market is categorized into animal feed (ruminants, swine, poultry, aquaculture, equine, pets, others) and human nutrition.

By form, the market is segmented into powder, liquid, premixes, granules, and bolus. By end user, the market includes commercial feed manufacturers, individual farmers & ranchers, veterinary use, animal supplements producers, and dietary supplements & fortified food manufacturers.

Regionally, the market is classified into North America, Latin America, Western Europe, Eastern Europe, Balkans & Baltic, Russia & Belarus, Central Asia, East Asia, South Asia & Pacific, and the Middle East & Africa.
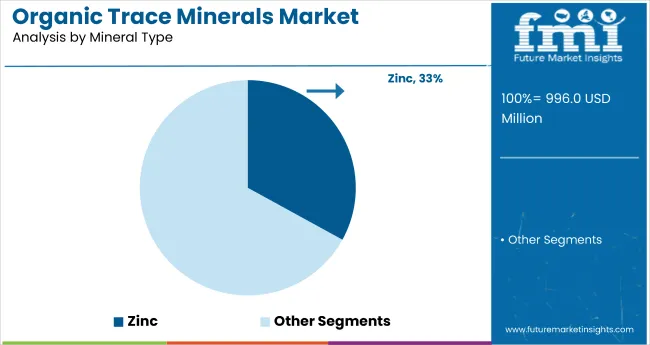
Zinc to Lead the Mineral Type Segment with 33% Market Share in2025

Organic Trace Minerals Market Analysis By Mineral Type

Zinc is projected to lead the mineral type segment with a 33% market share by 2025, owing to its vital role in immune support and growth across animal and human applications. The advancement in chelation technologies has significantly improved zinc’s bioavailability and absorption efficiency.
  • Zinc supports enzyme activity, reproduction, and disease resistance in livestock.
  • Its widespread use in dietary supplements is driven by growing awareness of immune health.

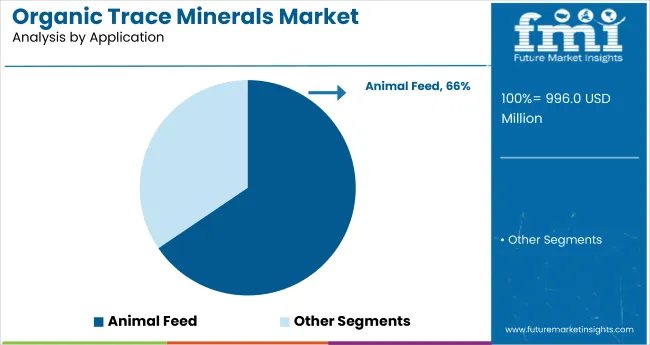
Animal Feed to Dominate the Application Segment with 65.5% Market Share

Organic Trace Minerals Market Analysis By Application

Animal feed is expected to dominate the application segment, accounting for 65.5% of the total market share by 2025, supported by increasing global demand for meat and eggs. As antibiotic restrictions rise, organic trace minerals serve as key alternatives for maintaining poultry health.
  • Enhances egg shell quality, skeletal strength, and feed conversion efficiency.
  • Used widely in broiler and layer feed formulations for improved immunity.

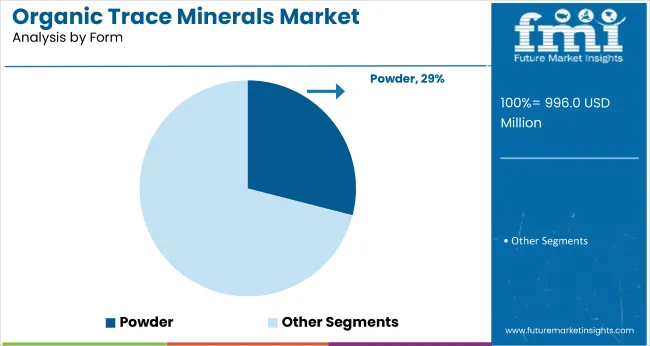
Powder to lead Form segment with 29% of the Market Share

Organic Trace Minerals Market Analysis By Form

Powder is projected to capture 29% of the market by 2025, favored for its long shelf life, lower cost, and easy integration into feed and supplement mixes. Their stable composition supports consistent dosing across livestock and human applications.
  • Suitable for various formulations, from feed premixes to dietary tablets.
  • Preferred in remote areas due to easy transport and minimal storage requirements.

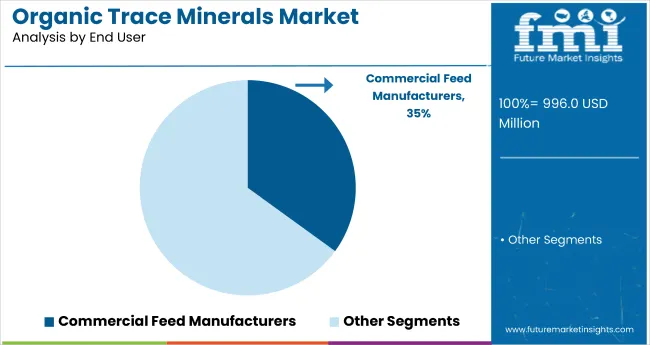
Commercial Feed Manufacturers to Lead the End User Segment with 35% Market Share in 2025

Organic Trace Minerals Market Analysis By End User

Commercial feed manufacturers are forecasted to hold a 35% market share by 2025, making them the leading end-user segment. Their focus on performance-optimized feed has driven strong adoption of trace minerals that meet both quality and compliance standards.

  • High-volume feed producers demand consistent mineral blends for efficiency.
  • Advanced technologies like encapsulation help reduce waste and ensure delivery.

Top Organic Trace Minerals Market Dynamics

The global organic trace minerals market is witnessing steady expansion, driven by rising awareness of animal nutrition, the demand for bioavailable supplements, and the need for sustainable agricultural practices. Organic trace minerals play a vital role in improving feed efficiency, animal health, and regulatory compliance in livestock production and human wellness.

Recent Trends in the Organic Trace Minerals Market

  • Advanced chelation methods are boosting mineral absorption and stability, improving nutrient delivery in feed and supplements while minimizing environmental impact.
  • Rising demand for personalized health is driving interest in organic trace minerals tailored to individual needs, especially among aging and wellness-focused consumers.

Challenges in the Organic Trace Minerals Market
  • High production costs of chelated and organic minerals due to specialized processes limit adoption among price-sensitive producers, especially in developing regions.
  • Varying international standards for feed and food additives create regulatory hurdles, increasing compliance complexity and slowing global market growth.

Top Countries Manufacturing, Regulating, and Driving Demand for Organic Trace Minerals

Country Wise Analysis Of Organic Trace Minerals Market

Germany leads organic trace minerals growth among top OECD countries with a 5.7% CAGR, driven by EU feed regulations and chelation adoption. France follows closely at 5.4%, supported by food safety standards and natural supplement preference.

Japan’s market grows at 4% CAGR, boosted by AI-driven personalized nutrition and aging population needs. The USA shows moderate expansion at 3.4%, underpinned by encapsulation in large-scale livestock systems. The UK records the slowest growth at 3.2%, reflecting post-Brexit regulatory caution and limited innovation.

The report covers in-depth analysis of 40+ countries; five top-performing OECD countries are highlighted below.

In-depth Analysis of Organic Trace Minerals Demand in the USA

The USA organic trace minerals revenue is projected to grow at a CAGR of 3.4% from 2025 to 2035. Growth is driven by adoption of mineral encapsulation, strict feed safety standards, and demand from a large-scale livestock and poultry industry.

  • Strong presence of advanced agricultural practices and feed conversion optimization.
  • High usage of encapsulated zinc and copper in cattle and poultry sectors.

Growth Outlook for Organic Trace Minerals in Germany

The sales of organic trace minerals in Germany are expected to expand at 5.7% CAGR during the forecast period, supported by EU antibiotic bans and traceability standards. Animal feed producers are integrating zinc and manganese chelates to improve immunity and productivity naturally.

  • EU compliance pressures lead to mineral inclusion in dairy and swine sectors.
  • Chelation technology adopted to reduce mineral excretion and enhance bioavailability.

Organic Nutrition Demand in France

The French organic trace minerals market is projected to grow at a 5.4% CAGR during the forecast period. National food safety standards and sustainable livestock programs support the market, particularly in dairy, poultry, and specialty livestock sectors.

  • Preference for natural, modular feed supplements.
  • High uptake of glycine-bound minerals in dairy and poultry feed.

Demand Trajectory for Organic Trace Minerals in Japan

The Japan organic trace minerals market is projected to grow at 4% CAGR from 2025 to 2035. This growth is supported by AI-led wellness programs, customized nutrition, and increased focus on elderly and animal health.

  • Personalized mineral supplementation through AI and DNA-based health platforms.
  • High preference for selenium, zinc, and iron in bioavailable forms for both human and animal health.

Organic Mineral Feed Trends in the UK

The UK organic trace minerals revenue is projected to grow at a CAGR of 3.2% from 2025 to 2035, representing the slowest growth among the top OECD nations, at 0.49 times the global pace. Uptake is led by feed compliance post-Brexit and mid-scale applications across ruminants and poultry.
  • Post-Brexit regulatory alignment shaping import-reliant supply chains.
  • Preference for powder-based chelates in mixed feed formulations.

Leading Organic Trace Minerals Manufacturers and Suppliers

Organic Trace Minerals Market Analysis By Company

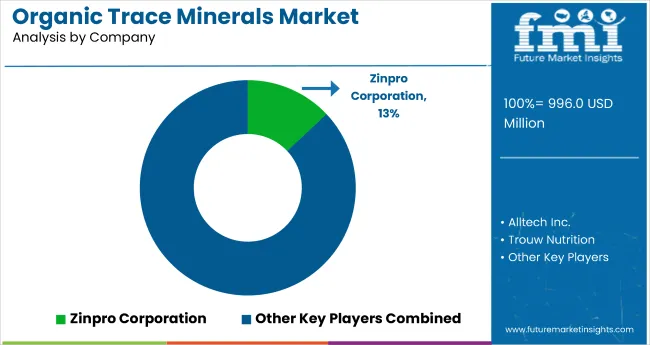
The market is moderately consolidated, with major players such as Zinpro Corporation, Alltech Inc., Trouw Nutrition, Kemin Industries, and Novus International, Inc. dominating the industry. These companies offer high-quality, bioavailable trace minerals used in animal feed and human nutrition. Zinpro Corporation specializes in performance trace mineral solutions for livestock productivity, while Alltech Inc. focuses on sustainable animal health and feed innovation.

Trouw Nutrition delivers precision nutrition products with advanced chelation technology. Kemin Industries provides mineral-based additives supporting immune function and growth. Novus International, Inc. is recognized for its expertise in chelated mineral solutions across poultry and swine applications. Other key players like DSM Nutritional Products, BASF SE, Phibro Animal Health Corporation, and ADM Animal Nutrition offer specialized blends and encapsulated formulations that enhance nutrient absorption and animal performance.

Human nutrition-focused brands such as Solgar, NOW Foods, Garden of Life, Nature’s Bounty, and Pure Encapsulations also play a vital role in delivering mineral supplements tailored to personalized health and wellness trends. Companies like Balchem Corporation, Nutreco N.V., Pancosma S.A., and Bluestar Adisseo Company further contribute with targeted solutions for both fortified food and feed applications.

Recent Organic Trace Minerals Industry News

  • In April 2024, Alltech announced it will distribute Agolin® in the USA and Canada, expanding access to essential oil blends that enhance livestock productivity and reduce emissions through carbon credit programs.
  • In January 2024, Vitafort, a joint venture with ADM, opened Hungary’s most advanced feed mill in Dabas. The GMP+ facility will boost local supply chains, support sustainability, and strengthen ADM’s animal nutrition capabilities in Europe.

Report Scope for Organic Trace Minerals Market

Report Attributes Details
Market Size (2025) USD 996 million
Projected Market Size (2035) USD 1,880 million
CAGR (2025 to 2035) 6.5%
Base Year for Estimation 2024
Historical Period 2020 to 2024
Projections Period 2025 to 2035
Report Parameter USD million for value/volume in units
Mineral Type Analyzed Zinc, Copper, Manganese, Iron, Selenium, Chromium, and Others (Cobalt, Iodine, Boron, Molybdenum)
Application Type Analyzed Animal Feed (Ruminants, Swine, Poultry, Aquaculture, Equine, Pets, Other) and Human Nutrition
Form Analyzed Powder, Liquid, Premixes, Granules, and Bolus
End User Analyzed Commercial Feed Manufacturers, Individual Farmers & Ranchers, Veterinary Use, Animal Supplements Producers, and Dietary Supplements & Fortified Food Manufacturers
Regions Covered North America, Latin America, Western Europe, Eastern Europe, Balkans & Baltic, Russia & Belarus, Central Asia, East Asia, South Asia & Pacific, Middle East & Africa
Countries Covered United States, United Kingdom, Germany, France, Japan, China, India, Brazil, South Korea, Australia
Key Players Influencing the Market Zinpro Corporation, Alltech Inc., Trouw Nutrition, Kemin Industries, Novus International Inc., Balchem Corporation, DSM Nutritional Products, Phibro Animal Health Corporation, ADM Animal Nutrition, BASF SE, Vitamins China, Bluestar Adisseo Company, Nutreco N.V., Pancosma S.A., Solgar Inc., NOW Foods, Garden of Life, Thorne Research, Pure Encapsulations, Metagenics, Bluebonnet Nutrition, MegaFood, and Nature’s Bounty
Additional Attributes Dollar sales by mineral type, share by form, regional demand growth, regulatory influence, sustainability trends, competitive benchmarking

Key Segmentation

By Mineral Type:

As per mineral type, the market has been categorized into zinc, copper, manganese, iron, selenium, chromium, and others.

By Application Type:

As per application type, the market has been categorized into animal feed (ruminants, swine, poultry, aquaculture, equine, pets, others), and human nutrition.

By Form:

This segment is further categorized into powder, liquid, premixes, granules, and bolus.

By End User:

As per application, the market has been categorized into commercial feed manufacturers, individual farmers & ranchers, veterinary use, animal supplements producers, and dietary supplements & fortified food manufacturers.

By Region:

Industry analysis has been carried out in key countries of North America, Latin America, Europe, East Asia, South Asia, Oceania, and the Middle East & Africa.

Table of Content

  1. Executive Summary
    • Global Market Outlook
    • Demand-side Trends
    • Supply-side Trends
    • Technology Roadmap Analysis
    • Analysis and Recommendations
  2. Market Overview
    • Market Coverage/Taxonomy
    • Market Definition/Scope/Limitations
  3. Market Background
    • Market Dynamics
      • Drivers
      • Restraints
      • Opportunity
      • Trends
    • Scenario Forecast
      • Demand in Optimistic Scenario
      • Demand in Likely Scenario
      • Demand in Conservative Scenario
    • Opportunity Map Analysis
    • Product Life Cycle Analysis
    • Supply Chain Analysis
      • Supply Side Participants and their Roles
        • Producers
        • Mid-Level Participants (Traders/ Agents/ Brokers)
        • Wholesalers and Distributors
      • Value Added and Value Created at Node in the Supply Chain
      • List of Raw Material Suppliers
      • List of Existing and Potential Buyer’s
    • Investment Feasibility Matrix
    • Value Chain Analysis
      • Profit Margin Analysis
      • Wholesalers and Distributors
      • Retailers
    • PESTLE and Porter’s Analysis
    • Regulatory Landscape
      • By Key Regions
      • By Key Countries
    • Regional Parent Market Outlook
    • Production and Consumption Statistics
    • Import and Export Statistics
  4. Global Market Analysis 2020 to 2024 and Forecast, 2025 to 2035
    • Historical Market Size Value (USD Million) & Volume (Units) Analysis, 2020 to 2024
    • Current and Future Market Size Value (USD Million) & Volume (Units) Projections, 2025 to 2035
      • Y-o-Y Growth Trend Analysis
      • Absolute $ Opportunity Analysis
  5. Global Market Pricing Analysis 2020 to 2024 and Forecast 2025 to 2035
  6. Global Market Analysis 2020 to 2024 and Forecast 2025 to 2035, By Mineral Type
    • Introduction/Key Findings
    • Historical Market Size Value (USD Million) & Volume (Units) Analysis By Mineral Type, 2020 to 2024
    • Current and Future Market Size Value (USD Million) & Volume (Units) Analysis and Forecast By Mineral Type, 2025 to 2035
      • Zinc
      • Copper
      • Manganese
      • Iron
      • Selenium
      • Chromium
      • Others (Cobalt, Iodine, Boron, Molybdenum)
    • Y-o-Y Growth Trend Analysis By Mineral Type, 2020 to 2024
    • Absolute $ Opportunity Analysis By Mineral Type, 2025 to 2035
  7. Global Market Analysis 2020 to 2024 and Forecast 2025 to 2035, By Application Type
    • Introduction/Key Findings
    • Historical Market Size Value (USD Million) & Volume (Units) Analysis By Application Type, 2020 to 2024
    • Current and Future Market Size Value (USD Million) & Volume (Units) Analysis and Forecast By Application Type, 2025 to 2035
      • Animal Feed
        • Ruminants
        • Swine
        • Poultry
        • Aquaculture
        • Equine
        • Pets
        • Others
      • Human Nutrition
    • Y-o-Y Growth Trend Analysis By Application Type, 2020 to 2024
    • Absolute $ Opportunity Analysis By Application Type, 2025 to 2035
  8. Global Market Analysis 2020 to 2024 and Forecast 2025 to 2035, By Form
    • Introduction/Key Findings
    • Historical Market Size Value (USD Million) & Volume (Units) Analysis By Form, 2020 to 2024
    • Current and Future Market Size Value (USD Million) & Volume (Units) Analysis and Forecast By Form, 2025 to 2035
      • Powder
      • Liquid
      • Premixes
      • Granules
      • Bolus
    • Y-o-Y Growth Trend Analysis By Form, 2020 to 2024
    • Absolute $ Opportunity Analysis By Form, 2025 to 2035
  9. Global Market Analysis 2020 to 2024 and Forecast 2025 to 2035, By End User
    • Introduction/Key Findings
    • Historical Market Size Value (USD Million) & Volume (Units) Analysis By End User, 2020 to 2024
    • Current and Future Market Size Value (USD Million) & Volume (Units) Analysis and Forecast By End User, 2025 to 2035
      • Commercial Feed Manufacturers
      • Individual Farmers & Ranchers
      • Veterinary Use
      • Animal Supplements Producers
      • Dietary Supplements & Fortified Food Manufacturers
    • Y-o-Y Growth Trend Analysis By End User, 2020 to 2024
    • Absolute $ Opportunity Analysis By End User, 2025 to 2035
  10. Global Market Analysis 2020 to 2024 and Forecast 2025 to 2035, By Region
    • Introduction
    • Historical Market Size Value (USD Million) & Volume (Units) Analysis By Region, 2020 to 2024
    • Current Market Size Value (USD Million) & Volume (Units) Analysis and Forecast By Region, 2025 to 2035
      • North America
      • Latin America
      • Western Europe
      • Eastern Europe
      • East Asia
      • South Asia & Pacific
      • Middle East and Africa
    • Market Attractiveness Analysis By Region
  11. North America Market Analysis 2020 to 2024 and Forecast 2025 to 2035, By Country
    • Historical Market Size Value (USD Million) & Volume (Units) Trend Analysis By Market Taxonomy, 2020 to 2024
    • Market Size Value (USD Million) & Volume (Units) Forecast By Market Taxonomy, 2025 to 2035
      • By Country
        • USA
        • Canada
        • Mexico
      • By Mineral Type
      • By Application Type
      • By Form
      • By End User
    • Market Attractiveness Analysis
      • By Country
      • By Mineral Type
      • By Application Type
      • By Form
      • By End User
    • Key Takeaways
  12. Latin America Market Analysis 2020 to 2024 and Forecast 2025 to 2035, By Country
    • Historical Market Size Value (USD Million) & Volume (Units) Trend Analysis By Market Taxonomy, 2020 to 2024
    • Market Size Value (USD Million) & Volume (Units) Forecast By Market Taxonomy, 2025 to 2035
      • By Country
        • Brazil
        • Argentina
        • Rest of LATAM
      • By Mineral Type
      • By Application Type
      • By Form
      • By End User
    • Market Attractiveness Analysis
      • By Country
      • By Mineral Type
      • By Application Type
      • By Form
      • By End User
    • Key Takeaways
  13. Western Europe Market Analysis 2020 to 2024 and Forecast 2025 to 2035, By Country
    • Historical Market Size Value (USD Million) & Volume (Units) Trend Analysis By Market Taxonomy, 2020 to 2024
    • Market Size Value (USD Million) & Volume (Units) Forecast By Market Taxonomy, 2025 to 2035
      • By Country
        • Germany
        • Italy
        • France
        • UK
        • Spain
        • BENELUX
        • Nordic
        • Rest of W.Europe
      • By Mineral Type
      • By Application Type
      • By Form
      • By End User
    • Market Attractiveness Analysis
      • By Country
      • By Mineral Type
      • By Application Type
      • By Form
      • By End User
    • Key Takeaways
  14. Eastern Europe Market Analysis 2020 to 2024 and Forecast 2025 to 2035, By Country
    • Historical Market Size Value (USD Million) & Volume (Units) Trend Analysis By Market Taxonomy, 2020 to 2024
    • Market Size Value (USD Million) & Volume (Units) Forecast By Market Taxonomy, 2025 to 2035
      • By Country
        • Russia
        • Hungary
        • Poland
        • Balkan & Baltics
        • Rest of E. Europe
      • By Mineral Type
      • By Application Type
      • By Form
      • By End User
    • Market Attractiveness Analysis
      • By Country
      • By Mineral Type
      • By Application Type
      • By Form
      • By End User
    • Key Takeaways
  15. East Asia Market Analysis 2020 to 2024 and Forecast 2025 to 2035, By Country
    • Historical Market Size Value (USD Million) & Volume (Units) Trend Analysis By Market Taxonomy, 2020 to 2024
    • Market Size Value (USD Million) & Volume (Units) Forecast By Market Taxonomy, 2025 to 2035
      • By Country
        • China
        • Japan
        • South Korea
      • By Mineral Type
      • By Application Type
      • By Form
      • By End User
    • Market Attractiveness Analysis
      • By Country
      • By Mineral Type
      • By Application Type
      • By Form
      • By End User
    • Key Takeaways
  16. South Asia & Pacific Market Analysis 2020 to 2024 and Forecast 2025 to 2035, By Country
    • Historical Market Size Value (USD Million) & Volume (Units) Trend Analysis By Market Taxonomy, 2020 to 2024
    • Market Size Value (USD Million) & Volume (Units) Forecast By Market Taxonomy, 2025 to 2035
      • By Country
        • India
        • Australia & New Zealand
        • ASEAN
        • Rest of SAP
      • By Mineral Type
      • By Application Type
      • By Form
      • By End User
    • Market Attractiveness Analysis
      • By Country
      • By Mineral Type
      • By Application Type
      • By Form
      • By End User
    • Key Takeaways
  17. Middle East and Africa Market Analysis 2020 to 2024 and Forecast 2025 to 2035, By Country
    • Historical Market Size Value (USD Million) & Volume (Units) Trend Analysis By Market Taxonomy, 2020 to 2024
    • Market Size Value (USD Million) & Volume (Units) Forecast By Market Taxonomy, 2025 to 2035
      • By Country
        • GCC Countries
        • Northern Africa
        • South Africa
        • Turkiye
        • Rest of MEA
      • By Mineral Type
      • By Application Type
      • By Form
      • By End User
    • Market Attractiveness Analysis
      • By Country
      • By Mineral Type
      • By Application Type
      • By Form
      • By End User
    • Key Takeaways
  18. Key Countries Market Analysis
    • USA
      • Pricing Analysis
      • Market Share Analysis, 2024
        • By Mineral Type
        • By Application Type
        • By Form
        • By End User
    • Canada
      • Pricing Analysis
      • Market Share Analysis, 2024
        • By Mineral Type
        • By Application Type
        • By Form
        • By End User
    • Brazil
      • Pricing Analysis
      • Market Share Analysis, 2024
        • By Mineral Type
        • By Application Type
        • By Form
        • By End User
    • Mexico
      • Pricing Analysis
      • Market Share Analysis, 2024
        • By Mineral Type
        • By Application Type
        • By Form
        • By End User
    • Argentina
      • Pricing Analysis
      • Market Share Analysis, 2024
        • By Mineral Type
        • By Application Type
        • By Form
        • By End User
  19. Market Structure Analysis
    • Competition Dashboard
    • Competition Benchmarking
    • Market Share Analysis of Top Players
      • By Regional
      • By Mineral Type
      • By Application Type
      • By Form
      • By End User
  20. Competition Analysis
    • Competition Deep Dive
      • Zinpro Corporation
        • Overview
        • Product Portfolio
        • Profitability by Market Segments (Product/Age /Sales Channel/Region)
        • Sales Footprint
        • Strategy Overview
          • Marketing Strategy
          • Product Strategy
          • Channel Strategy
      • Alltech Inc.
        • Overview
        • Product Portfolio
        • Profitability by Market Segments (Product/Age /Sales Channel/Region)
        • Sales Footprint
        • Strategy Overview
          • Marketing Strategy
          • Product Strategy
          • Channel Strategy
      • Trouw Nutrition
        • Overview
        • Product Portfolio
        • Profitability by Market Segments (Product/Age /Sales Channel/Region)
        • Sales Footprint
        • Strategy Overview
          • Marketing Strategy
          • Product Strategy
          • Channel Strategy
      • Kemin Industries
        • Overview
        • Product Portfolio
        • Profitability by Market Segments (Product/Age /Sales Channel/Region)
        • Sales Footprint
        • Strategy Overview
          • Marketing Strategy
          • Product Strategy
          • Channel Strategy
      • Novus International, Inc.
        • Overview
        • Product Portfolio
        • Profitability by Market Segments (Product/Age /Sales Channel/Region)
        • Sales Footprint
        • Strategy Overview
          • Marketing Strategy
          • Product Strategy
          • Channel Strategy
      • Balchem Corporation
        • Overview
        • Product Portfolio
        • Profitability by Market Segments (Product/Age /Sales Channel/Region)
        • Sales Footprint
        • Strategy Overview
          • Marketing Strategy
          • Product Strategy
          • Channel Strategy
      • DSM Nutritional Products
        • Overview
        • Product Portfolio
        • Profitability by Market Segments (Product/Age /Sales Channel/Region)
        • Sales Footprint
        • Strategy Overview
          • Marketing Strategy
          • Product Strategy
          • Channel Strategy
      • Phibro Animal Health Corporation
        • Overview
        • Product Portfolio
        • Profitability by Market Segments (Product/Age /Sales Channel/Region)
        • Sales Footprint
        • Strategy Overview
          • Marketing Strategy
          • Product Strategy
          • Channel Strategy
      • ADM Animal Nutrition
        • Overview
        • Product Portfolio
        • Profitability by Market Segments (Product/Age /Sales Channel/Region)
        • Sales Footprint
        • Strategy Overview
          • Marketing Strategy
          • Product Strategy
          • Channel Strategy
      • BASF SE
        • Overview
        • Product Portfolio
        • Profitability by Market Segments (Product/Age /Sales Channel/Region)
        • Sales Footprint
        • Strategy Overview
          • Marketing Strategy
          • Product Strategy
          • Channel Strategy
      • Vitamins China
        • Overview
        • Product Portfolio
        • Profitability by Market Segments (Product/Age /Sales Channel/Region)
        • Sales Footprint
        • Strategy Overview
          • Marketing Strategy
          • Product Strategy
          • Channel Strategy
      • Bluestar Adisseo Company
        • Overview
        • Product Portfolio
        • Profitability by Market Segments (Product/Age /Sales Channel/Region)
        • Sales Footprint
        • Strategy Overview
          • Marketing Strategy
          • Product Strategy
          • Channel Strategy
      • Nutreco N.V.
        • Overview
        • Product Portfolio
        • Profitability by Market Segments (Product/Age /Sales Channel/Region)
        • Sales Footprint
        • Strategy Overview
          • Marketing Strategy
          • Product Strategy
          • Channel Strategy
      • Pancosma S.A.
        • Overview
        • Product Portfolio
        • Profitability by Market Segments (Product/Age /Sales Channel/Region)
        • Sales Footprint
        • Strategy Overview
          • Marketing Strategy
          • Product Strategy
          • Channel Strategy
      • Solgar, Inc.
        • Overview
        • Product Portfolio
        • Profitability by Market Segments (Product/Age /Sales Channel/Region)
        • Sales Footprint
        • Strategy Overview
          • Marketing Strategy
          • Product Strategy
          • Channel Strategy
      • NOW Foods
        • Overview
        • Product Portfolio
        • Profitability by Market Segments (Product/Age /Sales Channel/Region)
        • Sales Footprint
        • Strategy Overview
          • Marketing Strategy
          • Product Strategy
          • Channel Strategy
      • Garden of Life
        • Overview
        • Product Portfolio
        • Profitability by Market Segments (Product/Age /Sales Channel/Region)
        • Sales Footprint
        • Strategy Overview
          • Marketing Strategy
          • Product Strategy
          • Channel Strategy
      • Thorne Research
        • Overview
        • Product Portfolio
        • Profitability by Market Segments (Product/Age /Sales Channel/Region)
        • Sales Footprint
        • Strategy Overview
          • Marketing Strategy
          • Product Strategy
          • Channel Strategy
      • Pure Encapsulations
        • Overview
        • Product Portfolio
        • Profitability by Market Segments (Product/Age /Sales Channel/Region)
        • Sales Footprint
        • Strategy Overview
          • Marketing Strategy
          • Product Strategy
          • Channel Strategy
      • Others
        • Overview
        • Product Portfolio
        • Profitability by Market Segments (Product/Age /Sales Channel/Region)
        • Sales Footprint
        • Strategy Overview
          • Marketing Strategy
          • Product Strategy
          • Channel Strategy
  21. Assumptions & Acronyms Used
  22. Research Methodology

List of Tables

  • Table 1: Global Market Value (USD Million) Forecast by Region, 2020-2035
  • Table 2: Global Market Volume (Units) Forecast by Region, 2020-2035
  • Table 3: Global Market Value (USD Million) Forecast by Mineral Type, 2020-2035
  • Table 4: Global Market Volume (Units) Forecast by Mineral Type, 2020-2035
  • Table 5: Global Market Value (USD Million) Forecast by Application Type, 2020-2035
  • Table 6: Global Market Volume (Units) Forecast by Application Type, 2020-2035
  • Table 7: Global Market Value (USD Million) Forecast by Form, 2020-2035
  • Table 8: Global Market Volume (Units) Forecast by Form, 2020-2035
  • Table 9: Global Market Value (USD Million) Forecast by End User, 2020-2035
  • Table 10: Global Market Volume (Units) Forecast by End User, 2020-2035
  • Table 11: North America Market Value (USD Million) Forecast by Country, 2020-2035
  • Table 12: North America Market Volume (Units) Forecast by Country, 2020-2035
  • Table 13: North America Market Value (USD Million) Forecast by Mineral Type, 2020-2035
  • Table 14: North America Market Volume (Units) Forecast by Mineral Type, 2020-2035
  • Table 15: North America Market Value (USD Million) Forecast by Application Type, 2020-2035
  • Table 16: North America Market Volume (Units) Forecast by Application Type, 2020-2035
  • Table 17: North America Market Value (USD Million) Forecast by Form, 2020-2035
  • Table 18: North America Market Volume (Units) Forecast by Form, 2020-2035
  • Table 19: North America Market Value (USD Million) Forecast by End User, 2020-2035
  • Table 20: North America Market Volume (Units) Forecast by End User, 2020-2035
  • Table 21: Latin America Market Value (USD Million) Forecast by Country, 2020-2035
  • Table 22: Latin America Market Volume (Units) Forecast by Country, 2020-2035
  • Table 23: Latin America Market Value (USD Million) Forecast by Mineral Type, 2020-2035
  • Table 24: Latin America Market Volume (Units) Forecast by Mineral Type, 2020-2035
  • Table 25: Latin America Market Value (USD Million) Forecast by Application Type, 2020-2035
  • Table 26: Latin America Market Volume (Units) Forecast by Application Type, 2020-2035
  • Table 27: Latin America Market Value (USD Million) Forecast by Form, 2020-2035
  • Table 28: Latin America Market Volume (Units) Forecast by Form, 2020-2035
  • Table 29: Latin America Market Value (USD Million) Forecast by End User, 2020-2035
  • Table 30: Latin America Market Volume (Units) Forecast by End User, 2020-2035
  • Table 31: Western Europe Market Value (USD Million) Forecast by Country, 2020-2035
  • Table 32: Western Europe Market Volume (Units) Forecast by Country, 2020-2035
  • Table 33: Western Europe Market Value (USD Million) Forecast by Mineral Type, 2020-2035
  • Table 34: Western Europe Market Volume (Units) Forecast by Mineral Type, 2020-2035
  • Table 35: Western Europe Market Value (USD Million) Forecast by Application Type, 2020-2035
  • Table 36: Western Europe Market Volume (Units) Forecast by Application Type, 2020-2035
  • Table 37: Western Europe Market Value (USD Million) Forecast by Form, 2020-2035
  • Table 38: Western Europe Market Volume (Units) Forecast by Form, 2020-2035
  • Table 39: Western Europe Market Value (USD Million) Forecast by End User, 2020-2035
  • Table 40: Western Europe Market Volume (Units) Forecast by End User, 2020-2035
  • Table 41: Eastern Europe Market Value (USD Million) Forecast by Country, 2020-2035
  • Table 42: Eastern Europe Market Volume (Units) Forecast by Country, 2020-2035
  • Table 43: Eastern Europe Market Value (USD Million) Forecast by Mineral Type, 2020-2035
  • Table 44: Eastern Europe Market Volume (Units) Forecast by Mineral Type, 2020-2035
  • Table 45: Eastern Europe Market Value (USD Million) Forecast by Application Type, 2020-2035
  • Table 46: Eastern Europe Market Volume (Units) Forecast by Application Type, 2020-2035
  • Table 47: Eastern Europe Market Value (USD Million) Forecast by Form, 2020-2035
  • Table 48: Eastern Europe Market Volume (Units) Forecast by Form, 2020-2035
  • Table 49: Eastern Europe Market Value (USD Million) Forecast by End User, 2020-2035
  • Table 50: Eastern Europe Market Volume (Units) Forecast by End User, 2020-2035
  • Table 51: East Asia Market Value (USD Million) Forecast by Country, 2020-2035
  • Table 52: East Asia Market Volume (Units) Forecast by Country, 2020-2035
  • Table 53: East Asia Market Value (USD Million) Forecast by Mineral Type, 2020-2035
  • Table 54: East Asia Market Volume (Units) Forecast by Mineral Type, 2020-2035
  • Table 55: East Asia Market Value (USD Million) Forecast by Application Type, 2020-2035
  • Table 56: East Asia Market Volume (Units) Forecast by Application Type, 2020-2035
  • Table 57: East Asia Market Value (USD Million) Forecast by Form, 2020-2035
  • Table 58: East Asia Market Volume (Units) Forecast by Form, 2020-2035
  • Table 59: East Asia Market Value (USD Million) Forecast by End User, 2020-2035
  • Table 60: East Asia Market Volume (Units) Forecast by End User, 2020-2035
  • Table 61: South Asia & Pacific Market Value (USD Million) Forecast by Country, 2020-2035
  • Table 62: South Asia & Pacific Market Volume (Units) Forecast by Country, 2020-2035
  • Table 63: South Asia & Pacific Market Value (USD Million) Forecast by Mineral Type, 2020-2035
  • Table 64: South Asia & Pacific Market Volume (Units) Forecast by Mineral Type, 2020-2035
  • Table 65: South Asia & Pacific Market Value (USD Million) Forecast by Application Type, 2020-2035
  • Table 66: South Asia & Pacific Market Volume (Units) Forecast by Application Type, 2020-2035
  • Table 67: South Asia & Pacific Market Value (USD Million) Forecast by Form, 2020-2035
  • Table 68: South Asia & Pacific Market Volume (Units) Forecast by Form, 2020-2035
  • Table 69: South Asia & Pacific Market Value (USD Million) Forecast by End User, 2020-2035
  • Table 70: South Asia & Pacific Market Volume (Units) Forecast by End User, 2020-2035
  • Table 71: Middle East and Africa Market Value (USD Million) Forecast by Country, 2020-2035
  • Table 72: Middle East and Africa Market Volume (Units) Forecast by Country, 2020-2035
  • Table 73: Middle East and Africa Market Value (USD Million) Forecast by Mineral Type, 2020-2035
  • Table 74: Middle East and Africa Market Volume (Units) Forecast by Mineral Type, 2020-2035
  • Table 75: Middle East and Africa Market Value (USD Million) Forecast by Application Type, 2020-2035
  • Table 76: Middle East and Africa Market Volume (Units) Forecast by Application Type, 2020-2035
  • Table 77: Middle East and Africa Market Value (USD Million) Forecast by Form, 2020-2035
  • Table 78: Middle East and Africa Market Volume (Units) Forecast by Form, 2020-2035
  • Table 79: Middle East and Africa Market Value (USD Million) Forecast by End User, 2020-2035
  • Table 80: Middle East and Africa Market Volume (Units) Forecast by End User, 2020-2035

List of Figures

  • Figure 1: Global Market Volume (Units) Forecast 2020-2035
  • Figure 2: Global Market Pricing Analysis
  • Figure 3: Global Market Value (USD Million) Forecast 2020-2035
  • Figure 4: Global Market Value Share and BPS Analysis by Mineral Type, 2025 and 2035
  • Figure 5: Global Market Y-o-Y Growth Comparison by Mineral Type, 2025-2035
  • Figure 6: Global Market Attractiveness Analysis by Mineral Type
  • Figure 7: Global Market Value Share and BPS Analysis by Application Type, 2025 and 2035
  • Figure 8: Global Market Y-o-Y Growth Comparison by Application Type, 2025-2035
  • Figure 9: Global Market Attractiveness Analysis by Application Type
  • Figure 10: Global Market Value Share and BPS Analysis by Form, 2025 and 2035
  • Figure 11: Global Market Y-o-Y Growth Comparison by Form, 2025-2035
  • Figure 12: Global Market Attractiveness Analysis by Form
  • Figure 13: Global Market Value Share and BPS Analysis by End User, 2025 and 2035
  • Figure 14: Global Market Y-o-Y Growth Comparison by End User, 2025-2035
  • Figure 15: Global Market Attractiveness Analysis by End User
  • Figure 16: Global Market Value (USD Million) Share and BPS Analysis by Region, 2025 and 2035
  • Figure 17: Global Market Y-o-Y Growth Comparison by Region, 2025-2035
  • Figure 18: Global Market Attractiveness Analysis by Region
  • Figure 19: North America Market Incremental $ Opportunity, 2025-2035
  • Figure 20: Latin America Market Incremental $ Opportunity, 2025-2035
  • Figure 21: Western Europe Market Incremental $ Opportunity, 2025-2035
  • Figure 22: Eastern Europe Market Incremental $ Opportunity, 2025-2035
  • Figure 23: East Asia Market Incremental $ Opportunity, 2025-2035
  • Figure 24: South Asia & Pacific Market Incremental $ Opportunity, 2025-2035
  • Figure 25: Middle East and Africa Market Incremental $ Opportunity, 2025-2035
  • Figure 26: North America Market Value Share and BPS Analysis by Country, 2025 and 2035
  • Figure 27: North America Market Value Share and BPS Analysis by Mineral Type, 2025 and 2035
  • Figure 28: North America Market Y-o-Y Growth Comparison by Mineral Type, 2025-2035
  • Figure 29: North America Market Attractiveness Analysis by Mineral Type
  • Figure 30: North America Market Value Share and BPS Analysis by Application Type, 2025 and 2035
  • Figure 31: North America Market Y-o-Y Growth Comparison by Application Type, 2025-2035
  • Figure 32: North America Market Attractiveness Analysis by Application Type
  • Figure 33: North America Market Value Share and BPS Analysis by Form, 2025 and 2035
  • Figure 34: North America Market Y-o-Y Growth Comparison by Form, 2025-2035
  • Figure 35: North America Market Attractiveness Analysis by Form
  • Figure 36: North America Market Value Share and BPS Analysis by End User, 2025 and 2035
  • Figure 37: North America Market Y-o-Y Growth Comparison by End User, 2025-2035
  • Figure 38: North America Market Attractiveness Analysis by End User
  • Figure 39: Latin America Market Value Share and BPS Analysis by Country, 2025 and 2035
  • Figure 40: Latin America Market Value Share and BPS Analysis by Mineral Type, 2025 and 2035
  • Figure 41: Latin America Market Y-o-Y Growth Comparison by Mineral Type, 2025-2035
  • Figure 42: Latin America Market Attractiveness Analysis by Mineral Type
  • Figure 43: Latin America Market Value Share and BPS Analysis by Application Type, 2025 and 2035
  • Figure 44: Latin America Market Y-o-Y Growth Comparison by Application Type, 2025-2035
  • Figure 45: Latin America Market Attractiveness Analysis by Application Type
  • Figure 46: Latin America Market Value Share and BPS Analysis by Form, 2025 and 2035
  • Figure 47: Latin America Market Y-o-Y Growth Comparison by Form, 2025-2035
  • Figure 48: Latin America Market Attractiveness Analysis by Form
  • Figure 49: Latin America Market Value Share and BPS Analysis by End User, 2025 and 2035
  • Figure 50: Latin America Market Y-o-Y Growth Comparison by End User, 2025-2035
  • Figure 51: Latin America Market Attractiveness Analysis by End User
  • Figure 52: Western Europe Market Value Share and BPS Analysis by Country, 2025 and 2035
  • Figure 53: Western Europe Market Value Share and BPS Analysis by Mineral Type, 2025 and 2035
  • Figure 54: Western Europe Market Y-o-Y Growth Comparison by Mineral Type, 2025-2035
  • Figure 55: Western Europe Market Attractiveness Analysis by Mineral Type
  • Figure 56: Western Europe Market Value Share and BPS Analysis by Application Type, 2025 and 2035
  • Figure 57: Western Europe Market Y-o-Y Growth Comparison by Application Type, 2025-2035
  • Figure 58: Western Europe Market Attractiveness Analysis by Application Type
  • Figure 59: Western Europe Market Value Share and BPS Analysis by Form, 2025 and 2035
  • Figure 60: Western Europe Market Y-o-Y Growth Comparison by Form, 2025-2035
  • Figure 61: Western Europe Market Attractiveness Analysis by Form
  • Figure 62: Western Europe Market Value Share and BPS Analysis by End User, 2025 and 2035
  • Figure 63: Western Europe Market Y-o-Y Growth Comparison by End User, 2025-2035
  • Figure 64: Western Europe Market Attractiveness Analysis by End User
  • Figure 65: Eastern Europe Market Value Share and BPS Analysis by Country, 2025 and 2035
  • Figure 66: Eastern Europe Market Value Share and BPS Analysis by Mineral Type, 2025 and 2035
  • Figure 67: Eastern Europe Market Y-o-Y Growth Comparison by Mineral Type, 2025-2035
  • Figure 68: Eastern Europe Market Attractiveness Analysis by Mineral Type
  • Figure 69: Eastern Europe Market Value Share and BPS Analysis by Application Type, 2025 and 2035
  • Figure 70: Eastern Europe Market Y-o-Y Growth Comparison by Application Type, 2025-2035
  • Figure 71: Eastern Europe Market Attractiveness Analysis by Application Type
  • Figure 72: Eastern Europe Market Value Share and BPS Analysis by Form, 2025 and 2035
  • Figure 73: Eastern Europe Market Y-o-Y Growth Comparison by Form, 2025-2035
  • Figure 74: Eastern Europe Market Attractiveness Analysis by Form
  • Figure 75: Eastern Europe Market Value Share and BPS Analysis by End User, 2025 and 2035
  • Figure 76: Eastern Europe Market Y-o-Y Growth Comparison by End User, 2025-2035
  • Figure 77: Eastern Europe Market Attractiveness Analysis by End User
  • Figure 78: East Asia Market Value Share and BPS Analysis by Country, 2025 and 2035
  • Figure 79: East Asia Market Value Share and BPS Analysis by Mineral Type, 2025 and 2035
  • Figure 80: East Asia Market Y-o-Y Growth Comparison by Mineral Type, 2025-2035
  • Figure 81: East Asia Market Attractiveness Analysis by Mineral Type
  • Figure 82: East Asia Market Value Share and BPS Analysis by Application Type, 2025 and 2035
  • Figure 83: East Asia Market Y-o-Y Growth Comparison by Application Type, 2025-2035
  • Figure 84: East Asia Market Attractiveness Analysis by Application Type
  • Figure 85: East Asia Market Value Share and BPS Analysis by Form, 2025 and 2035
  • Figure 86: East Asia Market Y-o-Y Growth Comparison by Form, 2025-2035
  • Figure 87: East Asia Market Attractiveness Analysis by Form
  • Figure 88: East Asia Market Value Share and BPS Analysis by End User, 2025 and 2035
  • Figure 89: East Asia Market Y-o-Y Growth Comparison by End User, 2025-2035
  • Figure 90: East Asia Market Attractiveness Analysis by End User
  • Figure 91: South Asia & Pacific Market Value Share and BPS Analysis by Country, 2025 and 2035
  • Figure 92: South Asia & Pacific Market Value Share and BPS Analysis by Mineral Type, 2025 and 2035
  • Figure 93: South Asia & Pacific Market Y-o-Y Growth Comparison by Mineral Type, 2025-2035
  • Figure 94: South Asia & Pacific Market Attractiveness Analysis by Mineral Type
  • Figure 95: South Asia & Pacific Market Value Share and BPS Analysis by Application Type, 2025 and 2035
  • Figure 96: South Asia & Pacific Market Y-o-Y Growth Comparison by Application Type, 2025-2035
  • Figure 97: South Asia & Pacific Market Attractiveness Analysis by Application Type
  • Figure 98: South Asia & Pacific Market Value Share and BPS Analysis by Form, 2025 and 2035
  • Figure 99: South Asia & Pacific Market Y-o-Y Growth Comparison by Form, 2025-2035
  • Figure 100: South Asia & Pacific Market Attractiveness Analysis by Form
  • Figure 101: South Asia & Pacific Market Value Share and BPS Analysis by End User, 2025 and 2035
  • Figure 102: South Asia & Pacific Market Y-o-Y Growth Comparison by End User, 2025-2035
  • Figure 103: South Asia & Pacific Market Attractiveness Analysis by End User
  • Figure 104: Middle East and Africa Market Value Share and BPS Analysis by Country, 2025 and 2035
  • Figure 105: Middle East and Africa Market Value Share and BPS Analysis by Mineral Type, 2025 and 2035
  • Figure 106: Middle East and Africa Market Y-o-Y Growth Comparison by Mineral Type, 2025-2035
  • Figure 107: Middle East and Africa Market Attractiveness Analysis by Mineral Type
  • Figure 108: Middle East and Africa Market Value Share and BPS Analysis by Application Type, 2025 and 2035
  • Figure 109: Middle East and Africa Market Y-o-Y Growth Comparison by Application Type, 2025-2035
  • Figure 110: Middle East and Africa Market Attractiveness Analysis by Application Type
  • Figure 111: Middle East and Africa Market Value Share and BPS Analysis by Form, 2025 and 2035
  • Figure 112: Middle East and Africa Market Y-o-Y Growth Comparison by Form, 2025-2035
  • Figure 113: Middle East and Africa Market Attractiveness Analysis by Form
  • Figure 114: Middle East and Africa Market Value Share and BPS Analysis by End User, 2025 and 2035
  • Figure 115: Middle East and Africa Market Y-o-Y Growth Comparison by End User, 2025-2035
  • Figure 116: Middle East and Africa Market Attractiveness Analysis by End User
  • Figure 117: Global Market - Tier Structure Analysis
  • Figure 118: Global Market - Company Share Analysis

Frequently Asked Questions

What is the projected size of the organic trace minerals market in 2025?

The market is valued at USD 996 million in 2025.

What is the outlook on organic trace minerals demand by 2035?

The market is forecasted to reach USD 1,880 million by 2035, reflecting a CAGR of 6.5%.

Which segment leads the organic trace minerals market by mineral type in 2025?

Zinc will lead the mineral type segment, accounting for 33% of the global market share in 2025.

What is the top end user for the organic trace minerals market in 2025?

Commercial feed manufacturers will dominate the end user segment with a 35% share in 2025.

Which country is projected to have the fastest-growing organic trace minerals market?

Germany is projected to grow at the fastest rate, with a CAGR of 5.7% from 2025 to 2035.

Explore Similar Insights

Future Market Insights

Organic Trace Minerals Market