Organic Food and Beverage Market Outlook

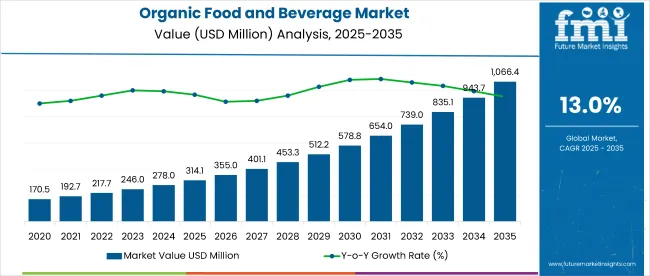
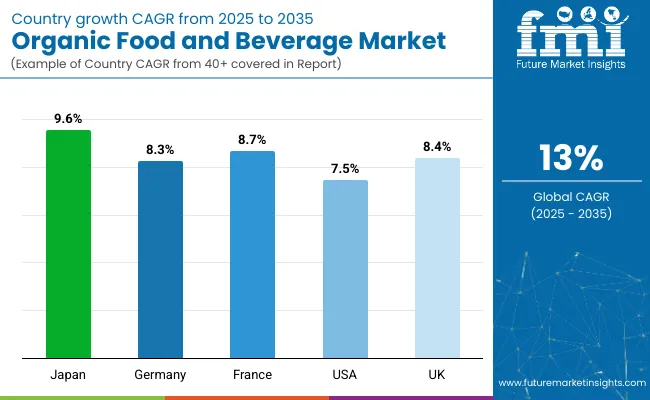
The organic food and beverage market, from 2024 to 2034, is expected to trace an extraordinary course, showing a strong growth rate. Furthermore, this growth of the organic food and beverages market is likely to be a CAGR of 13% during the forecast period.

From an initial estimate of USD 278 million in 2024 to USD 639.4 million by 2034, this growth rate hence represents the booming consumer trend for organic products, mainly coming from growing health awareness and environmental concerns.

Attributes Details
Market Value for 2024 USD 278 million
Market Value for 2034 USD 639.4 million
Market CAGR from 2024 to 2034 13%

Don't pay for what you don't need

Customize your report by selecting specific countries or regions and save 30%!

Catalysts Behind the Growth of the Organic Food and Beverage Market

The organic product industry inflates energetically as the goods contain no harmful chemicals and leave no residue. Compared to conventional fruits and vegetables accessible in the markets, they are remarkably healthy and beneficial for the environment. The same reasons also augment the demand for organic food and beverages as consumers’ comprehension of the boons of natural products that are not genetically modified intensifies.

Sales of organic vegetables have spurred, owing to the subscription packages over e-commerce websites made for the sale of organic food and beverages. The sales of organic foods and drinks from e-retailers have notably heightened because of the broad usage of online delivery services.

Attributes Details
Market Value for 2019 USD 122.30 million
Market CAGR from 2019 to 2023 11.20%

Category-wise Outlook

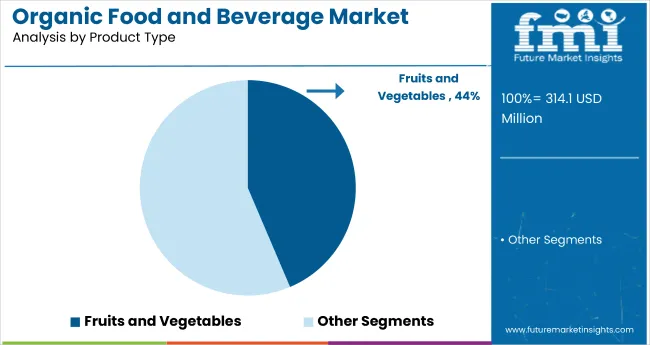
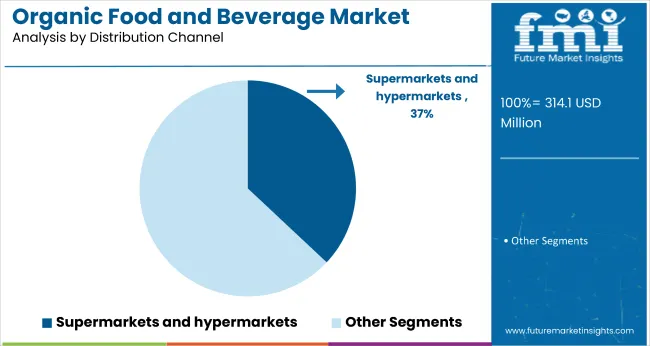
The segmented organic food and beverage market analysis is included in the following subsection. Based on comprehensive studies, the fruits and vegetables sector are prevailing the product type category. Similarly, the hypermarket/supermarket segment is governing the distribution channel category.

Health Benefits is the Catalyst for Organic Fruits and Vegetables Sales

Segment Fruits and Vegetables
Share (2024) 43.60%

The fruits and vegetables segment occupies a predominant position because consumers have started realizing the health benefits associated with the consumption of organic products. Surging concerns related to chemicals and pesticides used in conventional farming methods are strengthening the demand for organic fruits and vegetables.

The organic shift aligns with the booming interest in ecologically friendly farming methods, which ramps up the demand for organic fruits and vegetables. The high sales volumes of fruits and vegetables are augmented by the potential in a spectrum of culinary applications.

Promotional Strategies in Hypermarket/Supermarket Amplify Sales of Organic Food and Beverages

Segment Hypermarket/Supermarket
Share (2024) 37.40%

The impulsive buying of organic products is enhanced by convenient one-stop shopping at supermarkets and hypermarkets. Consumers perceive supermarkets and hypermarkets as trustworthy vendors of organic goods.

Cost-sensitive consumers look for bulk purchase options for organic products from supermarkets and hypermarkets. The dynamic distribution channel and logistics of supermarkets and hypermarkets, ensure that organic products are always in stock to meet the rising demand.

Nandini Roy Choudhury

Principal Consultant

Talk to Analyst

Find your sweet spots for generating winning opportunities in this market.

Country-wise Analysis

The market can be viewed in the tables below, featuring some of the world's top economies, including India, Japan, China, Germany, and the United States.

A comprehensive evaluation demonstrates that India has enormous opportunities of organic food and beverage sector.

Insights into the Natural Food and Drink Market of India

Country India
CAGR (2024 to 2034) 10.30%

The escalating middle class in India thrusts the organic food market, placing a higher value on sustainability and health. The domestic market is booming, thanks to government programs that aid organic production.

Increasing awareness in India about the use of chemical pesticides is boosting the organic food and drink market. A strong cultural heritage and tradition of organic farming is also enhancing the organic food movement in India.

Emerging Trends in Organic Grocery Market in Japan

Nation Japan
CAGR (2024 to 2034) 9.60%

The aging population of Japan is focusing on improving their eating habits. This shift in their approach toward food is positively impacting the organic beverage market. The Japanese certified organic market is evolving because of the strong demand from customers for healthy and good-quality food products.

The food safety standards are quite tight. This is favorably influencing customer confidence in organic products. The sales of organic food and beverages in Japan are surging because of creative marketing techniques focused on purity and authenticity.

Market Dynamics of Natural Food and Drinks in China

Nation China
CAGR (2024 to 2034) 8.70%

Online platforms are a significant factor in the market growth in China. The organic grocery market expansion in China is elevated by government support for environment-friendly and organic agriculture initiatives.

China's customer demand for organic food and beverage is bolstered by developing environmental awareness and health concerns. Organic alternatives are becoming trendy among Chinese customers due to issues about food safety concerns.

Analysis of the Organic Product Industry in Germany

Nation Germany
CAGR (2024 to 2034) 8.30%

The stimulating demand for organic food and beverage in Germany is supported by consumer alternatives for food that is cultivated ethically and locally. The organic farming market in Germany is characterized by high quality and reliability due to rigid organic certification rules and laws. Intensified investment in organic agriculture and research is a result of Germany's augmenting demand for organic food and beverage.

Trends in the Market in the United States

Nation United States
CAGR (2024 to 2034) 7.50%

The United States organic farming market is fostered by consumer demand for natural, chemical-free products. In the United States, consumers are selecting more organic food due to amplifying concerns about environmental sustainability. The industry in the United States is developing due to enhanced productivity brought about by technological breakthroughs in organic agriculture methods.

Competitive Analysis

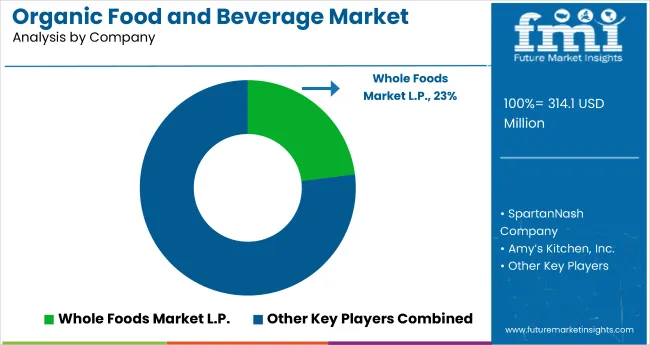
The market possesses a dynamic competitive environment with many essential organic food and beverage vendors combating market share. Whole Foods Market L.P., Organic Valley, and Amy’s Kitchen, Inc., are recognized for their commitment to sustainability and quality ushering the organic food market forward.

Prominent organic food and beverage manufacturers such as Nestlé, Conagra Brands, Inc., and General Mills Inc. use their wide resources to amplify their organic products. The dairy-focused organic beverage providers like the Dairy Farmers of America, Inc. and Gujarat Cooperative Milk Marketing Federation (Amul) are essential in the market.

Major organic food and beverage retailers like Kroger Co. and Starbucks Corporation capitalize on consumer demand for organic alternatives. Organic food and beverage vendors like SunOpta and Nature’s Path Food pitch in with their specialized focus on organic products and snacks.

The respected manufacturers control the market, and emerging producers such as EVOL Foods and SpartanNash Company are performing innovations, and launching creative products and distribution plans.

Reputable Progressions

Company Details
Dole Food Company, Inc. Dole Food Company, Inc. launched its 'GO Organic!' brands at Fruit Attraction 2023 in Madrid in October 2023 and announced the formation of Dole Organics.
So Delicious Dairy Free Organic Oatmilk was the first product So Delicious Dairy Free had when it entered the oat milk market in April 2023, as part of Danone North America's business. Made with a mixture of organic oats and myriad ingredients, the product comes in two flavors: Original and Extra Creamy.
Moju Tropical Prebiotic is the latest drink from plant-powered functional drink company Moju, which was introduced in May 2022. This supports the company's efforts to diversify.
The Wine Group America's second-leading winery by volume, The Wine Group, announced in March 2022 the launch of a new wine brand called Lemonade Stand at Main & Vine. The wines in this range are merged with "natural flavors of freshly squeezed lemonade and ripe sun-kissed fruit."
Mortal With the establishment of Mortal POWER in March 2022, Colorado-based beverage producer Mortal, which first gained prominence for its probiotic-rich kombucha is entering into the canned effervescent prebiotics water firm.

Get the data you need at a Fraction of the cost

Personalize your report by choosing insights you need
and save 40%!

Vital Organic Food and Beverage Manufacturers

  • Whole Foods Market L.P.
  • THE HERSHEY COMPANY
  • Amy’s Kitchen, Inc.
  • Organic Valley
  • Conagra Brands, Inc.
  • Nestlé
  • Eden Foods
  • SunOpta
  • Dole Food Company, Inc
  • Dairy Farmers of America, Inc.
  • General Mills Inc.
  • Danone
  • United Natural Foods, Inc.
  • Gujarat Cooperative Milk Marketing Federation (Amul)
  • EVOL Foods
  • Eden Foods
  • Starbucks Corporation
  • Nature’s Path Food
  • WhiteWave Foods Co.
  • Hain Celestial Group, Inc.
  • Dean Foods Company
  • SpartanNash Company
  • Amy's Kitchen, Inc.
  • The Kroger Co.

Key Coverage in Organic Food and Beverage Market Report

  • Key Trends in the Organic Food Market in India
  • Analysis of Market Dynamics of Natural Food and Drinks in Japan
  • Categorical Study of Organic Food and Beverage Market by Product Type among Fruits and Vegetables, Meat, Fish, and Poultry, and Other Product Types
  • Segment-wise Analysis Study of Organic Food and Beverage Market by Distribution channel among Supermarket/Hypermarket, Specialty Stores, and Others
  • Comparative Overview of Certified Organic Market, Specialty Food Ingredient Market, and Frozen Food Market
  • Competitive Analysis Emphasizing on Dole Food Company, Inc., So Delicious Dairy Free, and Other Organic Food and Beverage Producers

Key Segments

By Product Type:

  • Fruits and Vegetables
  • Meat, Fish, and Poultry
  • Dairy Products
  • Frozen and Processed Foods
  • Non-dairy Beverages
  • Coffee and Tea
  • Beer and Wine
  • Other Food and Beverages

By Process:

  • Processed
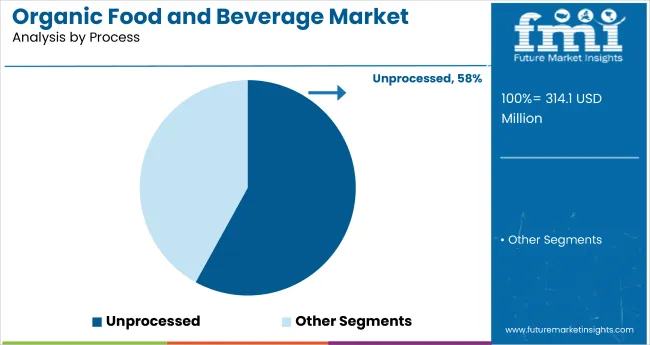
  • Unprocessed

By Distribution channel:

  • Supermarket/Hypermarket
  • Specialty Stores
  • Convenience Stores
  • Online Sales Channel
  • Others

By Region:

  • North America
  • Latin America
  • Europe
  • East Asia
  • South Asia and the Pacific
  • Middle East and Africa

Frequently Asked Questions

What is the Present Organic Food and Beverage Market Worth?

The organic food market to achieve a valuation USD 278.00 million in 2024.

How Big Can the Organic Food and Beverage Market Valuation Be by 2034?

The organic beverage market has the potential to possess a worth of USD 639.40 million by 2034.

What is the Growth Outlook of the Market?

The organic food market equates to a potent CAGR of 13.00% from 2024 to 2034.

What Was the Historical Analysis of The Organic Food and Beverage Market?

The organic beverage market evolved at a HCAGR of 11.20% between 2019 and 2023.

Which Vehicle Type Category to Predominant in the Organic Food and Beverage Market?

The fruits and vegetables sector are set to garner a share of 43.60% in 2024.

Which Distribution Channel Category to Command the Organic Food and Beverage Market?

The hypermarket/Supermarket segment to possess a global market share of 37.40% in 2024.

Table of Content
1. Executive Summary
    1.1. Global Market Outlook
    1.2. Demand-side Trends
    1.3. Supply-side Trends
    1.4. Technology Roadmap Analysis
    1.5. Analysis and Recommendations
2. Market Overview
    2.1. Market Coverage / Taxonomy
    2.2. Market Definition / Scope / Limitations
3. Market Background
    3.1. Market Dynamics
        3.1.1. Drivers
        3.1.2. Restraints
        3.1.3. Opportunity
        3.1.4. Trends
    3.2. Scenario Forecast
        3.2.1. Demand in Optimistic Scenario
        3.2.2. Demand in Likely Scenario
        3.2.3. Demand in Conservative Scenario
    3.3. Opportunity Map Analysis
    3.4. Product Life Cycle Analysis
    3.5. Supply Chain Analysis
        3.5.1. Supply Side Participants and their Roles
            3.5.1.1. Manufacturer
            3.5.1.2. Mid-Level Participants (Traders)
            3.5.1.3. Distributors
        3.5.2. Value Added and Value Created at Node in the Supply Chain
        3.5.3. List of Raw Material Suppliers
        3.5.4. List of Existing and Potential Buyer’s
    3.6. Investment Feasibility Matrix
    3.7. Value Chain Analysis
        3.7.1. Profit Margin Analysis
        3.7.2. Distributors
        3.7.3. Retailers
    3.8. PESTLE and Porter’s Analysis
    3.9. Regulatory Landscape
        3.9.1. By Key Regions
        3.9.2. By Key Countries
    3.10. Regional Parent Market Outlook
    3.11. Production and Consumption Statistics
    3.12. Import and Export Statistics
4. Global Market Analysis 2019 to 2023 and Forecast, 2024 to 2034
    4.1. Historical Market Size Value (US$ Million) & Volume (Unit Pack) Analysis, 2019 to 2023
    4.2. Current and Future Market Size Value (US$ Million) & Volume (Unit Pack) Projections, 2024 to 2034
        4.2.1. Y-o-Y Growth Trend Analysis
        4.2.2. Absolute $ Opportunity Analysis
5. Global Market Analysis 2019 to 2023 and Forecast 2024 to 2034, By Product Type
    5.1. Introduction / Key Findings
    5.2. Historical Market Size Value (US$ Million) & Volume (Unit Pack) Analysis By Product Type, 2019 to 2023
    5.3. Current and Future Market Size Value (US$ Million) & Volume (Unit Pack) Analysis and Forecast By Product Type, 2024 to 2034
        5.3.1. Fruits and Vegetables
        5.3.2. Meat, Fish, and Poultry
        5.3.3. Dairy Products
        5.3.4. Frozen and Processed Foods
        5.3.5. Non-Dairy Beverages
        5.3.6. Coffee and Tea
        5.3.7. Beer and Wine
        5.3.8. Other Organic Food and Beverages
    5.4. Y-o-Y Growth Trend Analysis By Product Type, 2019 to 2023
    5.5. Absolute $ Opportunity Analysis By Product Type, 2024 to 2034
6. Global Market Analysis 2019 to 2023 and Forecast 2024 to 2034, By Process
    6.1. Introduction / Key Findings
    6.2. Historical Market Size Value (US$ Million) & Volume (Unit Pack) Analysis By Process, 2019 to 2023
    6.3. Current and Future Market Size Value (US$ Million) & Volume (Unit Pack) Analysis and Forecast By Process, 2024 to 2034
        6.3.1. Processed
        6.3.2. Unprocessed
    6.4. Y-o-Y Growth Trend Analysis By Process, 2019 to 2023
    6.5. Absolute $ Opportunity Analysis By Process, 2024 to 2034
7. Global Market Analysis 2019 to 2023 and Forecast 2024 to 2034, By Distribution channel
    7.1. Introduction / Key Findings
    7.2. Historical Market Size Value (US$ Million) & Volume (Unit Pack) Analysis By Distribution channel, 2019 to 2023
    7.3. Current and Future Market Size Value (US$ Million) & Volume (Unit Pack) Analysis and Forecast By Distribution channel, 2024 to 2034
        7.3.1. Supermarket/Hypermarket
        7.3.2. Specialty Stores
        7.3.3. Convenience Stores
        7.3.4. Online Sales Channel
        7.3.5. Others
    7.4. Y-o-Y Growth Trend Analysis By Distribution channel, 2019 to 2023
    7.5. Absolute $ Opportunity Analysis By Distribution channel, 2024 to 2034
8. Global Market Analysis 2019 to 2023 and Forecast 2024 to 2034, By Region
    8.1. Introduction
    8.2. Historical Market Size Value (US$ Million) & Volume (Unit Pack) Analysis By Region, 2019 to 2023
    8.3. Current Market Size Value (US$ Million) & Volume (Unit Pack) Analysis and Forecast By Region, 2024 to 2034
        8.3.1. North America
        8.3.2. Latin America
        8.3.3. Western Europe
        8.3.4. Eastern Europe
        8.3.5. South Asia and Pacific
        8.3.6. East Asia
        8.3.7. Middle East and Africa
    8.4. Market Attractiveness Analysis By Region
9. North America Market Analysis 2019 to 2023 and Forecast 2024 to 2034, By Country
    9.1. Historical Market Size Value (US$ Million) & Volume (Unit Pack) Trend Analysis By Market Taxonomy, 2019 to 2023
    9.2. Market Size Value (US$ Million) & Volume (Unit Pack) Forecast By Market Taxonomy, 2024 to 2034
        9.2.1. By Country
            9.2.1.1. USA
            9.2.1.2. Canada
        9.2.2. By Product Type
        9.2.3. By Process
        9.2.4. By Distribution channel
    9.3. Market Attractiveness Analysis
        9.3.1. By Country
        9.3.2. By Product Type
        9.3.3. By Process
        9.3.4. By Distribution channel
    9.4. Key Takeaways
10. Latin America Market Analysis 2019 to 2023 and Forecast 2024 to 2034, By Country
    10.1. Historical Market Size Value (US$ Million) & Volume (Unit Pack) Trend Analysis By Market Taxonomy, 2019 to 2023
    10.2. Market Size Value (US$ Million) & Volume (Unit Pack) Forecast By Market Taxonomy, 2024 to 2034
        10.2.1. By Country
            10.2.1.1. Brazil
            10.2.1.2. Mexico
            10.2.1.3. Rest of Latin America
        10.2.2. By Product Type
        10.2.3. By Process
        10.2.4. By Distribution channel
    10.3. Market Attractiveness Analysis
        10.3.1. By Country
        10.3.2. By Product Type
        10.3.3. By Process
        10.3.4. By Distribution channel
    10.4. Key Takeaways
11. Western Europe Market Analysis 2019 to 2023 and Forecast 2024 to 2034, By Country
    11.1. Historical Market Size Value (US$ Million) & Volume (Unit Pack) Trend Analysis By Market Taxonomy, 2019 to 2023
    11.2. Market Size Value (US$ Million) & Volume (Unit Pack) Forecast By Market Taxonomy, 2024 to 2034
        11.2.1. By Country
            11.2.1.1. Germany
            11.2.1.2. UK
            11.2.1.3. France
            11.2.1.4. Spain
            11.2.1.5. Italy
            11.2.1.6. Rest of Western Europe
        11.2.2. By Product Type
        11.2.3. By Process
        11.2.4. By Distribution channel
    11.3. Market Attractiveness Analysis
        11.3.1. By Country
        11.3.2. By Product Type
        11.3.3. By Process
        11.3.4. By Distribution channel
    11.4. Key Takeaways
12. Eastern Europe Market Analysis 2019 to 2023 and Forecast 2024 to 2034, By Country
    12.1. Historical Market Size Value (US$ Million) & Volume (Unit Pack) Trend Analysis By Market Taxonomy, 2019 to 2023
    12.2. Market Size Value (US$ Million) & Volume (Unit Pack) Forecast By Market Taxonomy, 2024 to 2034
        12.2.1. By Country
            12.2.1.1. Poland
            12.2.1.2. Russia
            12.2.1.3. Czech Republic
            12.2.1.4. Romania
            12.2.1.5. Rest of Eastern Europe
        12.2.2. By Product Type
        12.2.3. By Process
        12.2.4. By Distribution channel
    12.3. Market Attractiveness Analysis
        12.3.1. By Country
        12.3.2. By Product Type
        12.3.3. By Process
        12.3.4. By Distribution channel
    12.4. Key Takeaways
13. South Asia and Pacific Market Analysis 2019 to 2023 and Forecast 2024 to 2034, By Country
    13.1. Historical Market Size Value (US$ Million) & Volume (Unit Pack) Trend Analysis By Market Taxonomy, 2019 to 2023
    13.2. Market Size Value (US$ Million) & Volume (Unit Pack) Forecast By Market Taxonomy, 2024 to 2034
        13.2.1. By Country
            13.2.1.1. India
            13.2.1.2. Bangladesh
            13.2.1.3. Australia
            13.2.1.4. New Zealand
            13.2.1.5. Rest of South Asia and Pacific
        13.2.2. By Product Type
        13.2.3. By Process
        13.2.4. By Distribution channel
    13.3. Market Attractiveness Analysis
        13.3.1. By Country
        13.3.2. By Product Type
        13.3.3. By Process
        13.3.4. By Distribution channel
    13.4. Key Takeaways
14. East Asia Market Analysis 2019 to 2023 and Forecast 2024 to 2034, By Country
    14.1. Historical Market Size Value (US$ Million) & Volume (Unit Pack) Trend Analysis By Market Taxonomy, 2019 to 2023
    14.2. Market Size Value (US$ Million) & Volume (Unit Pack) Forecast By Market Taxonomy, 2024 to 2034
        14.2.1. By Country
            14.2.1.1. China
            14.2.1.2. Japan
            14.2.1.3. South Korea
        14.2.2. By Product Type
        14.2.3. By Process
        14.2.4. By Distribution channel
    14.3. Market Attractiveness Analysis
        14.3.1. By Country
        14.3.2. By Product Type
        14.3.3. By Process
        14.3.4. By Distribution channel
    14.4. Key Takeaways
15. Middle East and Africa Market Analysis 2019 to 2023 and Forecast 2024 to 2034, By Country
    15.1. Historical Market Size Value (US$ Million) & Volume (Unit Pack) Trend Analysis By Market Taxonomy, 2019 to 2023
    15.2. Market Size Value (US$ Million) & Volume (Unit Pack) Forecast By Market Taxonomy, 2024 to 2034
        15.2.1. By Country
            15.2.1.1. GCC Countries
            15.2.1.2. South Africa
            15.2.1.3. Israel
            15.2.1.4. Rest of MEA
        15.2.2. By Product Type
        15.2.3. By Process
        15.2.4. By Distribution channel
    15.3. Market Attractiveness Analysis
        15.3.1. By Country
        15.3.2. By Product Type
        15.3.3. By Process
        15.3.4. By Distribution channel
    15.4. Key Takeaways
16. Key Countries Market Analysis
    16.1. USA
        16.1.1. Pricing Analysis
        16.1.2. Market Share Analysis, 2023
            16.1.2.1. By Product Type
            16.1.2.2. By Process
            16.1.2.3. By Distribution channel
    16.2. Canada
        16.2.1. Pricing Analysis
        16.2.2. Market Share Analysis, 2023
            16.2.2.1. By Product Type
            16.2.2.2. By Process
            16.2.2.3. By Distribution channel
    16.3. Brazil
        16.3.1. Pricing Analysis
        16.3.2. Market Share Analysis, 2023
            16.3.2.1. By Product Type
            16.3.2.2. By Process
            16.3.2.3. By Distribution channel
    16.4. Mexico
        16.4.1. Pricing Analysis
        16.4.2. Market Share Analysis, 2023
            16.4.2.1. By Product Type
            16.4.2.2. By Process
            16.4.2.3. By Distribution channel
    16.5. Germany
        16.5.1. Pricing Analysis
        16.5.2. Market Share Analysis, 2023
            16.5.2.1. By Product Type
            16.5.2.2. By Process
            16.5.2.3. By Distribution channel
    16.6. UK
        16.6.1. Pricing Analysis
        16.6.2. Market Share Analysis, 2023
            16.6.2.1. By Product Type
            16.6.2.2. By Process
            16.6.2.3. By Distribution channel
    16.7. France
        16.7.1. Pricing Analysis
        16.7.2. Market Share Analysis, 2023
            16.7.2.1. By Product Type
            16.7.2.2. By Process
            16.7.2.3. By Distribution channel
    16.8. Spain
        16.8.1. Pricing Analysis
        16.8.2. Market Share Analysis, 2023
            16.8.2.1. By Product Type
            16.8.2.2. By Process
            16.8.2.3. By Distribution channel
    16.9. Italy
        16.9.1. Pricing Analysis
        16.9.2. Market Share Analysis, 2023
            16.9.2.1. By Product Type
            16.9.2.2. By Process
            16.9.2.3. By Distribution channel
    16.10. Poland
        16.10.1. Pricing Analysis
        16.10.2. Market Share Analysis, 2023
            16.10.2.1. By Product Type
            16.10.2.2. By Process
            16.10.2.3. By Distribution channel
    16.11. Russia
        16.11.1. Pricing Analysis
        16.11.2. Market Share Analysis, 2023
            16.11.2.1. By Product Type
            16.11.2.2. By Process
            16.11.2.3. By Distribution channel
    16.12. Czech Republic
        16.12.1. Pricing Analysis
        16.12.2. Market Share Analysis, 2023
            16.12.2.1. By Product Type
            16.12.2.2. By Process
            16.12.2.3. By Distribution channel
    16.13. Romania
        16.13.1. Pricing Analysis
        16.13.2. Market Share Analysis, 2023
            16.13.2.1. By Product Type
            16.13.2.2. By Process
            16.13.2.3. By Distribution channel
    16.14. India
        16.14.1. Pricing Analysis
        16.14.2. Market Share Analysis, 2023
            16.14.2.1. By Product Type
            16.14.2.2. By Process
            16.14.2.3. By Distribution channel
    16.15. Bangladesh
        16.15.1. Pricing Analysis
        16.15.2. Market Share Analysis, 2023
            16.15.2.1. By Product Type
            16.15.2.2. By Process
            16.15.2.3. By Distribution channel
    16.16. Australia
        16.16.1. Pricing Analysis
        16.16.2. Market Share Analysis, 2023
            16.16.2.1. By Product Type
            16.16.2.2. By Process
            16.16.2.3. By Distribution channel
    16.17. New Zealand
        16.17.1. Pricing Analysis
        16.17.2. Market Share Analysis, 2023
            16.17.2.1. By Product Type
            16.17.2.2. By Process
            16.17.2.3. By Distribution channel
    16.18. China
        16.18.1. Pricing Analysis
        16.18.2. Market Share Analysis, 2023
            16.18.2.1. By Product Type
            16.18.2.2. By Process
            16.18.2.3. By Distribution channel
    16.19. Japan
        16.19.1. Pricing Analysis
        16.19.2. Market Share Analysis, 2023
            16.19.2.1. By Product Type
            16.19.2.2. By Process
            16.19.2.3. By Distribution channel
    16.20. South Korea
        16.20.1. Pricing Analysis
        16.20.2. Market Share Analysis, 2023
            16.20.2.1. By Product Type
            16.20.2.2. By Process
            16.20.2.3. By Distribution channel
    16.21. GCC Countries
        16.21.1. Pricing Analysis
        16.21.2. Market Share Analysis, 2023
            16.21.2.1. By Product Type
            16.21.2.2. By Process
            16.21.2.3. By Distribution channel
    16.22. South Africa
        16.22.1. Pricing Analysis
        16.22.2. Market Share Analysis, 2023
            16.22.2.1. By Product Type
            16.22.2.2. By Process
            16.22.2.3. By Distribution channel
    16.23. Israel
        16.23.1. Pricing Analysis
        16.23.2. Market Share Analysis, 2023
            16.23.2.1. By Product Type
            16.23.2.2. By Process
            16.23.2.3. By Distribution channel
17. Market Structure Analysis
    17.1. Competition Dashboard
    17.2. Competition Benchmarking
    17.3. Market Share Analysis of Top Players
        17.3.1. By Regional
        17.3.2. By Product Type
        17.3.3. By Process
        17.3.4. By Distribution channel
18. Competition Analysis
    18.1. Competition Deep Dive
        18.1.1. Whole Foods Market L.P.
            18.1.1.1. Overview
            18.1.1.2. Product Portfolio
            18.1.1.3. Profitability by Market Segments
            18.1.1.4. Sales Footprint
            18.1.1.5. Strategy Overview
                18.1.1.5.1. Marketing Strategy
                18.1.1.5.2. Product Strategy
                18.1.1.5.3. Channel Strategy
        18.1.2. SpartanNash Company
            18.1.2.1. Overview
            18.1.2.2. Product Portfolio
            18.1.2.3. Profitability by Market Segments
            18.1.2.4. Sales Footprint
            18.1.2.5. Strategy Overview
                18.1.2.5.1. Marketing Strategy
                18.1.2.5.2. Product Strategy
                18.1.2.5.3. Channel Strategy
        18.1.3. Amy’s Kitchen, Inc.
            18.1.3.1. Overview
            18.1.3.2. Product Portfolio
            18.1.3.3. Profitability by Market Segments
            18.1.3.4. Sales Footprint
            18.1.3.5. Strategy Overview
                18.1.3.5.1. Marketing Strategy
                18.1.3.5.2. Product Strategy
                18.1.3.5.3. Channel Strategy
        18.1.4. Organic Valley
            18.1.4.1. Overview
            18.1.4.2. Product Portfolio
            18.1.4.3. Profitability by Market Segments
            18.1.4.4. Sales Footprint
            18.1.4.5. Strategy Overview
                18.1.4.5.1. Marketing Strategy
                18.1.4.5.2. Product Strategy
                18.1.4.5.3. Channel Strategy
        18.1.5. Conagra Brands, Inc.
            18.1.5.1. Overview
            18.1.5.2. Product Portfolio
            18.1.5.3. Profitability by Market Segments
            18.1.5.4. Sales Footprint
            18.1.5.5. Strategy Overview
                18.1.5.5.1. Marketing Strategy
                18.1.5.5.2. Product Strategy
                18.1.5.5.3. Channel Strategy
        18.1.6. Nestlé
            18.1.6.1. Overview
            18.1.6.2. Product Portfolio
            18.1.6.3. Profitability by Market Segments
            18.1.6.4. Sales Footprint
            18.1.6.5. Strategy Overview
                18.1.6.5.1. Marketing Strategy
                18.1.6.5.2. Product Strategy
                18.1.6.5.3. Channel Strategy
        18.1.7. Eden Foods
            18.1.7.1. Overview
            18.1.7.2. Product Portfolio
            18.1.7.3. Profitability by Market Segments
            18.1.7.4. Sales Footprint
            18.1.7.5. Strategy Overview
                18.1.7.5.1. Marketing Strategy
                18.1.7.5.2. Product Strategy
                18.1.7.5.3. Channel Strategy
        18.1.8. SunOpta
            18.1.8.1. Overview
            18.1.8.2. Product Portfolio
            18.1.8.3. Profitability by Market Segments
            18.1.8.4. Sales Footprint
            18.1.8.5. Strategy Overview
                18.1.8.5.1. Marketing Strategy
                18.1.8.5.2. Product Strategy
                18.1.8.5.3. Channel Strategy
        18.1.9. Dole Food Company, Inc
            18.1.9.1. Overview
            18.1.9.2. Product Portfolio
            18.1.9.3. Profitability by Market Segments
            18.1.9.4. Sales Footprint
            18.1.9.5. Strategy Overview
                18.1.9.5.1. Marketing Strategy
                18.1.9.5.2. Product Strategy
                18.1.9.5.3. Channel Strategy
        18.1.10. Dairy Farmers of America, Inc.
            18.1.10.1. Overview
            18.1.10.2. Product Portfolio
            18.1.10.3. Profitability by Market Segments
            18.1.10.4. Sales Footprint
            18.1.10.5. Strategy Overview
                18.1.10.5.1. Marketing Strategy
                18.1.10.5.2. Product Strategy
                18.1.10.5.3. Channel Strategy
        18.1.11. General Mills Inc.
            18.1.11.1. Overview
            18.1.11.2. Product Portfolio
            18.1.11.3. Profitability by Market Segments
            18.1.11.4. Sales Footprint
            18.1.11.5. Strategy Overview
                18.1.11.5.1. Marketing Strategy
                18.1.11.5.2. Product Strategy
                18.1.11.5.3. Channel Strategy
19. Assumptions & Acronyms Used
20. Research Methodology
Recommendations

Food and Beverage

Organic Foods Market

February 2023

REP-GB-16722

324 pages

Food and Beverage

Organic Snack Food Market

November 2024

REP-GB-4493

Upcoming

Explore Food and Beverage Insights

View Reports
Future Market Insights

Organic Food and Beverage Market

Schedule a Call