Organic Rice Protein Market
Organic Rice Protein uptake receiving traction amid Burgeoning demand for its Beneficial Characteristics
Organic Rice Protein Market by Extraction Process, Type, Application, End-user & Region | Forecast 2022 to 2032
Organic Rice Protein Market Snapshot (2022 to 2032)
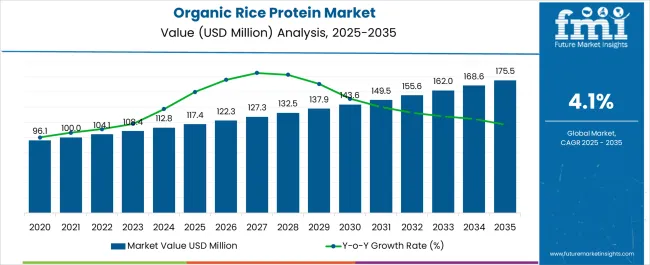
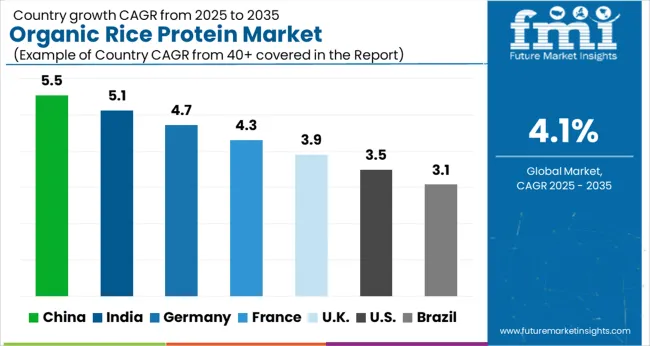
According to the research of Future Market Insights, the market for Organic Rice Protein is anticipated to expand at a CAGR of 4.1% over the forecasted time period. According to projections, the industry would be worth US$ 155.6 Million by 2032, up from US$ 104.1 Million in 2022. At the end of 2021, the Organic Rice Protein Market was valued at US$ 98.7 Million.
Market Size Value in 2022 |
US$ 104.1 Million |
Market Forecast Value in 2032 |
US$ 155.6 Million |
Global Growth Rate (2022 to 2032) |
4.1% |
Forecast Period |
2022 to 2032 |
Global Market Share of US, Germany, Japan, and Australia |
71.2% |
Organic rice protein is a healthy and nutritious alternative to other protein sources. It is low in fat and calories and is a good source of fiber. Organic Rice Protein is also rich in vitamins and minerals, including iron, potassium, and magnesium. Organic rice protein is a complete protein, which means it contains all of the essential amino acids your body needs.
The growing popularity of plant-based proteins, as well as the health benefits associated with organic rice protein, are the major drivers of the organic rice protein market. Additionally, the rising demand for natural and healthy food ingredients is also fuelling market growth.
Let us know your requirement to get
100% FREE customization
Historical Outlook versus Future Projections for Organic Rice Protein Market
Organic Rice Protein is one of the oldest and most popular plant-based proteins. It has a long history of use in Asia and is now gaining popularity in the Western world. Despite its ancient origins, the organic rice protein market is still in its infancy. The market was worth just over US$ 98.7 Million in 2021 and is expected to grow to US$ 155.6 Million by 2032, according to a report by Future Market Insights.
This growth is expected to continue in the future, as more and more people become aware of the benefits of Organic Rice Protein. The main drivers of this growth are expected to be the health-conscious consumer and the growing demand for plant-based proteins.
USA Organic Rice Protein Market Leading the Global Market by High Demand for Organic Food Ingredients
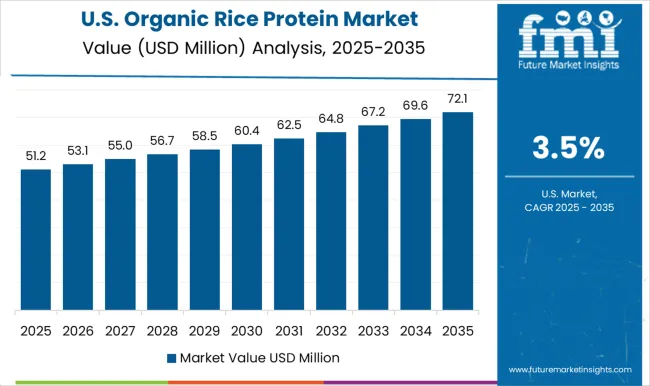
North America accounted for more than 50% of the global market in 2021, driven by growing demand for sports drinks in Canada and the USA. During the forecast period, the market expansion is likely to be fueled by the presence of key manufacturers and organic rice protein suppliers in the USA. Moreover, the high demand for natural food ingredients is expected to further drive the USA organic rice protein market size. However, the USA accounted for 32.7% market share with a market value of US$ 34.1 Million during the forecast period.
Find your sweet spots for generating winning opportunities in this market.
Talk to AnalystUnited Kingdom Organic Rice Protein Market Growing by Rising Healthy Alternatives
The United Kingdom market for organic rice protein powder is a leading contributor in the Europe region during the forecast period. People in the United Kingdom prefer organic rice protein because it is a good choice for those who are looking for an alternative to animal-based proteins. It is also a good option for people who are allergic to soy or nuts. Rice protein is easy to digest and has a neutral flavor, making it versatile in recipes. During the forecast period, the United Kingdom organic rice protein market is expected to grow at a CAGR of 5.8%.
Asia Pacific Organic Rice Protein Market Rising due to Increasing Demand for Plant-based Proteins
According to the FMI report, the Asia Pacific region is the fastest-growing region in the organic rice protein market during the forecast period. The countries such as Korea and Japan are flourishing in the market size in the region.
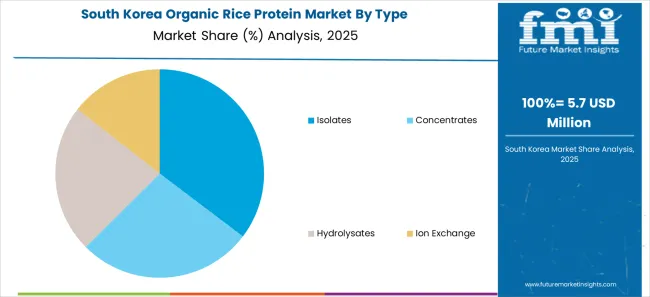
The Korean organic rice protein market is surging rapidly by increasing demand from consumers for healthy and sustainable food products during the forecast period. The Korean government supports organic agriculture and promotes rural development, which has contributed to the growth of the Korean organic rice protein market in recent years. In addition, the rising demand for plant-based proteins by end-users drives the Korean organic rice protein market share. Moreover, the vast Korean territory and favorable climate conditions are suitable for cultivating organic rice to increase the market size.
Japan's organic rice protein market is also contributing a significant share of the global market during the foreseen time. Due to the growing health consciousness of consumers and the trend towards healthy diets, the Japanese market for organic rice protein is upsurging during the forecast period. Due to rising awareness related to low-fat and calorie food among consumers, the Japanese organic rice protein market share is growing higher in recent years due to significant investment by numerous market players and the low cost of the product upsurging the Japanese market during the forecast period. The organic rice protein manufacturer develops food proteins without changing the product's texture, flavor, quality, or appearance.
A unified Market Research Subscription Platform, built for today's disparate research needs.
Country-wise Insights
Will USA and Canada continue to grow as the fastest market?
North America accounted for more than 50% of the global market in 2021, driven by growing demand for sports drinks in Canada and the USA. During the forecast period, the market expansion is likely to be fuelled by the presence of several of these key manufacturers. High demand for natural food ingredients is expected to further drive the expansion of the Organic Rice Protein market.
The USA accounted for 32.7% market share with a market value of US$ 34.1 Million in 2022.
Why is the Organic Rice Protein market growing in the United Kingdom?
The Organic Rice Protein market is growing in the United Kingdom for a number of reasons. People in the United Kingdom prefer Organic Rice Protein because it is a good choice for those who are looking for an alternative to animal-based proteins. It is also a good option for people who are allergic to soy or nuts. Rice protein is easy to digest and has a neutral flavor, making it versatile in recipes.
During the forecasted period, Organic Rice Protein Market in the United Kingdom is expected to grow at a CAGR of 5.8%.
What are the factors that drive the Organic Rice Protein Market in China?
According to FMI’s analysis, China is anticipated to grow at a CAGR of 5.1% between 2022 and 2032. The Organic Rice Protein Market in China is expected to grow at a rapid pace in the coming years, due to the increasing demand from consumers for healthy and sustainable food products. The Chinese government's policies to support organic agriculture and promote rural development will also contribute to the growth of the market. Moreover, China's vast territory and favorable climate conditions are suitable for cultivating organic rice, which will further drive market growth.
How is India performing in the Organic Rice Protein market?
In recent years, the Organic Rice Protein market has seen significant growth. This is due in part to the growing health consciousness of consumers and the trend toward plant-based diets. India is one of the leading producers of Organic Rice Protein, and its performance in this market is impressive.
India is expected to grow at a CAGR of 5.6% during the forecasted period.
Category-wise Insights
How does the Chemical Extraction Process work?
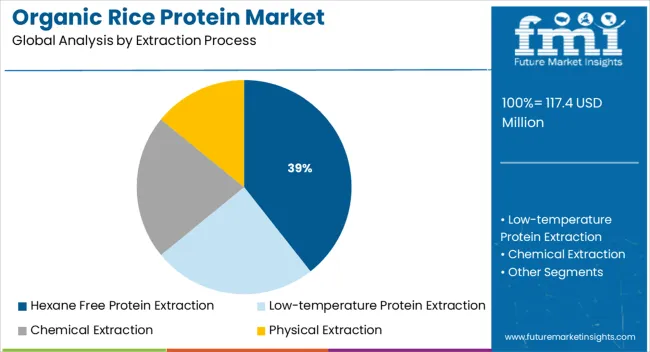
The main drawback of Organic Rice Protein is that it’s not as easily absorbed by the body as other proteins. But this can be remedied through a process called chemical extraction. Chemical extraction involves using chemicals to remove the non-protein parts of the rice grain, leaving behind a more concentrated form of protein. This process makes Organic Rice Protein more bioavailable, meaning your body can better absorb and use it.
Why is the Organic Rice Protein Concentrates Market expanding?
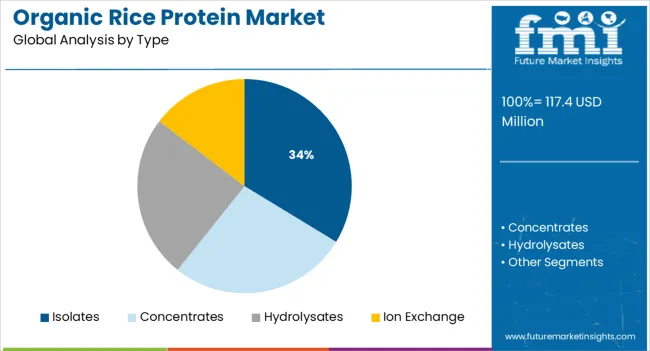
Due to significant investment by numerous market players and the low cost of the product, concentrates are gradually growing. Concentrates can replace goods like food proteins without changing the product's texture, flavor, or appearance.
Will Sports and Energy nutrition remain top-selling End-user?
The consumption of Organic Rice Protein in Sports and Energy nutrition is attributable to their high amino acid profile and presence of branched-chain amino acids (BCAAs), which are crucial for muscle repair in athletes and bodybuilders. Weight management is the primary reason for the use of Organic Rice Protein in Sports and Energy nutrition.
Similar to whey protein, rice proteins promote increased lean body mass, skeletal muscle hypertrophy, power, and strength.
Healthy Lifestyle is propelling the growth in Organic Rice Protein Market
Organic Rice Protein is becoming an increasingly popular choice for those looking for a healthy, sustainable option. There are a number of factors that are propelling the growth of Organic Rice Protein, including the health benefit it offers and the increasing awareness of the importance of sustainability.
Organic Rice Protein is a healthy alternative to other protein sources, such as animal-based proteins. It is low in fat and cholesterol and contains no artificial ingredients or preservatives. Additionally, Organic Rice Protein is a sustainable choice, as it requires less water and energy to produce than other protein sources.
Competitive Landscape
Key players’ strategies include alliances and agreements. By forming alliances and expanding their distribution networks, businesses are trying to reach a wider worldwide audience. Major manufacturers are investing heavily in Research and Development to develop high-quality products, which is expected to boost competition among them.
The FMI team has also kept track of recent developments in businesses that produce Organic Rice Protein, and these developments are included in the full market research report.
Organic Rice Protein Market Report Scope
Attribute |
Details |
Forecast Period |
2022 to 2032 |
Historical Data Available for |
2017 to 2022 |
Market Analysis |
USD Million for Value and Units for Volume |
Key Regions Covered |
|
Key Countries Covered |
|
Key Segments Covered |
|
Key Companies Profiled |
|
Report Coverage |
Market Forecast, Company Share Analysis, Competitive Landscape, Drivers, Restraints, Opportunities and Threats Analysis, Market Dynamics and Challenges, and Strategic Growth Initiatives |
Customization & Pricing |
Available upon Request |
Organic Rice Protein Market by Category
By Extraction Process, Organic Rice Protein Market is segmented as:
- Hexane Free Protein Extraction
- Low-temperature Protein Extraction
- Chemical Extraction
- Physical Extraction
By Type, Organic Rice Protein Market is segmented as:
- Isolates
- Concentrates
- Hydrolysates
- Ion Exchange
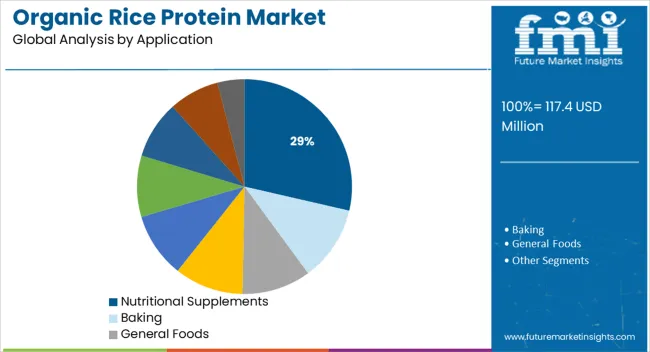
By Application, Organic Rice Protein Market is segmented as:
- Nutritional Supplements
- Baking
- General Foods
- Functional Applications
- General Applications
- Flavour Enhancements and Savoury Flavours
- Dispersibility
- Emulsification
- Others
By End-user, Organic Rice Protein Market is segmented as:
- Dairy
- Bakery and Confectionery
- Sports and Energy Nutrition
- Beverages
- Meat extenders
- Others
By Region, Organic Rice Protein Market is segmented as:
- North America
- Latin America
- Europe
- Asia-Pacific
- Middle East and Africa(MEA)
Frequently Asked Questions
How big is the Organic Rice Protein Market?
The Organic Rice Protein Market will reach nearly US$ 104.1 Million by 2022.
At what rate Organic Rice Protein Market is expected to grow?
The Organic Rice Protein Market is expected to rise at a CAGR of 4.1%
Which are the major countries driving the demand for Organic Rice Protein Market?
The USA, Germany, Japan, Australia, China, India, and the United Kingdom are the major countries driving the demand for Organic Rice Protein Market.
At what rate will Organic Rice Protein Market grow in China?
The China Organic Rice Protein Market will grow at 5.1% CAGR between 2022 and 2032.
At what rate will Organic Rice Protein Market grow in India?
The India Organic Rice Protein Market will grow at 5.6% CAGR between 2022 and 2032.
At what rate will Organic Rice Protein Market grow in United Kingdom?
The United Kingdom Organic Rice Protein Market will grow at 5.8% CAGR between 2022 and 2032.
Which companies dominate the market?
AIDP Inc, Axiom Foods, and RiceBran Technologies are the companies dominating the Organic Rice Protein Market.
What is the demand outlook forecast for the Organic Rice Protein Market?
The global demand for Organic Rice Protein Market is forecasted to surpass US$ 155.6 Million by the year 2032.
Table of Content
1. Executive Summary | Organic Rice Protein Market 1.1. Global Market Outlook 1.2. Demand-side Trends 1.3. Supply-side Trends 1.4. Technology Roadmap Analysis 1.5. Analysis and Recommendations 2. Market Overview 2.1. Market Coverage / Taxonomy 2.2. Market Definition / Scope / Limitations 3. Market Background 3.1. Market Dynamics 3.1.1. Drivers 3.1.2. Restraints 3.1.3. Opportunity 3.1.4. Trends 3.2. Scenario Forecast 3.2.1. Demand in Optimistic Scenario 3.2.2. Demand in Likely Scenario 3.2.3. Demand in Conservative Scenario 3.3. Opportunity Map Analysis 3.4. Product Life Cycle Analysis 3.5. Supply Chain Analysis 3.5.1. Supply Side Participants and their Roles 3.5.1.1. Producers 3.5.1.2. Mid-Level Participants (Traders/ Agents/ Brokers) 3.5.1.3. Wholesalers and Distributors 3.5.2. Value Added and Value Created at Node in the Supply Chain 3.5.3. List of Raw Material Suppliers 3.5.4. List of Existing and Potential Buyers 3.6. Investment Feasibility Matrix 3.7. Value Chain Analysis 3.7.1. Profit Margin Analysis 3.7.2. Wholesalers and Distributors 3.7.3. Retailers 3.8. PESTLE and Porter’s Analysis 3.9. Regulatory Landscape 3.9.1. By Key Regions 3.9.2. By Key Countries 3.10. Regional Parent Market Outlook 3.11. Production and Consumption Statistics 3.12. Import and Export Statistics 4. Global Market Analysis 2016 to 2021 and Forecast, 2022 to 2032 4.1. Historical Market Size Value (US$ Million) & Volume (Tons) Analysis, 2016 to 2021 4.2. Current and Future Market Size Value (US$ Million) & Volume (Tons) Projections, 2022 to 2032 4.2.1. Y-o-Y Growth Trend Analysis 4.2.2. Absolute $ Opportunity Analysis 5. Global Market Analysis 2016 to 2021 and Forecast 2022 to 2032, By Extraction Process 5.1. Introduction / Key Findings 5.2. Historical Market Size Value (US$ Million) & Volume (Tons) Analysis By Extraction Process, 2016 to 2021 5.3. Current and Future Market Size Value (US$ Million) & Volume (Tons) Analysis and Forecast By Extraction Process, 2022 to 2032 5.3.1. Hexane-Free Protein Extraction 5.3.2. Low-temperature Protein Extraction 5.4. Y-o-Y Growth Trend Analysis By Extraction Process, 2016 to 2021 5.5. Absolute $ Opportunity Analysis By Extraction Process, 2022 to 2032 6. Global Market Analysis 2016 to 2021 and Forecast 2022 to 2032, By Type 6.1. Introduction / Key Findings 6.2. Historical Market Size Value (US$ Million) & Volume (Tons) Analysis By Type, 2016 to 2021 6.3. Current and Future Market Size Value (US$ Million) & Volume (Tons) Analysis and Forecast By Type, 2022 to 2032 6.3.1. Concentrates 6.3.2. Isolates 6.4. Y-o-Y Growth Trend Analysis By Type, 2016 to 2021 6.5. Absolute $ Opportunity Analysis By Type, 2022 to 2032 7. Global Market Analysis 2016 to 2021 and Forecast 2022 to 2032, By Application 7.1. Introduction / Key Findings 7.2. Historical Market Size Value (US$ Million) & Volume (Tons) Analysis By Application, 2016 to 2021 7.3. Current and Future Market Size Value (US$ Million) & Volume (Tons) Analysis and Forecast By Application, 2022 to 2032 7.3.1. General Applications 7.3.1.1. Nutritional Supplements 7.3.1.2. Baking 7.3.1.3. Flavor Enhancements & Savory Flavors 7.3.1.4. General Foods 7.3.1.5. Others 7.3.2. Functional Applications 7.3.2.1. Dispersibility 7.3.2.2. Emulsification 7.4. Y-o-Y Growth Trend Analysis By Application, 2016 to 2021 7.5. Absolute $ Opportunity Analysis By Application, 2022 to 2032 8. Global Market Analysis 2016 to 2021 and Forecast 2022 to 2032, By End User 8.1. Introduction / Key Findings 8.2. Historical Market Size Value (US$ Million) & Volume (Tons) Analysis By End User, 2016 to 2021 8.3. Current and Future Market Size Value (US$ Million) & Volume (Tons) Analysis and Forecast By End User, 2022 to 2032 8.3.1. Sports and Energy 8.3.2. Dairy 8.3.3. Bakery 8.3.4. Beverages 8.3.5. Other 8.4. Y-o-Y Growth Trend Analysis By End User, 2016 to 2021 8.5. Absolute $ Opportunity Analysis By End User, 2022 to 2032 9. Global Market Analysis 2016 to 2021 and Forecast 2022 to 2032, By Region 9.1. Introduction 9.2. Historical Market Size Value (US$ Million) & Volume (Tons) Analysis By Region, 2016 to 2021 9.3. Current Market Size Value (US$ Million) & Volume (Tons) Analysis and Forecast By Region, 2022 to 2032 9.3.1. North America 9.3.2. Latin America 9.3.3. Europe 9.3.4. Asia Pacific 9.3.5. Middle East and Africa(MEA) 9.4. Market Attractiveness Analysis By Region 10. North America Market Analysis 2016 to 2021 and Forecast 2022 to 2032, By Country 10.1. Historical Market Size Value (US$ Million) & Volume (Tons) Trend Analysis By Market Taxonomy, 2016 to 2021 10.2. Market Size Value (US$ Million) & Volume (Tons) Forecast By Market Taxonomy, 2022 to 2032 10.2.1. By Country 10.2.1.1. USA 10.2.1.2. Canada 10.2.2. By Extraction Process 10.2.3. By Type 10.2.4. By Application 10.2.5. By End User 10.3. Market Attractiveness Analysis 10.3.1. By Country 10.3.2. By Extraction Process 10.3.3. By Type 10.3.4. By Application 10.3.5. By End User 10.4. Key Takeaways 11. Latin America Market Analysis 2016 to 2021 and Forecast 2022 to 2032, By Country 11.1. Historical Market Size Value (US$ Million) & Volume (Tons) Trend Analysis By Market Taxonomy, 2016 to 2021 11.2. Market Size Value (US$ Million) & Volume (Tons) Forecast By Market Taxonomy, 2022 to 2032 11.2.1. By Country 11.2.1.1. Brazil 11.2.1.2. Mexico 11.2.1.3. Rest of Latin America 11.2.2. By Extraction Process 11.2.3. By Type 11.2.4. By Application 11.2.5. By End User 11.3. Market Attractiveness Analysis 11.3.1. By Country 11.3.2. By Extraction Process 11.3.3. By Type 11.3.4. By Application 11.3.5. By End User 11.4. Key Takeaways 12. Europe Market Analysis 2016 to 2021 and Forecast 2022 to 2032, By Country 12.1. Historical Market Size Value (US$ Million) & Volume (Tons) Trend Analysis By Market Taxonomy, 2016 to 2021 12.2. Market Size Value (US$ Million) & Volume (Tons) Forecast By Market Taxonomy, 2022 to 2032 12.2.1. By Country 12.2.1.1. Germany 12.2.1.2. United Kingdom 12.2.1.3. France 12.2.1.4. Spain 12.2.1.5. Italy 12.2.1.6. Rest of Europe 12.2.2. By Extraction Process 12.2.3. By Type 12.2.4. By Application 12.2.5. By End User 12.3. Market Attractiveness Analysis 12.3.1. By Country 12.3.2. By Extraction Process 12.3.3. By Type 12.3.4. By Application 12.3.5. By End User 12.4. Key Takeaways 13. Asia Pacific Market Analysis 2016 to 2021 and Forecast 2022 to 2032, By Country 13.1. Historical Market Size Value (US$ Million) & Volume (Tons) Trend Analysis By Market Taxonomy, 2016 to 2021 13.2. Market Size Value (US$ Million) & Volume (Tons) Forecast By Market Taxonomy, 2022 to 2032 13.2.1. By Country 13.2.1.1. China 13.2.1.2. Japan 13.2.1.3. South Korea 13.2.1.4. Singapore 13.2.1.5. Thailand 13.2.1.6. Indonesia 13.2.1.7. Australia 13.2.1.8. New Zealand 13.2.1.9. Rest of Asia Pacific 13.2.2. By Extraction Process 13.2.3. By Type 13.2.4. By Application 13.2.5. By End User 13.3. Market Attractiveness Analysis 13.3.1. By Country 13.3.2. By Extraction Process 13.3.3. By Type 13.3.4. By Application 13.3.5. By End User 13.4. Key Takeaways 14. MEA Market Analysis 2016 to 2021 and Forecast 2022 to 2032, By Country 14.1. Historical Market Size Value (US$ Million) & Volume (Tons) Trend Analysis By Market Taxonomy, 2016 to 2021 14.2. Market Size Value (US$ Million) & Volume (Tons) Forecast By Market Taxonomy, 2022 to 2032 14.2.1. By Country 14.2.1.1. GCC Countries 14.2.1.2. South Africa 14.2.1.3. Israel 14.2.1.4. Rest of Middle East and Africa(MEA) 14.2.2. By Extraction Process 14.2.3. By Type 14.2.4. By Application 14.2.5. By End User 14.3. Market Attractiveness Analysis 14.3.1. By Country 14.3.2. By Extraction Process 14.3.3. By Type 14.3.4. By Application 14.3.5. By End User 14.4. Key Takeaways 15. Key Countries Market Analysis 15.1. USA 15.1.1. Pricing Analysis 15.1.2. Market Share Analysis, 2021 15.1.2.1. By Extraction Process 15.1.2.2. By Type 15.1.2.3. By Application 15.1.2.4. By End User 15.2. Canada 15.2.1. Pricing Analysis 15.2.2. Market Share Analysis, 2021 15.2.2.1. By Extraction Process 15.2.2.2. By Type 15.2.2.3. By Application 15.2.2.4. By End User 15.3. Brazil 15.3.1. Pricing Analysis 15.3.2. Market Share Analysis, 2021 15.3.2.1. By Extraction Process 15.3.2.2. By Type 15.3.2.3. By Application 15.3.2.4. By End User 15.4. Mexico 15.4.1. Pricing Analysis 15.4.2. Market Share Analysis, 2021 15.4.2.1. By Extraction Process 15.4.2.2. By Type 15.4.2.3. By Application 15.4.2.4. By End User 15.5. Germany 15.5.1. Pricing Analysis 15.5.2. Market Share Analysis, 2021 15.5.2.1. By Extraction Process 15.5.2.2. By Type 15.5.2.3. By Application 15.5.2.4. By End User 15.6. United Kingdom 15.6.1. Pricing Analysis 15.6.2. Market Share Analysis, 2021 15.6.2.1. By Extraction Process 15.6.2.2. By Type 15.6.2.3. By Application 15.6.2.4. By End User 15.7. France 15.7.1. Pricing Analysis 15.7.2. Market Share Analysis, 2021 15.7.2.1. By Extraction Process 15.7.2.2. By Type 15.7.2.3. By Application 15.7.2.4. By End User 15.8. Spain 15.8.1. Pricing Analysis 15.8.2. Market Share Analysis, 2021 15.8.2.1. By Extraction Process 15.8.2.2. By Type 15.8.2.3. By Application 15.8.2.4. By End User 15.9. Italy 15.9.1. Pricing Analysis 15.9.2. Market Share Analysis, 2021 15.9.2.1. By Extraction Process 15.9.2.2. By Type 15.9.2.3. By Application 15.9.2.4. By End User 15.10. China 15.10.1. Pricing Analysis 15.10.2. Market Share Analysis, 2021 15.10.2.1. By Extraction Process 15.10.2.2. By Type 15.10.2.3. By Application 15.10.2.4. By End User 15.11. Japan 15.11.1. Pricing Analysis 15.11.2. Market Share Analysis, 2021 15.11.2.1. By Extraction Process 15.11.2.2. By Type 15.11.2.3. By Application 15.11.2.4. By End User 15.12. South Korea 15.12.1. Pricing Analysis 15.12.2. Market Share Analysis, 2021 15.12.2.1. By Extraction Process 15.12.2.2. By Type 15.12.2.3. By Application 15.12.2.4. By End User 15.13. Singapore 15.13.1. Pricing Analysis 15.13.2. Market Share Analysis, 2021 15.13.2.1. By Extraction Process 15.13.2.2. By Type 15.13.2.3. By Application 15.13.2.4. By End User 15.14. Thailand 15.14.1. Pricing Analysis 15.14.2. Market Share Analysis, 2021 15.14.2.1. By Extraction Process 15.14.2.2. By Type 15.14.2.3. By Application 15.14.2.4. By End User 15.15. Indonesia 15.15.1. Pricing Analysis 15.15.2. Market Share Analysis, 2021 15.15.2.1. By Extraction Process 15.15.2.2. By Type 15.15.2.3. By Application 15.15.2.4. By End User 15.16. Australia 15.16.1. Pricing Analysis 15.16.2. Market Share Analysis, 2021 15.16.2.1. By Extraction Process 15.16.2.2. By Type 15.16.2.3. By Application 15.16.2.4. By End User 15.17. New Zealand 15.17.1. Pricing Analysis 15.17.2. Market Share Analysis, 2021 15.17.2.1. By Extraction Process 15.17.2.2. By Type 15.17.2.3. By Application 15.17.2.4. By End User 15.18. GCC Countries 15.18.1. Pricing Analysis 15.18.2. Market Share Analysis, 2021 15.18.2.1. By Extraction Process 15.18.2.2. By Type 15.18.2.3. By Application 15.18.2.4. By End User 15.19. South Africa 15.19.1. Pricing Analysis 15.19.2. Market Share Analysis, 2021 15.19.2.1. By Extraction Process 15.19.2.2. By Type 15.19.2.3. By Application 15.19.2.4. By End User 15.20. Israel 15.20.1. Pricing Analysis 15.20.2. Market Share Analysis, 2021 15.20.2.1. By Extraction Process 15.20.2.2. By Type 15.20.2.3. By Application 15.20.2.4. By End User 16. Market Structure Analysis 16.1. Competition Dashboard 16.2. Competition Benchmarking 16.3. Market Share Analysis of Top Players 16.3.1. By Regional 16.3.2. By Extraction Process 16.3.3. By Type 16.3.4. By Application 16.3.5. By End User 17. Competition Analysis 17.1. Competition Deep Dive 17.1.1. NewGen Direct Ltd 17.1.1.1. Overview 17.1.1.2. Product Portfolio 17.1.1.3. Profitability by Market Segments 17.1.1.4. Sales Footprint 17.1.1.5. Strategy Overview 17.1.1.5.1. Marketing Strategy 17.1.1.5.2. Product Strategy 17.1.1.5.3. Channel Strategy 17.1.2. Axiom Foods, Inc. 17.1.2.1. Overview 17.1.2.2. Product Portfolio 17.1.2.3. Profitability by Market Segments 17.1.2.4. Sales Footprint 17.1.2.5. Strategy Overview 17.1.2.5.1. Marketing Strategy 17.1.2.5.2. Product Strategy 17.1.2.5.3. Channel Strategy 17.1.3. Hill Pharma 17.1.3.1. Overview 17.1.3.2. Product Portfolio 17.1.3.3. Profitability by Market Segments 17.1.3.4. Sales Footprint 17.1.3.5. Strategy Overview 17.1.3.5.1. Marketing Strategy 17.1.3.5.2. Product Strategy 17.1.3.5.3. Channel Strategy 17.1.4. AIDP Inc. 17.1.4.1. Overview 17.1.4.2. Product Portfolio 17.1.4.3. Profitability by Market Segments 17.1.4.4. Sales Footprint 17.1.4.5. Strategy Overview 17.1.4.5.1. Marketing Strategy 17.1.4.5.2. Product Strategy 17.1.4.5.3. Channel Strategy 17.1.5. RiceBran Technologies 17.1.5.1. Overview 17.1.5.2. Product Portfolio 17.1.5.3. Profitability by Market Segments 17.1.5.4. Sales Footprint 17.1.5.5. Strategy Overview 17.1.5.5.1. Marketing Strategy 17.1.5.5.2. Product Strategy 17.1.5.5.3. Channel Strategy 17.1.6. Golden Grain Group Limited 17.1.6.1. Overview 17.1.6.2. Product Portfolio 17.1.6.3. Profitability by Market Segments 17.1.6.4. Sales Footprint 17.1.6.5. Strategy Overview 17.1.6.5.1. Marketing Strategy 17.1.6.5.2. Product Strategy 17.1.6.5.3. Channel Strategy 17.1.7. Ribus, Inc. 17.1.7.1. Overview 17.1.7.2. Product Portfolio 17.1.7.3. Profitability by Market Segments 17.1.7.4. Sales Footprint 17.1.7.5. Strategy Overview 17.1.7.5.1. Marketing Strategy 17.1.7.5.2. Product Strategy 17.1.7.5.3. Channel Strategy 17.1.8. Bioway (Xi’an) Organic Ingredients Co. Ltd. 17.1.8.1. Overview 17.1.8.2. Product Portfolio 17.1.8.3. Profitability by Market Segments 17.1.8.4. Sales Footprint 17.1.8.5. Strategy Overview 17.1.8.5.1. Marketing Strategy 17.1.8.5.2. Product Strategy 17.1.8.5.3. Channel Strategy 17.1.9. Green Labs, LLC 17.1.9.1. Overview 17.1.9.2. Product Portfolio 17.1.9.3. Profitability by Market Segments 17.1.9.4. Sales Footprint 17.1.9.5. Strategy Overview 17.1.9.5.1. Marketing Strategy 17.1.9.5.2. Product Strategy 17.1.9.5.3. Channel Strategy 17.1.10. Shafi Gluco-Chem (Pvt.) Ltd. 17.1.10.1. Overview 17.1.10.2. Product Portfolio 17.1.10.3. Profitability by Market Segments 17.1.10.4. Sales Footprint 17.1.10.5. Strategy Overview 17.1.10.5.1. Marketing Strategy 17.1.10.5.2. Product Strategy 17.1.10.5.3. Channel Strategy 18. Assumptions & Acronyms Used 19. Research Methodology
Let us know your requirement to get
100% FREE customization
List of Tables
Table 1: Global Market Value (US$ Million) Forecast by Region, 2016 to 2032 Table 2: Global Market Volume (Tons) Forecast by Region, 2016 to 2032 Table 3: Global Market Value (US$ Million) Forecast by Extraction Process, 2016 to 2032 Table 4: Global Market Volume (Tons) Forecast by Extraction Process, 2016 to 2032 Table 5: Global Market Value (US$ Million) Forecast by Type, 2016 to 2032 Table 6: Global Market Volume (Tons) Forecast by Type, 2016 to 2032 Table 7: Global Market Value (US$ Million) Forecast by Application, 2016 to 2032 Table 8: Global Market Volume (Tons) Forecast by Application, 2016 to 2032 Table 9: Global Market Value (US$ Million) Forecast by End User, 2016 to 2032 Table 10: Global Market Volume (Tons) Forecast by End User, 2016 to 2032 Table 11: North America Market Value (US$ Million) Forecast by Country, 2016 to 2032 Table 12: North America Market Volume (Tons) Forecast by Country, 2016 to 2032 Table 13: North America Market Value (US$ Million) Forecast by Extraction Process, 2016 to 2032 Table 14: North America Market Volume (Tons) Forecast by Extraction Process, 2016 to 2032 Table 15: North America Market Value (US$ Million) Forecast by Type, 2016 to 2032 Table 16: North America Market Volume (Tons) Forecast by Type, 2016 to 2032 Table 17: North America Market Value (US$ Million) Forecast by Application, 2016 to 2032 Table 18: North America Market Volume (Tons) Forecast by Application, 2016 to 2032 Table 19: North America Market Value (US$ Million) Forecast by End User, 2016 to 2032 Table 20: North America Market Volume (Tons) Forecast by End User, 2016 to 2032 Table 21: Latin America Market Value (US$ Million) Forecast by Country, 2016 to 2032 Table 22: Latin America Market Volume (Tons) Forecast by Country, 2016 to 2032 Table 23: Latin America Market Value (US$ Million) Forecast by Extraction Process, 2016 to 2032 Table 24: Latin America Market Volume (Tons) Forecast by Extraction Process, 2016 to 2032 Table 25: Latin America Market Value (US$ Million) Forecast by Type, 2016 to 2032 Table 26: Latin America Market Volume (Tons) Forecast by Type, 2016 to 2032 Table 27: Latin America Market Value (US$ Million) Forecast by Application, 2016 to 2032 Table 28: Latin America Market Volume (Tons) Forecast by Application, 2016 to 2032 Table 29: Latin America Market Value (US$ Million) Forecast by End User, 2016 to 2032 Table 30: Latin America Market Volume (Tons) Forecast by End User, 2016 to 2032 Table 31: Europe Market Value (US$ Million) Forecast by Country, 2016 to 2032 Table 32: Europe Market Volume (Tons) Forecast by Country, 2016 to 2032 Table 33: Europe Market Value (US$ Million) Forecast by Extraction Process, 2016 to 2032 Table 34: Europe Market Volume (Tons) Forecast by Extraction Process, 2016 to 2032 Table 35: Europe Market Value (US$ Million) Forecast by Type, 2016 to 2032 Table 36: Europe Market Volume (Tons) Forecast by Type, 2016 to 2032 Table 37: Europe Market Value (US$ Million) Forecast by Application, 2016 to 2032 Table 38: Europe Market Volume (Tons) Forecast by Application, 2016 to 2032 Table 39: Europe Market Value (US$ Million) Forecast by End User, 2016 to 2032 Table 40: Europe Market Volume (Tons) Forecast by End User, 2016 to 2032 Table 41: Asia Pacific Market Value (US$ Million) Forecast by Country, 2016 to 2032 Table 42: Asia Pacific Market Volume (Tons) Forecast by Country, 2016 to 2032 Table 43: Asia Pacific Market Value (US$ Million) Forecast by Extraction Process, 2016 to 2032 Table 44: Asia Pacific Market Volume (Tons) Forecast by Extraction Process, 2016 to 2032 Table 45: Asia Pacific Market Value (US$ Million) Forecast by Type, 2016 to 2032 Table 46: Asia Pacific Market Volume (Tons) Forecast by Type, 2016 to 2032 Table 47: Asia Pacific Market Value (US$ Million) Forecast by Application, 2016 to 2032 Table 48: Asia Pacific Market Volume (Tons) Forecast by Application, 2016 to 2032 Table 49: Asia Pacific Market Value (US$ Million) Forecast by End User, 2016 to 2032 Table 50: Asia Pacific Market Volume (Tons) Forecast by End User, 2016 to 2032 Table 51: MEA Market Value (US$ Million) Forecast by Country, 2016 to 2032 Table 52: MEA Market Volume (Tons) Forecast by Country, 2016 to 2032 Table 53: MEA Market Value (US$ Million) Forecast by Extraction Process, 2016 to 2032 Table 54: MEA Market Volume (Tons) Forecast by Extraction Process, 2016 to 2032 Table 55: MEA Market Value (US$ Million) Forecast by Type, 2016 to 2032 Table 56: MEA Market Volume (Tons) Forecast by Type, 2016 to 2032 Table 57: MEA Market Value (US$ Million) Forecast by Application, 2016 to 2032 Table 58: MEA Market Volume (Tons) Forecast by Application, 2016 to 2032 Table 59: MEA Market Value (US$ Million) Forecast by End User, 2016 to 2032 Table 60: MEA Market Volume (Tons) Forecast by End User, 2016 to 2032
Find your sweet spots for generating winning opportunities in this market.
Talk to AnalystList of Charts
Figure 1: Global Market Value (US$ Million) by Extraction Process, 2022 to 2032 Figure 2: Global Market Value (US$ Million) by Type, 2022 to 2032 Figure 3: Global Market Value (US$ Million) by Application, 2022 to 2032 Figure 4: Global Market Value (US$ Million) by End User, 2022 to 2032 Figure 5: Global Market Value (US$ Million) by Region, 2022 to 2032 Figure 6: Global Market Value (US$ Million) Analysis by Region, 2016 to 2032 Figure 7: Global Market Volume (Tons) Analysis by Region, 2016 to 2032 Figure 8: Global Market Value Share (%) and BPS Analysis by Region, 2022 to 2032 Figure 9: Global Market Y-o-Y Growth (%) Projections by Region, 2022 to 2032 Figure 10: Global Market Value (US$ Million) Analysis by Extraction Process, 2016 to 2032 Figure 11: Global Market Volume (Tons) Analysis by Extraction Process, 2016 to 2032 Figure 12: Global Market Value Share (%) and BPS Analysis by Extraction Process, 2022 to 2032 Figure 13: Global Market Y-o-Y Growth (%) Projections by Extraction Process, 2022 to 2032 Figure 14: Global Market Value (US$ Million) Analysis by Type, 2016 to 2032 Figure 15: Global Market Volume (Tons) Analysis by Type, 2016 to 2032 Figure 16: Global Market Value Share (%) and BPS Analysis by Type, 2022 to 2032 Figure 17: Global Market Y-o-Y Growth (%) Projections by Type, 2022 to 2032 Figure 18: Global Market Value (US$ Million) Analysis by Application, 2016 to 2032 Figure 19: Global Market Volume (Tons) Analysis by Application, 2016 to 2032 Figure 20: Global Market Value Share (%) and BPS Analysis by Application, 2022 to 2032 Figure 21: Global Market Y-o-Y Growth (%) Projections by Application, 2022 to 2032 Figure 22: Global Market Value (US$ Million) Analysis by End User, 2016 to 2032 Figure 23: Global Market Volume (Tons) Analysis by End User, 2016 to 2032 Figure 24: Global Market Value Share (%) and BPS Analysis by End User, 2022 to 2032 Figure 25: Global Market Y-o-Y Growth (%) Projections by End User, 2022 to 2032 Figure 26: Global Market Attractiveness by Extraction Process, 2022 to 2032 Figure 27: Global Market Attractiveness by Type, 2022 to 2032 Figure 28: Global Market Attractiveness by Application, 2022 to 2032 Figure 29: Global Market Attractiveness by End User, 2022 to 2032 Figure 30: Global Market Attractiveness by Region, 2022 to 2032 Figure 31: North America Market Value (US$ Million) by Extraction Process, 2022 to 2032 Figure 32: North America Market Value (US$ Million) by Type, 2022 to 2032 Figure 33: North America Market Value (US$ Million) by Application, 2022 to 2032 Figure 34: North America Market Value (US$ Million) by End User, 2022 to 2032 Figure 35: North America Market Value (US$ Million) by Country, 2022 to 2032 Figure 36: North America Market Value (US$ Million) Analysis by Country, 2016 to 2032 Figure 37: North America Market Volume (Tons) Analysis by Country, 2016 to 2032 Figure 38: North America Market Value Share (%) and BPS Analysis by Country, 2022 to 2032 Figure 39: North America Market Y-o-Y Growth (%) Projections by Country, 2022 to 2032 Figure 40: North America Market Value (US$ Million) Analysis by Extraction Process, 2016 to 2032 Figure 41: North America Market Volume (Tons) Analysis by Extraction Process, 2016 to 2032 Figure 42: North America Market Value Share (%) and BPS Analysis by Extraction Process, 2022 to 2032 Figure 43: North America Market Y-o-Y Growth (%) Projections by Extraction Process, 2022 to 2032 Figure 44: North America Market Value (US$ Million) Analysis by Type, 2016 to 2032 Figure 45: North America Market Volume (Tons) Analysis by Type, 2016 to 2032 Figure 46: North America Market Value Share (%) and BPS Analysis by Type, 2022 to 2032 Figure 47: North America Market Y-o-Y Growth (%) Projections by Type, 2022 to 2032 Figure 48: North America Market Value (US$ Million) Analysis by Application, 2016 to 2032 Figure 49: North America Market Volume (Tons) Analysis by Application, 2016 to 2032 Figure 50: North America Market Value Share (%) and BPS Analysis by Application, 2022 to 2032 Figure 51: North America Market Y-o-Y Growth (%) Projections by Application, 2022 to 2032 Figure 52: North America Market Value (US$ Million) Analysis by End User, 2016 to 2032 Figure 53: North America Market Volume (Tons) Analysis by End User, 2016 to 2032 Figure 54: North America Market Value Share (%) and BPS Analysis by End User, 2022 to 2032 Figure 55: North America Market Y-o-Y Growth (%) Projections by End User, 2022 to 2032 Figure 56: North America Market Attractiveness by Extraction Process, 2022 to 2032 Figure 57: North America Market Attractiveness by Type, 2022 to 2032 Figure 58: North America Market Attractiveness by Application, 2022 to 2032 Figure 59: North America Market Attractiveness by End User, 2022 to 2032 Figure 60: North America Market Attractiveness by Country, 2022 to 2032 Figure 61: Latin America Market Value (US$ Million) by Extraction Process, 2022 to 2032 Figure 62: Latin America Market Value (US$ Million) by Type, 2022 to 2032 Figure 63: Latin America Market Value (US$ Million) by Application, 2022 to 2032 Figure 64: Latin America Market Value (US$ Million) by End User, 2022 to 2032 Figure 65: Latin America Market Value (US$ Million) by Country, 2022 to 2032 Figure 66: Latin America Market Value (US$ Million) Analysis by Country, 2016 to 2032 Figure 67: Latin America Market Volume (Tons) Analysis by Country, 2016 to 2032 Figure 68: Latin America Market Value Share (%) and BPS Analysis by Country, 2022 to 2032 Figure 69: Latin America Market Y-o-Y Growth (%) Projections by Country, 2022 to 2032 Figure 70: Latin America Market Value (US$ Million) Analysis by Extraction Process, 2016 to 2032 Figure 71: Latin America Market Volume (Tons) Analysis by Extraction Process, 2016 to 2032 Figure 72: Latin America Market Value Share (%) and BPS Analysis by Extraction Process, 2022 to 2032 Figure 73: Latin America Market Y-o-Y Growth (%) Projections by Extraction Process, 2022 to 2032 Figure 74: Latin America Market Value (US$ Million) Analysis by Type, 2016 to 2032 Figure 75: Latin America Market Volume (Tons) Analysis by Type, 2016 to 2032 Figure 76: Latin America Market Value Share (%) and BPS Analysis by Type, 2022 to 2032 Figure 77: Latin America Market Y-o-Y Growth (%) Projections by Type, 2022 to 2032 Figure 78: Latin America Market Value (US$ Million) Analysis by Application, 2016 to 2032 Figure 79: Latin America Market Volume (Tons) Analysis by Application, 2016 to 2032 Figure 80: Latin America Market Value Share (%) and BPS Analysis by Application, 2022 to 2032 Figure 81: Latin America Market Y-o-Y Growth (%) Projections by Application, 2022 to 2032 Figure 82: Latin America Market Value (US$ Million) Analysis by End User, 2016 to 2032 Figure 83: Latin America Market Volume (Tons) Analysis by End User, 2016 to 2032 Figure 84: Latin America Market Value Share (%) and BPS Analysis by End User, 2022 to 2032 Figure 85: Latin America Market Y-o-Y Growth (%) Projections by End User, 2022 to 2032 Figure 86: Latin America Market Attractiveness by Extraction Process, 2022 to 2032 Figure 87: Latin America Market Attractiveness by Type, 2022 to 2032 Figure 88: Latin America Market Attractiveness by Application, 2022 to 2032 Figure 89: Latin America Market Attractiveness by End User, 2022 to 2032 Figure 90: Latin America Market Attractiveness by Country, 2022 to 2032 Figure 91: Europe Market Value (US$ Million) by Extraction Process, 2022 to 2032 Figure 92: Europe Market Value (US$ Million) by Type, 2022 to 2032 Figure 93: Europe Market Value (US$ Million) by Application, 2022 to 2032 Figure 94: Europe Market Value (US$ Million) by End User, 2022 to 2032 Figure 95: Europe Market Value (US$ Million) by Country, 2022 to 2032 Figure 96: Europe Market Value (US$ Million) Analysis by Country, 2016 to 2032 Figure 97: Europe Market Volume (Tons) Analysis by Country, 2016 to 2032 Figure 98: Europe Market Value Share (%) and BPS Analysis by Country, 2022 to 2032 Figure 99: Europe Market Y-o-Y Growth (%) Projections by Country, 2022 to 2032 Figure 100: Europe Market Value (US$ Million) Analysis by Extraction Process, 2016 to 2032 Figure 101: Europe Market Volume (Tons) Analysis by Extraction Process, 2016 to 2032 Figure 102: Europe Market Value Share (%) and BPS Analysis by Extraction Process, 2022 to 2032 Figure 103: Europe Market Y-o-Y Growth (%) Projections by Extraction Process, 2022 to 2032 Figure 104: Europe Market Value (US$ Million) Analysis by Type, 2016 to 2032 Figure 105: Europe Market Volume (Tons) Analysis by Type, 2016 to 2032 Figure 106: Europe Market Value Share (%) and BPS Analysis by Type, 2022 to 2032 Figure 107: Europe Market Y-o-Y Growth (%) Projections by Type, 2022 to 2032 Figure 108: Europe Market Value (US$ Million) Analysis by Application, 2016 to 2032 Figure 109: Europe Market Volume (Tons) Analysis by Application, 2016 to 2032 Figure 110: Europe Market Value Share (%) and BPS Analysis by Application, 2022 to 2032 Figure 111: Europe Market Y-o-Y Growth (%) Projections by Application, 2022 to 2032 Figure 112: Europe Market Value (US$ Million) Analysis by End User, 2016 to 2032 Figure 113: Europe Market Volume (Tons) Analysis by End User, 2016 to 2032 Figure 114: Europe Market Value Share (%) and BPS Analysis by End User, 2022 to 2032 Figure 115: Europe Market Y-o-Y Growth (%) Projections by End User, 2022 to 2032 Figure 116: Europe Market Attractiveness by Extraction Process, 2022 to 2032 Figure 117: Europe Market Attractiveness by Type, 2022 to 2032 Figure 118: Europe Market Attractiveness by Application, 2022 to 2032 Figure 119: Europe Market Attractiveness by End User, 2022 to 2032 Figure 120: Europe Market Attractiveness by Country, 2022 to 2032 Figure 121: Asia Pacific Market Value (US$ Million) by Extraction Process, 2022 to 2032 Figure 122: Asia Pacific Market Value (US$ Million) by Type, 2022 to 2032 Figure 123: Asia Pacific Market Value (US$ Million) by Application, 2022 to 2032 Figure 124: Asia Pacific Market Value (US$ Million) by End User, 2022 to 2032 Figure 125: Asia Pacific Market Value (US$ Million) by Country, 2022 to 2032 Figure 126: Asia Pacific Market Value (US$ Million) Analysis by Country, 2016 to 2032 Figure 127: Asia Pacific Market Volume (Tons) Analysis by Country, 2016 to 2032 Figure 128: Asia Pacific Market Value Share (%) and BPS Analysis by Country, 2022 to 2032 Figure 129: Asia Pacific Market Y-o-Y Growth (%) Projections by Country, 2022 to 2032 Figure 130: Asia Pacific Market Value (US$ Million) Analysis by Extraction Process, 2016 to 2032 Figure 131: Asia Pacific Market Volume (Tons) Analysis by Extraction Process, 2016 to 2032 Figure 132: Asia Pacific Market Value Share (%) and BPS Analysis by Extraction Process, 2022 to 2032 Figure 133: Asia Pacific Market Y-o-Y Growth (%) Projections by Extraction Process, 2022 to 2032 Figure 134: Asia Pacific Market Value (US$ Million) Analysis by Type, 2016 to 2032 Figure 135: Asia Pacific Market Volume (Tons) Analysis by Type, 2016 to 2032 Figure 136: Asia Pacific Market Value Share (%) and BPS Analysis by Type, 2022 to 2032 Figure 137: Asia Pacific Market Y-o-Y Growth (%) Projections by Type, 2022 to 2032 Figure 138: Asia Pacific Market Value (US$ Million) Analysis by Application, 2016 to 2032 Figure 139: Asia Pacific Market Volume (Tons) Analysis by Application, 2016 to 2032 Figure 140: Asia Pacific Market Value Share (%) and BPS Analysis by Application, 2022 to 2032 Figure 141: Asia Pacific Market Y-o-Y Growth (%) Projections by Application, 2022 to 2032 Figure 142: Asia Pacific Market Value (US$ Million) Analysis by End User, 2016 to 2032 Figure 143: Asia Pacific Market Volume (Tons) Analysis by End User, 2016 to 2032 Figure 144: Asia Pacific Market Value Share (%) and BPS Analysis by End User, 2022 to 2032 Figure 145: Asia Pacific Market Y-o-Y Growth (%) Projections by End User, 2022 to 2032 Figure 146: Asia Pacific Market Attractiveness by Extraction Process, 2022 to 2032 Figure 147: Asia Pacific Market Attractiveness by Type, 2022 to 2032 Figure 148: Asia Pacific Market Attractiveness by Application, 2022 to 2032 Figure 149: Asia Pacific Market Attractiveness by End User, 2022 to 2032 Figure 150: Asia Pacific Market Attractiveness by Country, 2022 to 2032 Figure 151: MEA Market Value (US$ Million) by Extraction Process, 2022 to 2032 Figure 152: MEA Market Value (US$ Million) by Type, 2022 to 2032 Figure 153: MEA Market Value (US$ Million) by Application, 2022 to 2032 Figure 154: MEA Market Value (US$ Million) by End User, 2022 to 2032 Figure 155: MEA Market Value (US$ Million) by Country, 2022 to 2032 Figure 156: MEA Market Value (US$ Million) Analysis by Country, 2016 to 2032 Figure 157: MEA Market Volume (Tons) Analysis by Country, 2016 to 2032 Figure 158: MEA Market Value Share (%) and BPS Analysis by Country, 2022 to 2032 Figure 159: MEA Market Y-o-Y Growth (%) Projections by Country, 2022 to 2032 Figure 160: MEA Market Value (US$ Million) Analysis by Extraction Process, 2016 to 2032 Figure 161: MEA Market Volume (Tons) Analysis by Extraction Process, 2016 to 2032 Figure 162: MEA Market Value Share (%) and BPS Analysis by Extraction Process, 2022 to 2032 Figure 163: MEA Market Y-o-Y Growth (%) Projections by Extraction Process, 2022 to 2032 Figure 164: MEA Market Value (US$ Million) Analysis by Type, 2016 to 2032 Figure 165: MEA Market Volume (Tons) Analysis by Type, 2016 to 2032 Figure 166: MEA Market Value Share (%) and BPS Analysis by Type, 2022 to 2032 Figure 167: MEA Market Y-o-Y Growth (%) Projections by Type, 2022 to 2032 Figure 168: MEA Market Value (US$ Million) Analysis by Application, 2016 to 2032 Figure 169: MEA Market Volume (Tons) Analysis by Application, 2016 to 2032 Figure 170: MEA Market Value Share (%) and BPS Analysis by Application, 2022 to 2032 Figure 171: MEA Market Y-o-Y Growth (%) Projections by Application, 2022 to 2032 Figure 172: MEA Market Value (US$ Million) Analysis by End User, 2016 to 2032 Figure 173: MEA Market Volume (Tons) Analysis by End User, 2016 to 2032 Figure 174: MEA Market Value Share (%) and BPS Analysis by End User, 2022 to 2032 Figure 175: MEA Market Y-o-Y Growth (%) Projections by End User, 2022 to 2032 Figure 176: MEA Market Attractiveness by Extraction Process, 2022 to 2032 Figure 177: MEA Market Attractiveness by Type, 2022 to 2032 Figure 178: MEA Market Attractiveness by Application, 2022 to 2032 Figure 179: MEA Market Attractiveness by End User, 2022 to 2032 Figure 180: MEA Market Attractiveness by Country, 2022 to 2032
Need specific information?
Request CustomizationExplore Food and Beverage Insights
View Reports