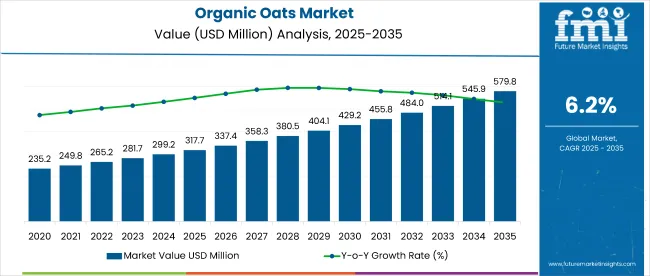
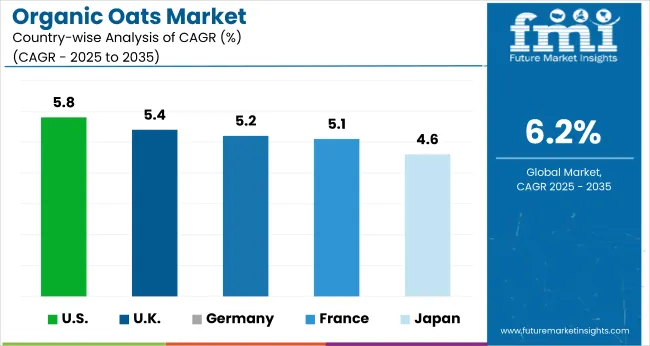
The global organic oat market is one of the booming markets in the food industry. The organic oats market is estimated to have a market value of US$ 281.0 million in the year 2023 and is expected to have a rapid growth registering a CAGR of 6.4% by the year 2033 which is anticipated to make the total market value of US$ 520.5 million by 2033.
Attribute | Details |
---|---|
Market Size Value in 2023 | US$ 281.0 million |
Market Forecast Value in 2033 | US$ 520.5 million |
Global Growth Rate (2023 to 2033) | 6.4% CAGR |
Top 3 Country Share, 2023 | 33% |
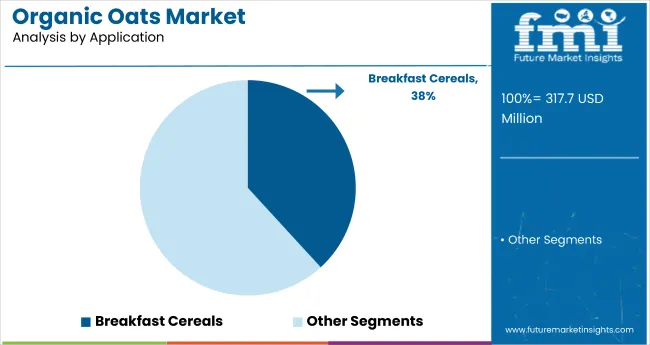
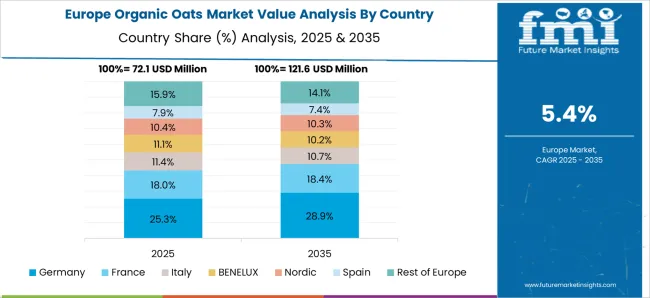
Growing consumer health consciousness, as well as the emerging demand for plant-based food items, are major drivers for organic oat market. Organic oats are extremely popular as a breakfast cereal because of their health benefits. Organic oatmeal is considered to be a high-protein diet that also contains soluble fiber, which has several health benefits and aids in blood sugar & cholesterol control. North America and Europe are the two most demanding regions for organic oats. Organic oats consumption is likely to increase quicker in each of these locations, owing to well-established facilities and well-organized supply chains and logistics systems.
Don't pay for what you don't need
Customize your report by selecting specific countries or regions and save 30%!
The organic oat market is growing due to rising popularity and a preference for healthier meals. Most customers now expect foods and drinks to meet increasingly intricate health and wellbeing, ethics, and environmental requirements. Due to its health advantages and high nutritional value, oatmeal is widely consumed as a healthy breakfast alternative. Organic oatmeal has a number of health benefits, including weight management, blood sugar control, cholesterol reduction, and more.
In the future years, the organic oat market’s major players are anticipated to offer new products to meet rising customer demand for nutrient-dense breakfast options. General Mills, Inc., for example, increased its Fibre One Breakfast cereal line in the United States in 2017 by introducing morning meals prepared with steel-cut oatmeal and strawberries. As a result, the organic oats market is predicted to rise in the next years due to its rising popularity and inclination for nutritious meals.
Customers are growing interested in organic flavored-enhanced oats because of their exquisite taste and health benefits. Manufacturers are creating flavored organic oat foods with cinnamon, apples, cranberries, peaches, spices & in response to the rising demand for organic food. Organic oats, for example, benefit from these versions since they increase the flavor of plant-based foods.
In addition, increased consumer desire for vibrant and spicy-flavored dishes is expected to support organic oats producers' growth over the forecast period. Manufacturers curate these flavored oat products based on the location in which they are offered.
Many of the top organic oat markets are also concentrating on innovation and product development in order to meet consumer demand. Such research, development, and innovativeness assist businesses in developing new flavors to satisfy their customers' palates.
Chobani Oat, for example, a company that makes oat-based products, has introduced organic oat drinks in a variety of tastes. These gluten-free oats come in a variety of flavors, including chocolate, vanilla, creamy, and others.
Big nations are gradually adopting organic farming to encourage chemical-free food production. Increasing production of plants & organic crops like wheat, oats, rice, soybeans, and others has risen in response to rising customer demand for organic oat. Organic oats, soybeans, corn, barley & wheat production increased by 20%.
To meet rising consumer demand, major agricultural corporations are ramping up the production of organic grains. Grains are a popular dietary item, and they're also widely employed in the food sector, which has raised the consumption of organic grains. Organic farming has expanded in major countries during the last ten years, according to data.
Organic farming approaches also strengthen agricultural farms' agronomic and economic foundations. This allows farmers to take a more cost-effective approach and to operate without the need for a farm loan. Organic farming is a forward-thinking method that aids in the production and distribution of nutritionally unique potent products on a global scale.
Organic oat-based goods are becoming increasingly popular among customers, notably in Europe & North America. India, China, Brazil, and other emerging economies are seeing fast economic expansion. Consumers may now spend a lot of money on natural and organic items like organic oat snacks because their per capita income has increased.
A growing number of people are turning to western organic oat goods like oatmeals, oat noodles, oat cookies, and other organic oat-based food products that are widely available. Aside from that, organic oat producers are transferring their focus to other emerging countries in order to boost sales of organic oat and expand their regional footprint. Many businesses are spending on modern technology such as state-of-the-art machinery, which helps them achieve operational efficiency while also assisting in organic oat product creation.
Get the data you need at a Fraction of the cost
Personalize your report by choosing insights you need
and save 40%!
Although organic oats powder is becoming increasingly popular as a healthy food additive, the high availability of replacements for natural and organic oats is presenting a threat to the international organic oat market. Organic oats are one of the most widely consumed organic grains in the world due to their healthy and nutritious features. Other organic grain products, on the other hand, are increasingly being employed to suit the nutritional needs of customers.
Organic oats are mostly consumed in North America and Europe, whereas demand for organic oats is quite low in other regions of the world, like the Middle East, South Asia, and Africa, where rice, wheat, corn, and other organic products take precedence.
Organic oat is thought to be of higher quality and safer than regular oats. High pricing for organic oats, on the other hand, is expected to limit the organic oat market growth. Organic oats are produced through organic farming, which is more expensive due to the quality controls & time, resulting in higher prices for organic oat offers.
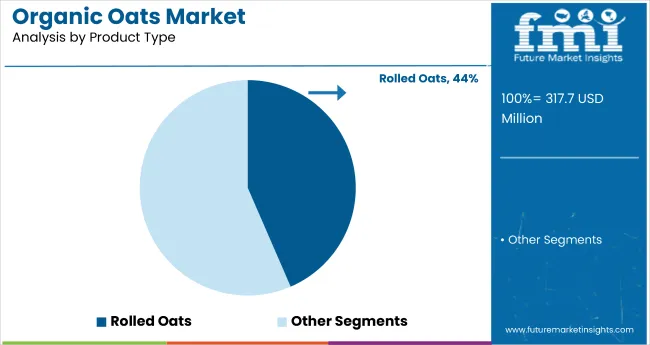
In the organic oats category, rolled organic oats are the most popular and consumed product type. The rolled oats segment has a market value share of 43.5%. Demand for rolled oats in the retail sector is increasing due to consumer popularity, convenience, and numerous health benefits.
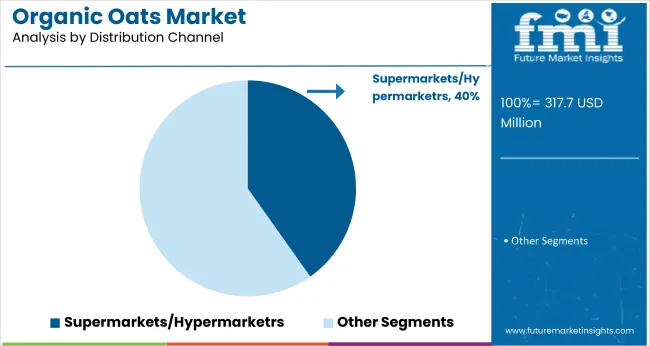
Organic oats are becoming more popular as a result of their ease of availability. Furthermore, the market value of organic oats in the Business to Business (B2B) distribution channel category is expected to reach US$ 3.9 billion by the end of the forecast period.
The organic oats market in Asia Pacific is dominated by China. With a total market value of US$ 307 million, China accounts for 32% of the Asia Pacific market. This is due to customers' raising awareness of the nutrition and health benefits of organic oats.
Furthermore, the product market would benefit from the rising demand for easy foods and the availability of natural & organic food products with nutritional benefits in the food & beverage industry. China's market is expected to develop at a CAGR of 6.1%.
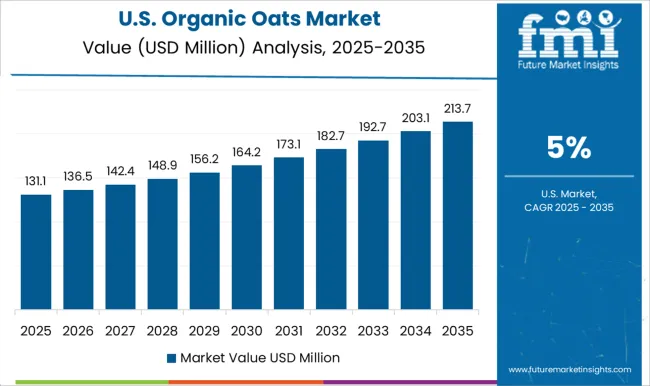
Due to an expanding obese population in the United States, the United States is expected to dominate the global organic oats market throughout the forecast years. The region's organic oats market is expected to rise due to the rising population and increased knowledge of the health advantages of eating oats among many people.
The shifts in the eating pattern of the American populace, as well as the growing number of industry competitors, are expected to propel the organic oats market forward in the future years. United States is expected to hold a major organic oat market share of 65% which accounts for a market value of US$ 118.6 million.
As evidenced by the mapping, delivery and food science startups are overrepresented, owing to the rapid growth of two categories, particularly grocery delivery and alternative proteins. The unusual increase in demand has resulted in a slew of new startups with novel business models aimed at resolving today's crisis. These start-ups are not just small businesses.
The start-ups focus on game-changing trends:
The leading Montreal-based startup producing Canadian organic oat products is pleased to announce that it has raised C$7 million from strategic investors. The funds raised, may not only be used to support the company’s rapid growth and market position, but are anticipated to be used in the development and production of Canadian organic oat milk.
Pavitra Retail Pvt Ltd, based in Delhi, raised $1 million in a pre-Series A round of funding in July from Mumbai Angels, Contrarian Vriddhi Fund, and a group of wealthy individuals.
An online marketplace for organic products, received Rs 30 lakh ($49,370) in angel funding from Rajasthan Angel Investor Network two years ago. Prior to that, Freemont Partners invested in Natural Mantra, an online portal owned by Happy Earth Lifestyle Solutions Pvt Ltd.
Based in Rajasthan, raised an undisclosed amount from SIDBI Venture Capital's Samridhi Fund earlier this year. Last year, Ahmedabad-based Last Mile Accelerator invested $50,000 in organic food company Parvata.
Yishi Foods raised $3.13 million in pre-seed financing led by XYZ Investors in July, with plans to use the funds to support retail distribution, team building, and product development.
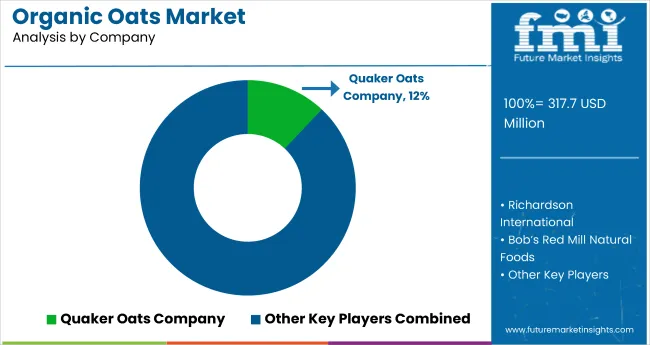
Key organic oats producers are focused on innovation, research and development, and expansions in order to obtain high-quality organic oats. Producers of organic oats are working hard and investing heavily to improve their operational and innovation capabilities.
Recent Development
Attribute | Details |
---|---|
Market Size Value in 2023 | US$ 281.0 million |
Market Forecast Value in 2033 | US$ 520.5 million |
Global Growth Rate (2023 to 2033) | 6.4% CAGR |
Forecast Period | 2023 to 2033 |
Historical Data Available for | 2018 to 2022 |
Market Analysis | MT for Volume and US$ million for Value |
Key Regions Covered | North America, Europe, Asia Pacific, Africa |
Key Countries Covered | Key Countries Covered United States, Germany, Italy, France, Canada, EU, China, Spain, ASEAN, Australia, and others. |
Key Market Segments | Product type, Application, and Region |
Key Companies Profiled | Is anticipated too Creek Organic Grain Co. Inc., Grain Millers, Inc., Richardson International Limited, Blue Lake Milling Pty Ltd, Pioneer Food Group Ltd., Nature's Path Foods, Inc., The Quaker Oats Company, Blue Lake Milling Pty Ltd, Pioneer Food Group Ltd., and others |
Pricing | Available upon Request |
The organic oats market is anticipated to reach a valuation of US$ 281.0 million in 2023.
China's organic oats industry is anticipated to surge at a CAGR of 6.1% through 2033.
The organic oats market is anticipated to reach US$ 520.5 million in 2033.
The United States organic oats industry is likely to garner 65% in revenue through 2023.
Shifts in American food preferences and new entrants present a significant opportunity for the market players.
1. Executive Summary 1.1. Global Market Outlook 1.2. Demand-side Trends 1.3. Supply-side Trends 1.4. Technology Roadmap Analysis 1.5. Analysis and Recommendations 2. Market Overview 2.1. Market Coverage / Taxonomy 2.2. Market Definition / Scope / Limitations 3. Market Background 3.1. Market Dynamics 3.1.1. Drivers 3.1.2. Restraints 3.1.3. Opportunity 3.1.4. Trends 3.2. Scenario Forecast 3.2.1. Demand in Optimistic Scenario 3.2.2. Demand in Likely Scenario 3.2.3. Demand in Conservative Scenario 3.3. Opportunity Map Analysis 3.4. Product Life Cycle Analysis 3.5. Supply Chain Analysis 3.5.1. Supply Side Participants and their Roles 3.5.1.1. Producers 3.5.1.2. Mid-Level Participants (Traders/ Agents/ Brokers) 3.5.1.3. Wholesalers and Distributors 3.5.2. Value Added and Value Created at Node in the Supply Chain 3.5.3. List of Raw Material Suppliers 3.5.4. List of Existing and Potential Buyer’s 3.6. Investment Feasibility Matrix 3.7. Value Chain Analysis 3.7.1. Profit Margin Analysis 3.7.2. Wholesalers and Distributors 3.7.3. Retailers 3.8. PESTLE and Porter’s Analysis 3.9. Regulatory Landscape 3.9.1. By Key Regions 3.9.2. By Key Countries 3.10. Regional Parent Market Outlook 3.11. Production and Consumption Statistics 3.12. Import and Export Statistics 4. Global Market Analysis 2018 to 2022 and Forecast, 2023 to 2033 4.1. Historical Market Size Value (US$ Million) & Volume (MT) Analysis, 2018 to 2022 4.2. Current and Future Market Size Value (US$ Million) & Volume (MT) Projections, 2023 to 2033 4.2.1. Y-o-Y Growth Trend Analysis 4.2.2. Absolute $ Opportunity Analysis 5. Global Market Analysis 2018 to 2022 and Forecast 2023 to 2033, By Application 5.1. Introduction / Key Findings 5.2. Historical Market Size Value (US$ Million) & Volume (MT) Analysis By Application, 2018 to 2022 5.3. Current and Future Market Size Value (US$ Million) & Volume (MT) Analysis and Forecast By Application, 2023 to 2033 5.3.1. Bakery Products 5.3.2. Breakfast Cereals 5.3.3. Savory & Snacks 5.3.4. Others 5.4. Y-o-Y Growth Trend Analysis By Application, 2018 to 2022 5.5. Absolute $ Opportunity Analysis By Application, 2023 to 2033 6. Global Market Analysis 2018 to 2022 and Forecast 2023 to 2033, By Product Type 6.1. Introduction / Key Findings 6.2. Historical Market Size Value (US$ Million) & Volume (MT) Analysis By Product Type, 2018 to 2022 6.3. Current and Future Market Size Value (US$ Million) & Volume (MT) Analysis and Forecast By Product Type, 2023 to 2033 6.3.1. Rolled Oats 6.3.2. Steel Cut Oats 6.3.3. Oats Bran 6.3.4. Oats Flour 6.4. Y-o-Y Growth Trend Analysis By Product Type, 2018 to 2022 6.5. Absolute $ Opportunity Analysis By Product Type, 2023 to 2033 7. Global Market Analysis 2018 to 2022 and Forecast 2023 to 2033, By Distribution Channel 7.1. Introduction / Key Findings 7.2. Historical Market Size Value (US$ Million) & Volume (MT) Analysis By Distribution Channel, 2018 to 2022 7.3. Current and Future Market Size Value (US$ Million) & Volume (MT) Analysis and Forecast By Distribution Channel, 2023 to 2033 7.3.1. Supermarket/ Hypermarket 7.3.2. Online Retail 7.3.3. Convenience Stores 7.3.4. Others 7.4. Y-o-Y Growth Trend Analysis By Distribution Channel, 2018 to 2022 7.5. Absolute $ Opportunity Analysis By Distribution Channel, 2023 to 2033 8. Global Market Analysis 2018 to 2022 and Forecast 2023 to 2033, By Region 8.1. Introduction 8.2. Historical Market Size Value (US$ Million) & Volume (MT) Analysis By Region, 2018 to 2022 8.3. Current Market Size Value (US$ Million) & Volume (MT) Analysis and Forecast By Region, 2023 to 2033 8.3.1. North America 8.3.2. Latin America 8.3.3. Western Europe 8.3.4. Eastern Europe 8.3.5. South Asia and Pacific 8.3.6. East Asia 8.3.7. Middle East and Africa 8.4. Market Attractiveness Analysis By Region 9. North America Market Analysis 2018 to 2022 and Forecast 2023 to 2033, By Country 9.1. Historical Market Size Value (US$ Million) & Volume (MT) Trend Analysis By Market Taxonomy, 2018 to 2022 9.2. Market Size Value (US$ Million) & Volume (MT) Forecast By Market Taxonomy, 2023 to 2033 9.2.1. By Country 9.2.1.1. The USA 9.2.1.2. Canada 9.2.2. By Application 9.2.3. By Product Type 9.2.4. By Distribution Channel 9.3. Market Attractiveness Analysis 9.3.1. By Country 9.3.2. By Application 9.3.3. By Product Type 9.3.4. By Distribution Channel 9.4. Key Takeaways 10. Latin America Market Analysis 2018 to 2022 and Forecast 2023 to 2033, By Country 10.1. Historical Market Size Value (US$ Million) & Volume (MT) Trend Analysis By Market Taxonomy, 2018 to 2022 10.2. Market Size Value (US$ Million) & Volume (MT) Forecast By Market Taxonomy, 2023 to 2033 10.2.1. By Country 10.2.1.1. Brazil 10.2.1.2. Mexico 10.2.1.3. Rest of Latin America 10.2.2. By Application 10.2.3. By Product Type 10.2.4. By Distribution Channel 10.3. Market Attractiveness Analysis 10.3.1. By Country 10.3.2. By Application 10.3.3. By Product Type 10.3.4. By Distribution Channel 10.4. Key Takeaways 11. Western Europe Market Analysis 2018 to 2022 and Forecast 2023 to 2033, By Country 11.1. Historical Market Size Value (US$ Million) & Volume (MT) Trend Analysis By Market Taxonomy, 2018 to 2022 11.2. Market Size Value (US$ Million) & Volume (MT) Forecast By Market Taxonomy, 2023 to 2033 11.2.1. By Country 11.2.1.1. Germany 11.2.1.2. United Kingdom 11.2.1.3. France 11.2.1.4. Spain 11.2.1.5. Italy 11.2.1.6. Rest of Western Europe 11.2.2. By Application 11.2.3. By Product Type 11.2.4. By Distribution Channel 11.3. Market Attractiveness Analysis 11.3.1. By Country 11.3.2. By Application 11.3.3. By Product Type 11.3.4. By Distribution Channel 11.4. Key Takeaways 12. Eastern Europe Market Analysis 2018 to 2022 and Forecast 2023 to 2033, By Country 12.1. Historical Market Size Value (US$ Million) & Volume (MT) Trend Analysis By Market Taxonomy, 2018 to 2022 12.2. Market Size Value (US$ Million) & Volume (MT) Forecast By Market Taxonomy, 2023 to 2033 12.2.1. By Country 12.2.1.1. Poland 12.2.1.2. Russia 12.2.1.3. Czech Republic 12.2.1.4. Romania 12.2.1.5. Rest of Eastern Europe 12.2.2. By Application 12.2.3. By Product Type 12.2.4. By Distribution Channel 12.3. Market Attractiveness Analysis 12.3.1. By Country 12.3.2. By Application 12.3.3. By Product Type 12.3.4. By Distribution Channel 12.4. Key Takeaways 13. South Asia and Pacific Market Analysis 2018 to 2022 and Forecast 2023 to 2033, By Country 13.1. Historical Market Size Value (US$ Million) & Volume (MT) Trend Analysis By Market Taxonomy, 2018 to 2022 13.2. Market Size Value (US$ Million) & Volume (MT) Forecast By Market Taxonomy, 2023 to 2033 13.2.1. By Country 13.2.1.1. India 13.2.1.2. Bangladesh 13.2.1.3. Australia 13.2.1.4. New Zealand 13.2.1.5. Rest of South Asia and Pacific 13.2.2. By Application 13.2.3. By Product Type 13.2.4. By Distribution Channel 13.3. Market Attractiveness Analysis 13.3.1. By Country 13.3.2. By Application 13.3.3. By Product Type 13.3.4. By Distribution Channel 13.4. Key Takeaways 14. East Asia Market Analysis 2018 to 2022 and Forecast 2023 to 2033, By Country 14.1. Historical Market Size Value (US$ Million) & Volume (MT) Trend Analysis By Market Taxonomy, 2018 to 2022 14.2. Market Size Value (US$ Million) & Volume (MT) Forecast By Market Taxonomy, 2023 to 2033 14.2.1. By Country 14.2.1.1. China 14.2.1.2. Japan 14.2.1.3. South Korea 14.2.2. By Application 14.2.3. By Product Type 14.2.4. By Distribution Channel 14.3. Market Attractiveness Analysis 14.3.1. By Country 14.3.2. By Application 14.3.3. By Product Type 14.3.4. By Distribution Channel 14.4. Key Takeaways 15. Middle East and Africa Market Analysis 2018 to 2022 and Forecast 2023 to 2033, By Country 15.1. Historical Market Size Value (US$ Million) & Volume (MT) Trend Analysis By Market Taxonomy, 2018 to 2022 15.2. Market Size Value (US$ Million) & Volume (MT) Forecast By Market Taxonomy, 2023 to 2033 15.2.1. By Country 15.2.1.1. GCC Countries 15.2.1.2. South Africa 15.2.1.3. Israel 15.2.1.4. Rest of MEA 15.2.2. By Application 15.2.3. By Product Type 15.2.4. By Distribution Channel 15.3. Market Attractiveness Analysis 15.3.1. By Country 15.3.2. By Application 15.3.3. By Product Type 15.3.4. By Distribution Channel 15.4. Key Takeaways 16. Key Countries Market Analysis 16.1. USA 16.1.1. Pricing Analysis 16.1.2. Market Share Analysis, 2022 16.1.2.1. By Application 16.1.2.2. By Product Type 16.1.2.3. By Distribution Channel 16.2. Canada 16.2.1. Pricing Analysis 16.2.2. Market Share Analysis, 2022 16.2.2.1. By Application 16.2.2.2. By Product Type 16.2.2.3. By Distribution Channel 16.3. Brazil 16.3.1. Pricing Analysis 16.3.2. Market Share Analysis, 2022 16.3.2.1. By Application 16.3.2.2. By Product Type 16.3.2.3. By Distribution Channel 16.4. Mexico 16.4.1. Pricing Analysis 16.4.2. Market Share Analysis, 2022 16.4.2.1. By Application 16.4.2.2. By Product Type 16.4.2.3. By Distribution Channel 16.5. Germany 16.5.1. Pricing Analysis 16.5.2. Market Share Analysis, 2022 16.5.2.1. By Application 16.5.2.2. By Product Type 16.5.2.3. By Distribution Channel 16.6. United Kingdom 16.6.1. Pricing Analysis 16.6.2. Market Share Analysis, 2022 16.6.2.1. By Application 16.6.2.2. By Product Type 16.6.2.3. By Distribution Channel 16.7. France 16.7.1. Pricing Analysis 16.7.2. Market Share Analysis, 2022 16.7.2.1. By Application 16.7.2.2. By Product Type 16.7.2.3. By Distribution Channel 16.8. Spain 16.8.1. Pricing Analysis 16.8.2. Market Share Analysis, 2022 16.8.2.1. By Application 16.8.2.2. By Product Type 16.8.2.3. By Distribution Channel 16.9. Italy 16.9.1. Pricing Analysis 16.9.2. Market Share Analysis, 2022 16.9.2.1. By Application 16.9.2.2. By Product Type 16.9.2.3. By Distribution Channel 16.10. Poland 16.10.1. Pricing Analysis 16.10.2. Market Share Analysis, 2022 16.10.2.1. By Application 16.10.2.2. By Product Type 16.10.2.3. By Distribution Channel 16.11. Russia 16.11.1. Pricing Analysis 16.11.2. Market Share Analysis, 2022 16.11.2.1. By Application 16.11.2.2. By Product Type 16.11.2.3. By Distribution Channel 16.12. Czech Republic 16.12.1. Pricing Analysis 16.12.2. Market Share Analysis, 2022 16.12.2.1. By Application 16.12.2.2. By Product Type 16.12.2.3. By Distribution Channel 16.13. Romania 16.13.1. Pricing Analysis 16.13.2. Market Share Analysis, 2022 16.13.2.1. By Application 16.13.2.2. By Product Type 16.13.2.3. By Distribution Channel 16.14. India 16.14.1. Pricing Analysis 16.14.2. Market Share Analysis, 2022 16.14.2.1. By Application 16.14.2.2. By Product Type 16.14.2.3. By Distribution Channel 16.15. Bangladesh 16.15.1. Pricing Analysis 16.15.2. Market Share Analysis, 2022 16.15.2.1. By Application 16.15.2.2. By Product Type 16.15.2.3. By Distribution Channel 16.16. Australia 16.16.1. Pricing Analysis 16.16.2. Market Share Analysis, 2022 16.16.2.1. By Application 16.16.2.2. By Product Type 16.16.2.3. By Distribution Channel 16.17. New Zealand 16.17.1. Pricing Analysis 16.17.2. Market Share Analysis, 2022 16.17.2.1. By Application 16.17.2.2. By Product Type 16.17.2.3. By Distribution Channel 16.18. China 16.18.1. Pricing Analysis 16.18.2. Market Share Analysis, 2022 16.18.2.1. By Application 16.18.2.2. By Product Type 16.18.2.3. By Distribution Channel 16.19. Japan 16.19.1. Pricing Analysis 16.19.2. Market Share Analysis, 2022 16.19.2.1. By Application 16.19.2.2. By Product Type 16.19.2.3. By Distribution Channel 16.20. South Korea 16.20.1. Pricing Analysis 16.20.2. Market Share Analysis, 2022 16.20.2.1. By Application 16.20.2.2. By Product Type 16.20.2.3. By Distribution Channel 16.21. GCC Countries 16.21.1. Pricing Analysis 16.21.2. Market Share Analysis, 2022 16.21.2.1. By Application 16.21.2.2. By Product Type 16.21.2.3. By Distribution Channel 16.22. South Africa 16.22.1. Pricing Analysis 16.22.2. Market Share Analysis, 2022 16.22.2.1. By Application 16.22.2.2. By Product Type 16.22.2.3. By Distribution Channel 16.23. Israel 16.23.1. Pricing Analysis 16.23.2. Market Share Analysis, 2022 16.23.2.1. By Application 16.23.2.2. By Product Type 16.23.2.3. By Distribution Channel 17. Market Structure Analysis 17.1. Competition Dashboard 17.2. Competition Benchmarking 17.3. Market Share Analysis of Top Players 17.3.1. By Regional 17.3.2. By Application 17.3.3. By Product Type 17.3.4. By Distribution Channel 18. Competition Analysis 18.1. Competition Deep Dive 18.1.1. Richardson International 18.1.1.1. Overview 18.1.1.2. Product Portfolio 18.1.1.3. Profitability by Market Segments 18.1.1.4. Sales Footprint 18.1.1.5. Strategy Overview 18.1.1.5.1. Marketing Strategy 18.1.1.5.2. Product Strategy 18.1.1.5.3. Channel Strategy 18.1.2. Quaker Oats Company 18.1.2.1. Overview 18.1.2.2. Product Portfolio 18.1.2.3. Profitability by Market Segments 18.1.2.4. Sales Footprint 18.1.2.5. Strategy Overview 18.1.2.5.1. Marketing Strategy 18.1.2.5.2. Product Strategy 18.1.2.5.3. Channel Strategy 18.1.3. Avena Foods 18.1.3.1. Overview 18.1.3.2. Product Portfolio 18.1.3.3. Profitability by Market Segments 18.1.3.4. Sales Footprint 18.1.3.5. Strategy Overview 18.1.3.5.1. Marketing Strategy 18.1.3.5.2. Product Strategy 18.1.3.5.3. Channel Strategy 18.1.4. Grain Millers, Inc. 18.1.4.1. Overview 18.1.4.2. Product Portfolio 18.1.4.3. Profitability by Market Segments 18.1.4.4. Sales Footprint 18.1.4.5. Strategy Overview 18.1.4.5.1. Marketing Strategy 18.1.4.5.2. Product Strategy 18.1.4.5.3. Channel Strategy 18.1.5. Bob’s Red Mill Natural Foods 18.1.5.1. Overview 18.1.5.2. Product Portfolio 18.1.5.3. Profitability by Market Segments 18.1.5.4. Sales Footprint 18.1.5.5. Strategy Overview 18.1.5.5.1. Marketing Strategy 18.1.5.5.2. Product Strategy 18.1.5.5.3. Channel Strategy 18.1.6. Fazer Mills 18.1.6.1. Overview 18.1.6.2. Product Portfolio 18.1.6.3. Profitability by Market Segments 18.1.6.4. Sales Footprint 18.1.6.5. Strategy Overview 18.1.6.5.1. Marketing Strategy 18.1.6.5.2. Product Strategy 18.1.6.5.3. Channel Strategy 18.1.7. Helsinki Mills Ltd. 18.1.7.1. Overview 18.1.7.2. Product Portfolio 18.1.7.3. Profitability by Market Segments 18.1.7.4. Sales Footprint 18.1.7.5. Strategy Overview 18.1.7.5.1. Marketing Strategy 18.1.7.5.2. Product Strategy 18.1.7.5.3. Channel Strategy 18.1.8. Ceres Organics 18.1.8.1. Overview 18.1.8.2. Product Portfolio 18.1.8.3. Profitability by Market Segments 18.1.8.4. Sales Footprint 18.1.8.5. Strategy Overview 18.1.8.5.1. Marketing Strategy 18.1.8.5.2. Product Strategy 18.1.8.5.3. Channel Strategy 18.1.9. Kialla Pure Foods 18.1.9.1. Overview 18.1.9.2. Product Portfolio 18.1.9.3. Profitability by Market Segments 18.1.9.4. Sales Footprint 18.1.9.5. Strategy Overview 18.1.9.5.1. Marketing Strategy 18.1.9.5.2. Product Strategy 18.1.9.5.3. Channel Strategy 18.1.10. NOW Foods 18.1.10.1. Overview 18.1.10.2. Product Portfolio 18.1.10.3. Profitability by Market Segments 18.1.10.4. Sales Footprint 18.1.10.5. Strategy Overview 18.1.10.5.1. Marketing Strategy 18.1.10.5.2. Product Strategy 18.1.10.5.3. Channel Strategy 18.1.11. Dutch Organic International Trade 18.1.11.1. Overview 18.1.11.2. Product Portfolio 18.1.11.3. Profitability by Market Segments 18.1.11.4. Sales Footprint 18.1.11.5. Strategy Overview 18.1.11.5.1. Marketing Strategy 18.1.11.5.2. Product Strategy 18.1.11.5.3. Channel Strategy 18.1.12. Nature's Path Foods 18.1.12.1. Overview 18.1.12.2. Product Portfolio 18.1.12.3. Profitability by Market Segments 18.1.12.4. Sales Footprint 18.1.12.5. Strategy Overview 18.1.12.5.1. Marketing Strategy 18.1.12.5.2. Product Strategy 18.1.12.5.3. Channel Strategy 18.1.13. Dancourt 18.1.13.1. Overview 18.1.13.2. Product Portfolio 18.1.13.3. Profitability by Market Segments 18.1.13.4. Sales Footprint 18.1.13.5. Strategy Overview 18.1.13.5.1. Marketing Strategy 18.1.13.5.2. Product Strategy 18.1.13.5.3. Channel Strategy 18.1.14. Saaten-Union GmbH 18.1.14.1. Overview 18.1.14.2. Product Portfolio 18.1.14.3. Profitability by Market Segments 18.1.14.4. Sales Footprint 18.1.14.5. Strategy Overview 18.1.14.5.1. Marketing Strategy 18.1.14.5.2. Product Strategy 18.1.14.5.3. Channel Strategy 18.1.15. Swedish Oat Fiber AB 18.1.15.1. Overview 18.1.15.2. Product Portfolio 18.1.15.3. Profitability by Market Segments 18.1.15.4. Sales Footprint 18.1.15.5. Strategy Overview 18.1.15.5.1. Marketing Strategy 18.1.15.5.2. Product Strategy 18.1.15.5.3. Channel Strategy 18.1.16. Arrowhead Mills 18.1.16.1. Overview 18.1.16.2. Product Portfolio 18.1.16.3. Profitability by Market Segments 18.1.16.4. Sales Footprint 18.1.16.5. Strategy Overview 18.1.16.5.1. Marketing Strategy 18.1.16.5.2. Product Strategy 18.1.16.5.3. Channel Strategy 18.1.17. Flahavan's 18.1.17.1. Overview 18.1.17.2. Product Portfolio 18.1.17.3. Profitability by Market Segments 18.1.17.4. Sales Footprint 18.1.17.5. Strategy Overview 18.1.17.5.1. Marketing Strategy 18.1.17.5.2. Product Strategy 18.1.17.5.3. Channel Strategy 18.1.18. McCabe 18.1.18.1. Overview 18.1.18.2. Product Portfolio 18.1.18.3. Profitability by Market Segments 18.1.18.4. Sales Footprint 18.1.18.5. Strategy Overview 18.1.18.5.1. Marketing Strategy 18.1.18.5.2. Product Strategy 18.1.18.5.3. Channel Strategy 18.1.19. Royal Lee Organic 18.1.19.1. Overview 18.1.19.2. Product Portfolio 18.1.19.3. Profitability by Market Segments 18.1.19.4. Sales Footprint 18.1.19.5. Strategy Overview 18.1.19.5.1. Marketing Strategy 18.1.19.5.2. Product Strategy 18.1.19.5.3. Channel Strategy 18.1.20. Better Oats 18.1.20.1. Overview 18.1.20.2. Product Portfolio 18.1.20.3. Profitability by Market Segments 18.1.20.4. Sales Footprint 18.1.20.5. Strategy Overview 18.1.20.5.1. Marketing Strategy 18.1.20.5.2. Product Strategy 18.1.20.5.3. Channel Strategy 19. Assumptions & Acronyms Used 20. Research Methodology
Explore Food and Beverage Insights
View Reports