Organic Drinks Market Size and Share Forecast Outlook 2025 to 2035

The Organic Drinks Market is estimated to be valued at USD 23.6 billion in 2025 and is projected to reach USD 32.9 billion by 2035, registering a compound annual growth rate (CAGR) of 3.4% over the forecast period.
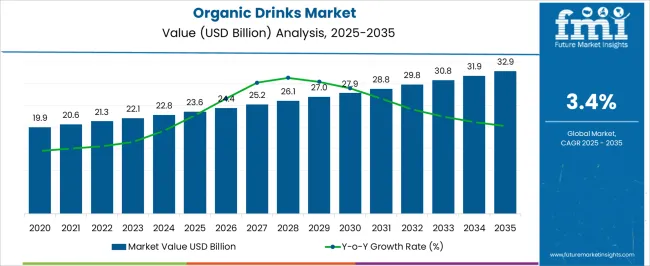
Quick Stats for Organic Drinks Market

  • Organic Drinks Market Value (2025): USD 23.6 billion
  • Organic Drinks Market Forecast Value (2035): USD 32.9 billion
  • Organic Drinks Market Forecast CAGR: 3.4%
  • Leading Segment in Organic Drinks Market in 2025: Soft Drinks (38.2%)
  • Key Growth Regions in Organic Drinks Market: North America, Asia-Pacific, Europe
  • Top Key Players in Organic Drinks Market: Anheuser-Busch InBev, Nestlé SA, PepsiCo Inc., Danone SA, Whitewave Foods Company, Drake's Organic Spirits LLC, PS Organic, LLC, James White Drinks, Organic Valley, Bison Organic Beer, Lacorata Beverage LLC., SYSTM Foods Inc.

Organic Drinks Market Market Value Analysis

Organic Drinks Market Key Takeaways

Metric Value
Organic Drinks Market Estimated Value in (2025 E) USD 23.6 billion
Organic Drinks Market Forecast Value in (2035 F) USD 32.9 billion
Forecast CAGR (2025 to 2035) 3.4%

Why is the Organic Drinks Market Growing?

The organic drinks market is witnessing rapid expansion as consumer preferences shift toward healthier, sustainable, and environmentally responsible beverage choices. Growing awareness of the harmful effects of artificial additives, preservatives, and chemical-based farming practices has driven demand for beverages made from certified organic ingredients. The market is also benefiting from rising disposable incomes, lifestyle changes, and the growing trend of preventive healthcare, which is encouraging consumers to choose drinks that provide functional benefits alongside refreshment.

Investments in innovative processing technologies, transparent labeling, and eco-friendly packaging solutions are further shaping the competitive landscape. The entry of mainstream beverage companies into the organic drinks space, coupled with increasing retail penetration across supermarkets, health stores, and online channels, is expanding product accessibility.

Government regulations promoting organic farming and consumer trust in certifications are providing additional momentum As sustainability becomes a key decision-making factor, the market is expected to maintain strong growth, with producers focusing on new formulations, flavor diversity, and enhanced shelf-life solutions to meet the evolving needs of global consumers.

Segmental Analysis

The organic drinks market is segmented by type, source, technology, sales channel, and geographic regions. By type, organic drinks market is divided into Soft Drinks, Hot Drinks, Organic Tea, Organic Coffee, and Others. In terms of source, organic drinks market is classified into Organic Fruits and Organic Vegetables. Based on technology, organic drinks market is segmented into High-Pressure Processing and Pulse Electric Field Treatment. By sales channel, organic drinks market is segmented into Retailers, Online Retailers, Wholesalers, and Distributors. Regionally, the organic drinks industry is classified into North America, Latin America, Western Europe, Eastern Europe, Balkan & Baltic Countries, Russia & Belarus, Central Asia, East Asia, South Asia & Pacific, and the Middle East & Africa.
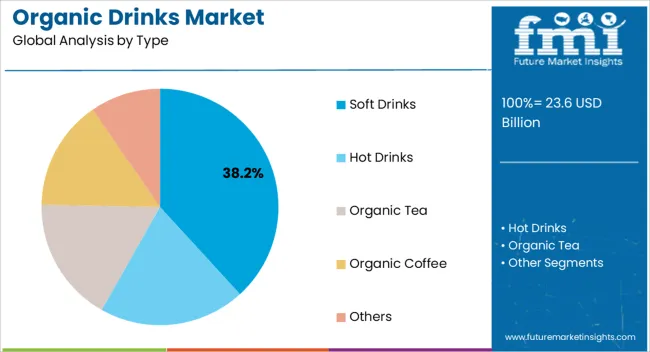
Insights into the Soft Drinks Type Segment

Organic Drinks Market Analysis By Type

The soft drinks segment is projected to hold 38.2% of the organic drinks market revenue share in 2025, making it the leading type category. This leadership is being driven by the widespread consumer appeal of soft drinks, combined with the growing demand for healthier alternatives free from synthetic additives and artificial sweeteners. Organic soft drinks are benefiting from their ability to provide familiar flavors and refreshment while aligning with clean-label trends.

Rising demand for carbonated organic beverages, flavored waters, and fruit-based sodas is further strengthening the segment’s presence across multiple demographics, particularly among younger consumers seeking natural and innovative beverage options. The segment’s accessibility through mainstream retail outlets and online platforms has widened its adoption globally.

In addition, manufacturers are investing in premium organic formulations, reduced sugar content, and natural flavor infusions to attract health-conscious consumers The ability to balance indulgence with nutritional benefits is reinforcing the dominance of organic soft drinks, ensuring they remain the most influential product type within the market.
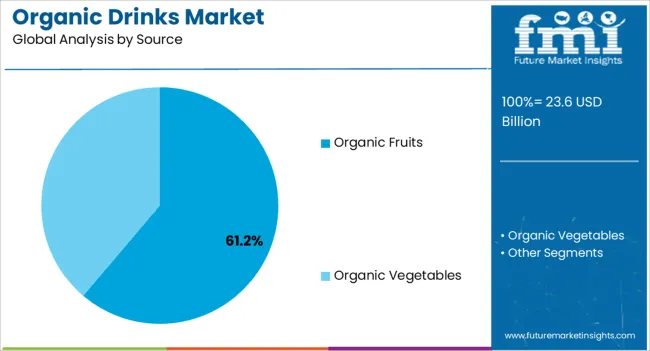
Insights into the Organic Fruits Source Segment

Organic Drinks Market Analysis By Source

The organic fruits source segment is expected to account for 61.2% of the organic drinks market revenue share in 2025, establishing it as the leading source category. Its leadership is being attributed to strong consumer trust in fruit-based beverages, which are widely associated with naturalness, nutrition, and functional health benefits. Increasing global availability of certified organic fruits, combined with advancements in supply chain management and cold storage, is enabling consistent production of high-quality fruit-based drinks.

Demand is also being reinforced by the growing popularity of juices, smoothies, and functional beverages that highlight organic fruits as a core ingredient. The segment’s strength lies in its alignment with consumer perceptions of wellness, offering vitamins, minerals, and antioxidants in a natural format.

Additionally, fruit-based drinks allow manufacturers to diversify flavors and formulations, creating differentiation in a competitive market As demand for clean-label, nutrient-rich beverages continues to rise, the organic fruits source segment is expected to remain the most significant contributor to overall market growth.
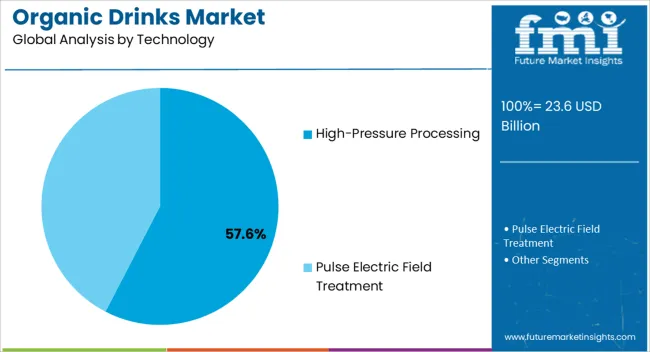
Insights into the High-Pressure Processing Technology Segment

Organic Drinks Market Analysis By Technology

The high-pressure processing technology segment is projected to hold 57.6% of the organic drinks market revenue share in 2025, making it the leading technology category. Its leadership is being reinforced by the ability to extend shelf life while preserving the nutritional integrity, flavor, and freshness of organic drinks. Unlike traditional thermal processing, high-pressure processing ensures that the natural qualities of fruits and vegetables remain intact, appealing to consumers seeking minimally processed beverages.

The growing adoption of this technology by beverage manufacturers is being driven by rising demand for clean-label products with no artificial preservatives. It also enables global distribution without compromising product quality, which is critical for expanding into new markets.

The technology’s capacity to support diverse product formats, including juices, smoothies, and flavored waters, adds further growth potential As consumers prioritize safety, freshness, and authenticity in their drink choices, high-pressure processing is expected to remain the dominant technology, providing a strong competitive advantage to producers in the organic drinks market.

Market Overview

Organically grown foods are food straight from a plant that has not undergone inorganic procedures, like pesticides, fertilizers, or insecticides.

This serves to demonstrate that some food products are entirely organic, while others are. High-pressure processing methods, no thermal preservation, and sterilizing processes are used to preserve organic beverages. This method aids in the preservation of the vitamins, minerals, and enzymes included in organic beverages. Additionally, it aids in extending shelf life. Coffee is often served hot, although organic drinks like juice can be served both hot and cold.
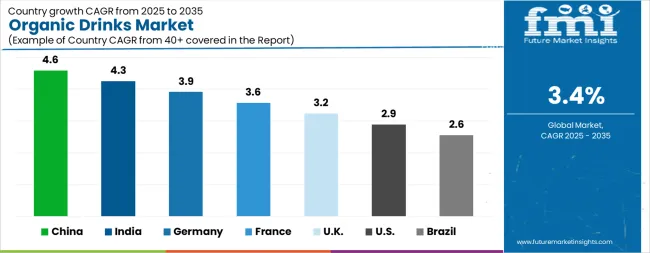
Analysis of Organic Drinks Market By Key Countries

Organic Drinks Market Cagr Analysis By Country

Country CAGR
China 4.6%
India 4.3%
Germany 3.9%
France 3.6%
UK 3.2%
USA 2.9%
Brazil 2.6%

Country-wise Analysis

The Organic Drinks Market is expected to register a CAGR of 3.4% during the forecast period, exhibiting varied country level momentum. China leads with the highest CAGR of 4.6%, followed by India at 4.3%. Developed markets such as Germany, France, and the UK continue to expand steadily, while the USA is likely to grow at consistent rates. Brazil posts the lowest CAGR at 2.6%, yet still underscores a broadly positive trajectory for the global Organic Drinks Market. In 2024, Germany held a dominant revenue in the Western Europe market and is expected to grow with a CAGR of 3.9%. The USA Organic Drinks Market is estimated to be valued at USD 8.6 billion in 2025 and is anticipated to reach a valuation of USD 11.5 billion by 2035. Sales are projected to rise at a CAGR of 2.9% over the forecast period between 2025 and 2035. While Japan and South Korea markets are estimated to be valued at USD 1.1 billion and USD 652.7 million respectively in 2025.
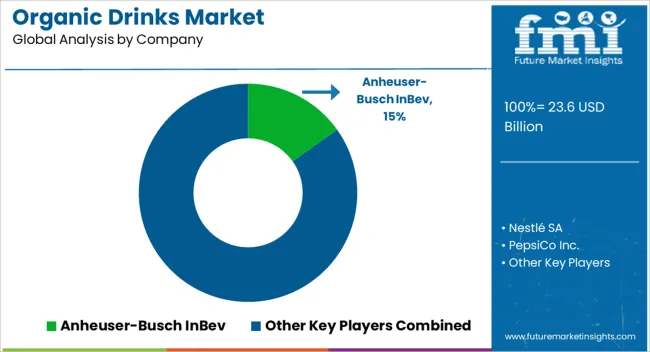
Key Players in the Organic Drinks Market

Organic Drinks Market Analysis By Company

  • Anheuser-Busch InBev
  • Nestlé SA
  • PepsiCo Inc.
  • Danone SA
  • Whitewave Foods Company
  • Drake's Organic Spirits LLC
  • PS Organic, LLC
  • James White Drinks
  • Organic Valley
  • Bison Organic Beer
  • Lacorata Beverage LLC.
  • SYSTM Foods Inc.

Scope of the Report

Item Value
Quantitative Units USD 23.6 Billion
Type Soft Drinks, Hot Drinks, Organic Tea, Organic Coffee, and Others
Source Organic Fruits and Organic Vegetables
Technology High-Pressure Processing and Pulse Electric Field Treatment
Sales Channel Retailers, Online Retailers, Wholesalers, and Distributors
Regions Covered North America, Europe, Asia-Pacific, Latin America, Middle East & Africa
Country Covered United States, Canada, Germany, France, United Kingdom, China, Japan, India, Brazil, South Africa
Key Companies Profiled Anheuser-Busch InBev, Nestlé SA, PepsiCo Inc., Danone SA, Whitewave Foods Company, Drake's Organic Spirits LLC, PS Organic, LLC, James White Drinks, Organic Valley, Bison Organic Beer, Lacorata Beverage LLC., and SYSTM Foods Inc.

Organic Drinks Market by Segments

Type:

  • Soft Drinks
  • Hot Drinks
  • Organic Tea
  • Organic Coffee
  • Others

Source:

  • Organic Fruits
  • Organic Vegetables

Technology:

  • High-Pressure Processing
  • Pulse Electric Field Treatment

Sales Channel:

  • Retailers
  • Online Retailers
  • Wholesalers
  • Distributors

Region:

  • North America
    • USA
    • Canada
    • Mexico
  • Latin America
    • Brazil
    • Chile
    • Rest of Latin America
  • Western Europe
    • Germany
    • UK
    • Italy
    • Spain
    • France
    • Nordic
    • BENELUX
    • Rest of Western Europe
  • Eastern Europe
    • Russia
    • Poland
    • Hungary
    • Balkan & Baltic
    • Rest of Eastern Europe
  • East Asia
    • China
    • Japan
    • South Korea
  • South Asia and Pacific
    • India
    • ASEAN
    • Australia & New Zealand
    • Rest of South Asia and Pacific
  • Middle East & Africa
    • Kingdom of Saudi Arabia
    • Other GCC Countries
    • Turkiye
    • South Africa
    • Other African Union
    • Rest of Middle East & Africa

Table of Content

  1. Executive Summary
    • Global Market Outlook
    • Demand-side Trends
    • Supply-side Trends
    • Technology Roadmap Analysis
    • Analysis and Recommendations
  2. Market Overview
    • Market Coverage / Taxonomy
    • Market Definition / Scope / Limitations
  3. Market Background
    • Market Dynamics
      • Drivers
      • Restraints
      • Opportunity
      • Trends
    • Scenario Forecast
      • Demand in Optimistic Scenario
      • Demand in Likely Scenario
      • Demand in Conservative Scenario
    • Opportunity Map Analysis
    • Product Life Cycle Analysis
    • Supply Chain Analysis
    • Investment Feasibility Matrix
    • Value Chain Analysis
    • PESTLE and Porter’s Analysis
    • Regulatory Landscape
    • Regional Parent Market Outlook
    • Production and Consumption Statistics
    • Import and Export Statistics
  4. Global Market Analysis 2020 to 2024 and Forecast, 2025 to 2035
    • Historical Market Size Value (USD Million) Analysis, 2020 to 2024
    • Current and Future Market Size Value (USD Million) Projections, 2025 to 2035
      • Y-o-Y Growth Trend Analysis
      • Absolute $ Opportunity Analysis
  5. Global Market Pricing Analysis 2020 to 2024 and Forecast 2025 to 2035
  6. Global Market Analysis 2020 to 2024 and Forecast 2025 to 2035, By Type
    • Introduction / Key Findings
    • Historical Market Size Value (USD Million) Analysis By Type , 2020 to 2024
    • Current and Future Market Size Value (USD Million) Analysis and Forecast By Type , 2025 to 2035
      • Soft Drinks
      • Hot Drinks
      • Organic Tea
      • Organic Coffee
      • Others
    • Y-o-Y Growth Trend Analysis By Type , 2020 to 2024
    • Absolute $ Opportunity Analysis By Type , 2025 to 2035
  7. Global Market Analysis 2020 to 2024 and Forecast 2025 to 2035, By Source
    • Introduction / Key Findings
    • Historical Market Size Value (USD Million) Analysis By Source, 2020 to 2024
    • Current and Future Market Size Value (USD Million) Analysis and Forecast By Source, 2025 to 2035
      • Organic Fruits
      • Organic Vegetables
    • Y-o-Y Growth Trend Analysis By Source, 2020 to 2024
    • Absolute $ Opportunity Analysis By Source, 2025 to 2035
  8. Global Market Analysis 2020 to 2024 and Forecast 2025 to 2035, By Technology
    • Introduction / Key Findings
    • Historical Market Size Value (USD Million) Analysis By Technology, 2020 to 2024
    • Current and Future Market Size Value (USD Million) Analysis and Forecast By Technology, 2025 to 2035
      • High-Pressure Processing
      • Pulse Electric Field Treatment
    • Y-o-Y Growth Trend Analysis By Technology, 2020 to 2024
    • Absolute $ Opportunity Analysis By Technology, 2025 to 2035
  9. Global Market Analysis 2020 to 2024 and Forecast 2025 to 2035, By Sales Channel
    • Introduction / Key Findings
    • Historical Market Size Value (USD Million) Analysis By Sales Channel, 2020 to 2024
    • Current and Future Market Size Value (USD Million) Analysis and Forecast By Sales Channel, 2025 to 2035
      • Retailers
      • Online Retailers
      • Wholesalers
      • Distributors
    • Y-o-Y Growth Trend Analysis By Sales Channel, 2020 to 2024
    • Absolute $ Opportunity Analysis By Sales Channel, 2025 to 2035
  10. Global Market Analysis 2020 to 2024 and Forecast 2025 to 2035, By Region
    • Introduction
    • Historical Market Size Value (USD Million) Analysis By Region, 2020 to 2024
    • Current Market Size Value (USD Million) Analysis and Forecast By Region, 2025 to 2035
      • North America
      • Latin America
      • Western Europe
      • Eastern Europe
      • East Asia
      • South Asia and Pacific
      • Middle East & Africa
    • Market Attractiveness Analysis By Region
  11. North America Market Analysis 2020 to 2024 and Forecast 2025 to 2035, By Country
    • Historical Market Size Value (USD Million) Trend Analysis By Market Taxonomy, 2020 to 2024
    • Market Size Value (USD Million) Forecast By Market Taxonomy, 2025 to 2035
      • By Country
        • USA
        • Canada
        • Mexico
      • By Type
      • By Source
      • By Technology
      • By Sales Channel
    • Market Attractiveness Analysis
      • By Country
      • By Type
      • By Source
      • By Technology
      • By Sales Channel
    • Key Takeaways
  12. Latin America Market Analysis 2020 to 2024 and Forecast 2025 to 2035, By Country
    • Historical Market Size Value (USD Million) Trend Analysis By Market Taxonomy, 2020 to 2024
    • Market Size Value (USD Million) Forecast By Market Taxonomy, 2025 to 2035
      • By Country
        • Brazil
        • Chile
        • Rest of Latin America
      • By Type
      • By Source
      • By Technology
      • By Sales Channel
    • Market Attractiveness Analysis
      • By Country
      • By Type
      • By Source
      • By Technology
      • By Sales Channel
    • Key Takeaways
  13. Western Europe Market Analysis 2020 to 2024 and Forecast 2025 to 2035, By Country
    • Historical Market Size Value (USD Million) Trend Analysis By Market Taxonomy, 2020 to 2024
    • Market Size Value (USD Million) Forecast By Market Taxonomy, 2025 to 2035
      • By Country
        • Germany
        • UK
        • Italy
        • Spain
        • France
        • Nordic
        • BENELUX
        • Rest of Western Europe
      • By Type
      • By Source
      • By Technology
      • By Sales Channel
    • Market Attractiveness Analysis
      • By Country
      • By Type
      • By Source
      • By Technology
      • By Sales Channel
    • Key Takeaways
  14. Eastern Europe Market Analysis 2020 to 2024 and Forecast 2025 to 2035, By Country
    • Historical Market Size Value (USD Million) Trend Analysis By Market Taxonomy, 2020 to 2024
    • Market Size Value (USD Million) Forecast By Market Taxonomy, 2025 to 2035
      • By Country
        • Russia
        • Poland
        • Hungary
        • Balkan & Baltic
        • Rest of Eastern Europe
      • By Type
      • By Source
      • By Technology
      • By Sales Channel
    • Market Attractiveness Analysis
      • By Country
      • By Type
      • By Source
      • By Technology
      • By Sales Channel
    • Key Takeaways
  15. East Asia Market Analysis 2020 to 2024 and Forecast 2025 to 2035, By Country
    • Historical Market Size Value (USD Million) Trend Analysis By Market Taxonomy, 2020 to 2024
    • Market Size Value (USD Million) Forecast By Market Taxonomy, 2025 to 2035
      • By Country
        • China
        • Japan
        • South Korea
      • By Type
      • By Source
      • By Technology
      • By Sales Channel
    • Market Attractiveness Analysis
      • By Country
      • By Type
      • By Source
      • By Technology
      • By Sales Channel
    • Key Takeaways
  16. South Asia and Pacific Market Analysis 2020 to 2024 and Forecast 2025 to 2035, By Country
    • Historical Market Size Value (USD Million) Trend Analysis By Market Taxonomy, 2020 to 2024
    • Market Size Value (USD Million) Forecast By Market Taxonomy, 2025 to 2035
      • By Country
        • India
        • ASEAN
        • Australia & New Zealand
        • Rest of South Asia and Pacific
      • By Type
      • By Source
      • By Technology
      • By Sales Channel
    • Market Attractiveness Analysis
      • By Country
      • By Type
      • By Source
      • By Technology
      • By Sales Channel
    • Key Takeaways
  17. Middle East & Africa Market Analysis 2020 to 2024 and Forecast 2025 to 2035, By Country
    • Historical Market Size Value (USD Million) Trend Analysis By Market Taxonomy, 2020 to 2024
    • Market Size Value (USD Million) Forecast By Market Taxonomy, 2025 to 2035
      • By Country
        • Kingdom of Saudi Arabia
        • Other GCC Countries
        • Turkiye
        • South Africa
        • Other African Union
        • Rest of Middle East & Africa
      • By Type
      • By Source
      • By Technology
      • By Sales Channel
    • Market Attractiveness Analysis
      • By Country
      • By Type
      • By Source
      • By Technology
      • By Sales Channel
    • Key Takeaways
  18. Key Countries Market Analysis
    • USA
      • Pricing Analysis
      • Market Share Analysis, 2024
        • By Type
        • By Source
        • By Technology
        • By Sales Channel
    • Canada
      • Pricing Analysis
      • Market Share Analysis, 2024
        • By Type
        • By Source
        • By Technology
        • By Sales Channel
    • Mexico
      • Pricing Analysis
      • Market Share Analysis, 2024
        • By Type
        • By Source
        • By Technology
        • By Sales Channel
    • Brazil
      • Pricing Analysis
      • Market Share Analysis, 2024
        • By Type
        • By Source
        • By Technology
        • By Sales Channel
    • Chile
      • Pricing Analysis
      • Market Share Analysis, 2024
        • By Type
        • By Source
        • By Technology
        • By Sales Channel
    • Germany
      • Pricing Analysis
      • Market Share Analysis, 2024
        • By Type
        • By Source
        • By Technology
        • By Sales Channel
    • UK
      • Pricing Analysis
      • Market Share Analysis, 2024
        • By Type
        • By Source
        • By Technology
        • By Sales Channel
    • Italy
      • Pricing Analysis
      • Market Share Analysis, 2024
        • By Type
        • By Source
        • By Technology
        • By Sales Channel
    • Spain
      • Pricing Analysis
      • Market Share Analysis, 2024
        • By Type
        • By Source
        • By Technology
        • By Sales Channel
    • France
      • Pricing Analysis
      • Market Share Analysis, 2024
        • By Type
        • By Source
        • By Technology
        • By Sales Channel
    • India
      • Pricing Analysis
      • Market Share Analysis, 2024
        • By Type
        • By Source
        • By Technology
        • By Sales Channel
    • ASEAN
      • Pricing Analysis
      • Market Share Analysis, 2024
        • By Type
        • By Source
        • By Technology
        • By Sales Channel
    • Australia & New Zealand
      • Pricing Analysis
      • Market Share Analysis, 2024
        • By Type
        • By Source
        • By Technology
        • By Sales Channel
    • China
      • Pricing Analysis
      • Market Share Analysis, 2024
        • By Type
        • By Source
        • By Technology
        • By Sales Channel
    • Japan
      • Pricing Analysis
      • Market Share Analysis, 2024
        • By Type
        • By Source
        • By Technology
        • By Sales Channel
    • South Korea
      • Pricing Analysis
      • Market Share Analysis, 2024
        • By Type
        • By Source
        • By Technology
        • By Sales Channel
    • Russia
      • Pricing Analysis
      • Market Share Analysis, 2024
        • By Type
        • By Source
        • By Technology
        • By Sales Channel
    • Poland
      • Pricing Analysis
      • Market Share Analysis, 2024
        • By Type
        • By Source
        • By Technology
        • By Sales Channel
    • Hungary
      • Pricing Analysis
      • Market Share Analysis, 2024
        • By Type
        • By Source
        • By Technology
        • By Sales Channel
    • Kingdom of Saudi Arabia
      • Pricing Analysis
      • Market Share Analysis, 2024
        • By Type
        • By Source
        • By Technology
        • By Sales Channel
    • Turkiye
      • Pricing Analysis
      • Market Share Analysis, 2024
        • By Type
        • By Source
        • By Technology
        • By Sales Channel
    • South Africa
      • Pricing Analysis
      • Market Share Analysis, 2024
        • By Type
        • By Source
        • By Technology
        • By Sales Channel
  19. Market Structure Analysis
    • Competition Dashboard
    • Competition Benchmarking
    • Market Share Analysis of Top Players
      • By Regional
      • By Type
      • By Source
      • By Technology
      • By Sales Channel
  20. Competition Analysis
    • Competition Deep Dive
      • Anheuser-Busch InBev
        • Overview
        • Product Portfolio
        • Profitability by Market Segments (Product/Age /Sales Channel/Region)
        • Sales Footprint
        • Strategy Overview
          • Marketing Strategy
          • Product Strategy
          • Channel Strategy
      • Nestlé SA
      • PepsiCo Inc.
      • Danone SA
      • Whitewave Foods Company
      • Drake's Organic Spirits LLC
      • PS Organic, LLC
      • James White Drinks
      • Organic Valley
      • Bison Organic Beer
      • Lacorata Beverage LLC.
      • SYSTM Foods Inc.
  21. Assumptions & Acronyms Used
  22. Research Methodology

List of Tables

  • Table 1: Global Market Value (USD Million) Forecast by Region, 2020-2035
  • Table 2: Global Market Value (USD Million) Forecast by Type , 2020-2035
  • Table 3: Global Market Value (USD Million) Forecast by Source, 2020-2035
  • Table 4: Global Market Value (USD Million) Forecast by Technology, 2020-2035
  • Table 5: Global Market Value (USD Million) Forecast by Sales Channel, 2020-2035
  • Table 6: North America Market Value (USD Million) Forecast by Country, 2020-2035
  • Table 7: North America Market Value (USD Million) Forecast by Type , 2020-2035
  • Table 8: North America Market Value (USD Million) Forecast by Source, 2020-2035
  • Table 9: North America Market Value (USD Million) Forecast by Technology, 2020-2035
  • Table 10: North America Market Value (USD Million) Forecast by Sales Channel, 2020-2035
  • Table 11: Latin America Market Value (USD Million) Forecast by Country, 2020-2035
  • Table 12: Latin America Market Value (USD Million) Forecast by Type , 2020-2035
  • Table 13: Latin America Market Value (USD Million) Forecast by Source, 2020-2035
  • Table 14: Latin America Market Value (USD Million) Forecast by Technology, 2020-2035
  • Table 15: Latin America Market Value (USD Million) Forecast by Sales Channel, 2020-2035
  • Table 16: Western Europe Market Value (USD Million) Forecast by Country, 2020-2035
  • Table 17: Western Europe Market Value (USD Million) Forecast by Type , 2020-2035
  • Table 18: Western Europe Market Value (USD Million) Forecast by Source, 2020-2035
  • Table 19: Western Europe Market Value (USD Million) Forecast by Technology, 2020-2035
  • Table 20: Western Europe Market Value (USD Million) Forecast by Sales Channel, 2020-2035
  • Table 21: Eastern Europe Market Value (USD Million) Forecast by Country, 2020-2035
  • Table 22: Eastern Europe Market Value (USD Million) Forecast by Type , 2020-2035
  • Table 23: Eastern Europe Market Value (USD Million) Forecast by Source, 2020-2035
  • Table 24: Eastern Europe Market Value (USD Million) Forecast by Technology, 2020-2035
  • Table 25: Eastern Europe Market Value (USD Million) Forecast by Sales Channel, 2020-2035
  • Table 26: East Asia Market Value (USD Million) Forecast by Country, 2020-2035
  • Table 27: East Asia Market Value (USD Million) Forecast by Type , 2020-2035
  • Table 28: East Asia Market Value (USD Million) Forecast by Source, 2020-2035
  • Table 29: East Asia Market Value (USD Million) Forecast by Technology, 2020-2035
  • Table 30: East Asia Market Value (USD Million) Forecast by Sales Channel, 2020-2035
  • Table 31: South Asia and Pacific Market Value (USD Million) Forecast by Country, 2020-2035
  • Table 32: South Asia and Pacific Market Value (USD Million) Forecast by Type , 2020-2035
  • Table 33: South Asia and Pacific Market Value (USD Million) Forecast by Source, 2020-2035
  • Table 34: South Asia and Pacific Market Value (USD Million) Forecast by Technology, 2020-2035
  • Table 35: South Asia and Pacific Market Value (USD Million) Forecast by Sales Channel, 2020-2035
  • Table 36: Middle East & Africa Market Value (USD Million) Forecast by Country, 2020-2035
  • Table 37: Middle East & Africa Market Value (USD Million) Forecast by Type , 2020-2035
  • Table 38: Middle East & Africa Market Value (USD Million) Forecast by Source, 2020-2035
  • Table 39: Middle East & Africa Market Value (USD Million) Forecast by Technology, 2020-2035
  • Table 40: Middle East & Africa Market Value (USD Million) Forecast by Sales Channel, 2020-2035

List of Figures

  • Figure 1: Global Market Pricing Analysis
  • Figure 2: Global Market Value (USD Million) Forecast 2020-2035
  • Figure 3: Global Market Value Share and BPS Analysis by Type , 2025 and 2035
  • Figure 4: Global Market Y-o-Y Growth Comparison by Type , 2025-2035
  • Figure 5: Global Market Attractiveness Analysis by Type
  • Figure 6: Global Market Value Share and BPS Analysis by Source, 2025 and 2035
  • Figure 7: Global Market Y-o-Y Growth Comparison by Source, 2025-2035
  • Figure 8: Global Market Attractiveness Analysis by Source
  • Figure 9: Global Market Value Share and BPS Analysis by Technology, 2025 and 2035
  • Figure 10: Global Market Y-o-Y Growth Comparison by Technology, 2025-2035
  • Figure 11: Global Market Attractiveness Analysis by Technology
  • Figure 12: Global Market Value Share and BPS Analysis by Sales Channel, 2025 and 2035
  • Figure 13: Global Market Y-o-Y Growth Comparison by Sales Channel, 2025-2035
  • Figure 14: Global Market Attractiveness Analysis by Sales Channel
  • Figure 15: Global Market Value (USD Million) Share and BPS Analysis by Region, 2025 and 2035
  • Figure 16: Global Market Y-o-Y Growth Comparison by Region, 2025-2035
  • Figure 17: Global Market Attractiveness Analysis by Region
  • Figure 18: North America Market Incremental Dollar Opportunity, 2025-2035
  • Figure 19: Latin America Market Incremental Dollar Opportunity, 2025-2035
  • Figure 20: Western Europe Market Incremental Dollar Opportunity, 2025-2035
  • Figure 21: Eastern Europe Market Incremental Dollar Opportunity, 2025-2035
  • Figure 22: East Asia Market Incremental Dollar Opportunity, 2025-2035
  • Figure 23: South Asia and Pacific Market Incremental Dollar Opportunity, 2025-2035
  • Figure 24: Middle East & Africa Market Incremental Dollar Opportunity, 2025-2035
  • Figure 25: North America Market Value Share and BPS Analysis by Country, 2025 and 2035
  • Figure 26: North America Market Value Share and BPS Analysis by Type , 2025 and 2035
  • Figure 27: North America Market Y-o-Y Growth Comparison by Type , 2025-2035
  • Figure 28: North America Market Attractiveness Analysis by Type
  • Figure 29: North America Market Value Share and BPS Analysis by Source, 2025 and 2035
  • Figure 30: North America Market Y-o-Y Growth Comparison by Source, 2025-2035
  • Figure 31: North America Market Attractiveness Analysis by Source
  • Figure 32: North America Market Value Share and BPS Analysis by Technology, 2025 and 2035
  • Figure 33: North America Market Y-o-Y Growth Comparison by Technology, 2025-2035
  • Figure 34: North America Market Attractiveness Analysis by Technology
  • Figure 35: North America Market Value Share and BPS Analysis by Sales Channel, 2025 and 2035
  • Figure 36: North America Market Y-o-Y Growth Comparison by Sales Channel, 2025-2035
  • Figure 37: North America Market Attractiveness Analysis by Sales Channel
  • Figure 38: Latin America Market Value Share and BPS Analysis by Country, 2025 and 2035
  • Figure 39: Latin America Market Value Share and BPS Analysis by Type , 2025 and 2035
  • Figure 40: Latin America Market Y-o-Y Growth Comparison by Type , 2025-2035
  • Figure 41: Latin America Market Attractiveness Analysis by Type
  • Figure 42: Latin America Market Value Share and BPS Analysis by Source, 2025 and 2035
  • Figure 43: Latin America Market Y-o-Y Growth Comparison by Source, 2025-2035
  • Figure 44: Latin America Market Attractiveness Analysis by Source
  • Figure 45: Latin America Market Value Share and BPS Analysis by Technology, 2025 and 2035
  • Figure 46: Latin America Market Y-o-Y Growth Comparison by Technology, 2025-2035
  • Figure 47: Latin America Market Attractiveness Analysis by Technology
  • Figure 48: Latin America Market Value Share and BPS Analysis by Sales Channel, 2025 and 2035
  • Figure 49: Latin America Market Y-o-Y Growth Comparison by Sales Channel, 2025-2035
  • Figure 50: Latin America Market Attractiveness Analysis by Sales Channel
  • Figure 51: Western Europe Market Value Share and BPS Analysis by Country, 2025 and 2035
  • Figure 52: Western Europe Market Value Share and BPS Analysis by Type , 2025 and 2035
  • Figure 53: Western Europe Market Y-o-Y Growth Comparison by Type , 2025-2035
  • Figure 54: Western Europe Market Attractiveness Analysis by Type
  • Figure 55: Western Europe Market Value Share and BPS Analysis by Source, 2025 and 2035
  • Figure 56: Western Europe Market Y-o-Y Growth Comparison by Source, 2025-2035
  • Figure 57: Western Europe Market Attractiveness Analysis by Source
  • Figure 58: Western Europe Market Value Share and BPS Analysis by Technology, 2025 and 2035
  • Figure 59: Western Europe Market Y-o-Y Growth Comparison by Technology, 2025-2035
  • Figure 60: Western Europe Market Attractiveness Analysis by Technology
  • Figure 61: Western Europe Market Value Share and BPS Analysis by Sales Channel, 2025 and 2035
  • Figure 62: Western Europe Market Y-o-Y Growth Comparison by Sales Channel, 2025-2035
  • Figure 63: Western Europe Market Attractiveness Analysis by Sales Channel
  • Figure 64: Eastern Europe Market Value Share and BPS Analysis by Country, 2025 and 2035
  • Figure 65: Eastern Europe Market Value Share and BPS Analysis by Type , 2025 and 2035
  • Figure 66: Eastern Europe Market Y-o-Y Growth Comparison by Type , 2025-2035
  • Figure 67: Eastern Europe Market Attractiveness Analysis by Type
  • Figure 68: Eastern Europe Market Value Share and BPS Analysis by Source, 2025 and 2035
  • Figure 69: Eastern Europe Market Y-o-Y Growth Comparison by Source, 2025-2035
  • Figure 70: Eastern Europe Market Attractiveness Analysis by Source
  • Figure 71: Eastern Europe Market Value Share and BPS Analysis by Technology, 2025 and 2035
  • Figure 72: Eastern Europe Market Y-o-Y Growth Comparison by Technology, 2025-2035
  • Figure 73: Eastern Europe Market Attractiveness Analysis by Technology
  • Figure 74: Eastern Europe Market Value Share and BPS Analysis by Sales Channel, 2025 and 2035
  • Figure 75: Eastern Europe Market Y-o-Y Growth Comparison by Sales Channel, 2025-2035
  • Figure 76: Eastern Europe Market Attractiveness Analysis by Sales Channel
  • Figure 77: East Asia Market Value Share and BPS Analysis by Country, 2025 and 2035
  • Figure 78: East Asia Market Value Share and BPS Analysis by Type , 2025 and 2035
  • Figure 79: East Asia Market Y-o-Y Growth Comparison by Type , 2025-2035
  • Figure 80: East Asia Market Attractiveness Analysis by Type
  • Figure 81: East Asia Market Value Share and BPS Analysis by Source, 2025 and 2035
  • Figure 82: East Asia Market Y-o-Y Growth Comparison by Source, 2025-2035
  • Figure 83: East Asia Market Attractiveness Analysis by Source
  • Figure 84: East Asia Market Value Share and BPS Analysis by Technology, 2025 and 2035
  • Figure 85: East Asia Market Y-o-Y Growth Comparison by Technology, 2025-2035
  • Figure 86: East Asia Market Attractiveness Analysis by Technology
  • Figure 87: East Asia Market Value Share and BPS Analysis by Sales Channel, 2025 and 2035
  • Figure 88: East Asia Market Y-o-Y Growth Comparison by Sales Channel, 2025-2035
  • Figure 89: East Asia Market Attractiveness Analysis by Sales Channel
  • Figure 90: South Asia and Pacific Market Value Share and BPS Analysis by Country, 2025 and 2035
  • Figure 91: South Asia and Pacific Market Value Share and BPS Analysis by Type , 2025 and 2035
  • Figure 92: South Asia and Pacific Market Y-o-Y Growth Comparison by Type , 2025-2035
  • Figure 93: South Asia and Pacific Market Attractiveness Analysis by Type
  • Figure 94: South Asia and Pacific Market Value Share and BPS Analysis by Source, 2025 and 2035
  • Figure 95: South Asia and Pacific Market Y-o-Y Growth Comparison by Source, 2025-2035
  • Figure 96: South Asia and Pacific Market Attractiveness Analysis by Source
  • Figure 97: South Asia and Pacific Market Value Share and BPS Analysis by Technology, 2025 and 2035
  • Figure 98: South Asia and Pacific Market Y-o-Y Growth Comparison by Technology, 2025-2035
  • Figure 99: South Asia and Pacific Market Attractiveness Analysis by Technology
  • Figure 100: South Asia and Pacific Market Value Share and BPS Analysis by Sales Channel, 2025 and 2035
  • Figure 101: South Asia and Pacific Market Y-o-Y Growth Comparison by Sales Channel, 2025-2035
  • Figure 102: South Asia and Pacific Market Attractiveness Analysis by Sales Channel
  • Figure 103: Middle East & Africa Market Value Share and BPS Analysis by Country, 2025 and 2035
  • Figure 104: Middle East & Africa Market Value Share and BPS Analysis by Type , 2025 and 2035
  • Figure 105: Middle East & Africa Market Y-o-Y Growth Comparison by Type , 2025-2035
  • Figure 106: Middle East & Africa Market Attractiveness Analysis by Type
  • Figure 107: Middle East & Africa Market Value Share and BPS Analysis by Source, 2025 and 2035
  • Figure 108: Middle East & Africa Market Y-o-Y Growth Comparison by Source, 2025-2035
  • Figure 109: Middle East & Africa Market Attractiveness Analysis by Source
  • Figure 110: Middle East & Africa Market Value Share and BPS Analysis by Technology, 2025 and 2035
  • Figure 111: Middle East & Africa Market Y-o-Y Growth Comparison by Technology, 2025-2035
  • Figure 112: Middle East & Africa Market Attractiveness Analysis by Technology
  • Figure 113: Middle East & Africa Market Value Share and BPS Analysis by Sales Channel, 2025 and 2035
  • Figure 114: Middle East & Africa Market Y-o-Y Growth Comparison by Sales Channel, 2025-2035
  • Figure 115: Middle East & Africa Market Attractiveness Analysis by Sales Channel
  • Figure 116: Global Market - Tier Structure Analysis
  • Figure 117: Global Market - Company Share Analysis

Frequently Asked Questions

How big is the organic drinks market in 2025?

The global organic drinks market is estimated to be valued at USD 23.6 billion in 2025.

What will be the size of organic drinks market in 2035?

The market size for the organic drinks market is projected to reach USD 32.9 billion by 2035.

How much will be the organic drinks market growth between 2025 and 2035?

The organic drinks market is expected to grow at a 3.4% CAGR between 2025 and 2035.

What are the key product types in the organic drinks market?

The key product types in organic drinks market are soft drinks, hot drinks, organic tea, organic coffee and others.

Which source segment to contribute significant share in the organic drinks market in 2025?

In terms of source, organic fruits segment to command 61.2% share in the organic drinks market in 2025.

Explore Similar Insights

Future Market Insights

Organic Drinks Market

Chat With

MaRIA

Hi There, I am MaRIA, Your Market Research Intelligence Assistant. How may I help you?