Reports

- Global Locations -

Headquarters

Future Market Insights, Inc.

Christiana Corporate, 200
Continental Drive, Suite 401,
Newark, Delaware - 19713,
United States

T: +1-845-579-5705

Americas

Future Market Insights, Inc.

616 Corporate Way, Suite 2-9018,
Valley Cottage, NY 10989, United States

T: +1-347-918-3531

MEA

Future Market Insights

1602-6 Jumeirah Bay X2 Tower, Plot No: JLT-PH2-X2A,
Jumeirah Lakes Towers, Dubai,
United Arab Emirates

Europe

Future Market Insights

3rd Floor, 207 Regent Street,
W1B 3HH London
United Kingdom

T: + 44 (0) 20 8123 9659
D: +44 (0) 20 3287 4268

Asia Pacific

Future Market Insights

IndiaLand Global Tech Park, Unit UG-1, Behind Grand HighStreet, Phase 1, Hinjawadi, MH, Pune – 411057, India

Cosmetic Implants Market Overview (2022-2032)

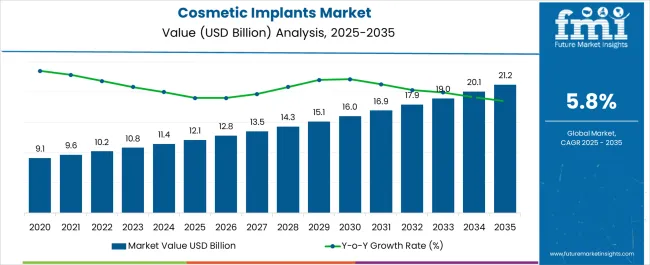
[299 Pages Report] The global cosmetic Implants market garnered US$ 9.6 Billion in 2021, the market is likely to propel to US$ 17.9 Billion by 2032. The trade is projected at a 5.8% CAGR during the forecast period, supported by:

  • An increasing number of cosmetic surgeries performed worldwide
  • technological advancement and increasing awareness about looks and aesthetic appearance
  • Improving Healthcare Infrastructure and Economic Development
  • growing popularity of minimally invasive cosmetic procedures
  • innovation in facial implant materials, dental implants, and expansion of healthcare
  • government initiatives to promote awareness regarding cosmetic implants

During the period ranging from 2020 to 2022, cosmetic implants demand prospects appeared limited, attributed to the onset of the COVID-19 pandemic, which shook investor confidence amid cessation of all industrial activity. This blip was gradually overcome since mid-2021, leading to a resurgence in growth projections.

Increasing consumer inclination towards modifying their facial features, growing popularity of minimally invasive cosmetic procedures, innovation in facial implant materials, and dental implants, and expansion of healthcare infrastructure are some of the major factors driving the global cosmetic implants market.

The growing awareness about cosmetic procedures globally is set to propel the demand for cosmetic Implants in the future years. For instance, According to the American Society of Plastic Surgeons (ASPS), almost 18 million people underwent surgical and minimally invasive cosmetic procedures in the United States in 2018.

These numbers are projected to surge at a fast pace in the assessment period, thereby boosting the demand for cosmetic implants globally.

Data Points Key Statistics
Cosmetic Implants Market Value in 2022 US$ 10.2 Billion
Cosmetic Implants Market Forecast Value in 2032 US$ 17.9 Billion
Global Growth Rate 5.8%

Don't pay for what you don't need

Customize your report by selecting specific countries or regions and save 30%!

Increasing adoption of technologically advanced equipment for treatment will boost the market growth in the North American region

North America accounts for a significant share of the global Cosmetic Implants Market due to expansions witnessed in its major countries along with increasing awareness and greater spending on cosmetics treatments and procedures. Increasing awareness regarding cosmetic implants among the population drives the demand for the cosmetic implants market in the region.

Also, the changing lifestyles and increasing focus on dental aesthetics are increasing the adoption of cosmetic dentistry, which is expected to propel the cosmetic implants market in the upcoming year. For instance, in August 2022- Allergan Aesthetics, an AbbVie company announced the U.S. FDA approval of JUVÉDERM® VOLUX™ XC for the improvement of jawline definition in adults over the age of 21 with moderate to a severe loss of jawline definition.

Cosmetic Implants Market

Opportunities abound in the Dental Implant Segment

Dental implants are among the major application of cosmetic implants as they are more advanced and designed with utmost care and efficiency. Due to the rising geriatric population along with the burden of dental diseases, increasing demand for cosmetic implants. Moreover, rising research studies proving the efficacies of dental implants will also boost the segment.

The rising prevalence of dental disorders is the primary factor propelling the dental implant segment growth. Additionally, in developed and developing countries, the changing lifestyles and increasing focus on oral disorders are increasing the adoption of cosmetic implants is expected to propel the market growth.

“Increasing number of cosmetic surgeries performed worldwide for enhancing the facial features of individuals is expected to fuel the demand of Cosmetic Implants Market over the forecast period”.

Sabyasachi Ghosh
Sabyasachi Ghosh

Principal Consultant

Talk to Analyst

Find your sweet spots for generating winning opportunities in this market.

What are the Factors Propelling the Global Cosmetic Implants Market?

Improving Healthcare Infrastructure and Economic Development to Boost Market Expansion

Easy availability to quality healthcare, favorable reimbursement policies, a strong clinical pipeline, and approval of novel drugs are the major factors that drive the growth of the global Cosmetic Implants Market.

Increasing consumer inclination towards modifying their facial features, growing popularity of minimally invasive cosmetic procedures, innovation in facial implant materials, dental implants, and expansion of healthcare infrastructure are some of the major factors driving the global cosmetic implants market.

Also, technological advancements like hyaluronic acid facial, and silicone gel breast implants create favorable growth opportunities for the market. The market is also driven by several government initiatives to promote awareness regarding cosmetic implants.

For instance, the American Society of Plastic Surgeons (ASPS) and The Plastic Surgery Foundation (The PSF) are running the Breast Reconstructive Awareness Campaign to educate women about the post-breast cancer diagnosis

What are the Factors Hampering the Global Cosmetic Implants Market?

Despite the growing popularity of cosmetic implants, various factors are likely to pose a threat to the growth of the cosmetic implants market during the forecast period. The high cost of cosmetic implants and the threat of malfunctioning are some of the prominent factors anticipated to hinder the market's growth during the forecast period.

Also, high chances of surgical complications, increasing cost of cosmetic surgeries, adverse effects of the cosmetic surgery, and lack of proper healthcare facilities across some developing economies are projected to harm the growth of the Cosmetic Implants Market over the forecast period. Lack of awareness of the operational effectiveness and other benefits of the technologically advanced implant systems restrain the growth of the market.

Get the data you need at a Fraction of the cost

Personalize your report by choosing insights you need
and save 40%!

What are the Prevailing Opportunities in the Global Cosmetic Implants Market?

In addition to this, rising expenditure on healthcare, growing awareness about cosmetic procedures, and an increasing number of specialty clinics and ambulatory centers will further expand the size of cosmetics implants market in the future. The growing influence of social media and the rising awareness among individuals about physical appearance drive the growth of the market in the forecasting period.

Furthermore, the population drifting towards aesthetic appearance and increasing disposable income are also driving the growth of the global cosmetic implants market. For instance, According to the American Society of Plastic Surgeons (ASPS), almost 18 million people underwent surgical and minimally invasive cosmetic procedures in the United States in 2018.

In addition, the rising incidence of accidents, the rising prevalence of acquired or congenital deformities of the face along with technological advancements in plastic surgery procedures are the key driving factors for the cosmetic implant market. However, the high cost related to cosmetic implantation surgeries and the lack of skilled personnel are the major factors hampering the growth of the global cosmetic implants market.

As per the analysis, the dental implants segment is anticipated to hold remunerative opportunities for the global cosmetics implants market. Various developing countries are making significant developments in their budgets, thereby, offering lucrative opportunities to players in the market.

Comparative View of Adjacent Cosmetics Implants Markets

Cosmetic Implants Market:

Attributes Cosmetic Implants Market
CAGR (2022-2032) 5.8%
Market Value (2032) US$ 17.9 Billion
Growth Factor Rising expenditure on healthcare, growing awareness about cosmetic procedures, and an increasing number of specialty clinics and ambulatory centers are expected to drive the market in the forecast period.
Opportunity Increasing awareness about looks and aesthetic appearance is expected to offer significant opportunities to the market.

Facial implant Market:

Attributes Facial implant Market
CAGR (2022-2032) 7.7%
Market Value (2032) US$ 5.6Billion
Growth Factor Increasing the number of cosmetic surgeries and growing concerns regarding personal appearance among the local population in both developed and developing countries are expected to drive the market in the forecast period.
Opportunity The rise in cases of facial deformities due to accidents and diseases is expected to give significant opportunities to the market in the assessment period.

Dental implant Market:

Attributes Dental implant Market
CAGR (2022-2032) 4.7%
Market Value (2032) US$7.3 Billion
Growth Factor An increasing shift of preference towards metal-free solutions and an increasing number of the dental problem is expected to drive the market
Opportunity Increasing awareness and greater spending on dental treatments and procedures is driving the global dental implant market

What is the Contribution of Various Segments in Boosting the Market?

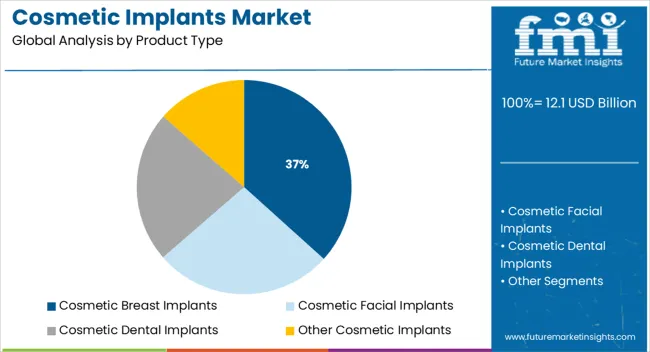
Based on the product type, the dental implants segment is expected to dominate the market in the forecast period. The segment is projected to exhibit a CAGR of 5.8% during the forecast period. The segment is expected to have experienced a CAGR of 6.3% during the timeframe of 2015-2021.

Dental implants are among the major application of cosmetic implants as they are more advanced and designed with utmost care and efficiency. Due to the rising geriatric population along with the burden of dental diseases, increasing demand for cosmetic implants. Moreover, rising research studies proving the efficacies of dental implants will also boost the segment.

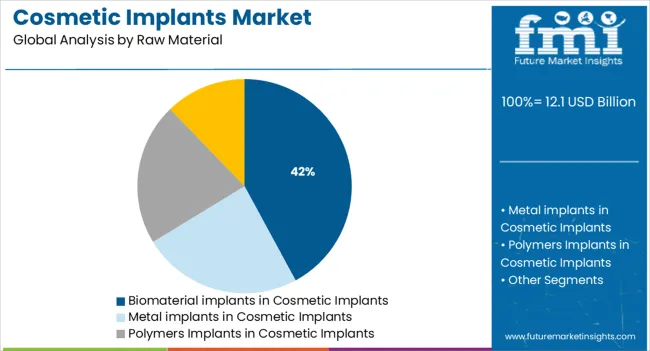
As per the analysis, by raw material, the polymer implants segment is expected to lead the market during the forecast period. The segment is anticipated to have witnessed a 6.5% CAGR from 2015 to 2021. Whereas, during the forecast period, the segment is estimated at a 5.9% CAGR.

The increasing use of polymer and synthetic products in the manufacturing of breast, facial, and body contouring implants is the major factor contributing to the growth of the segment in the forecasting period. On the other hand, the metal implants segment accounts for significant growth in the forecasting period due to the increasing number of cosmetic dentistry practices and the high cost of dental implant devices.
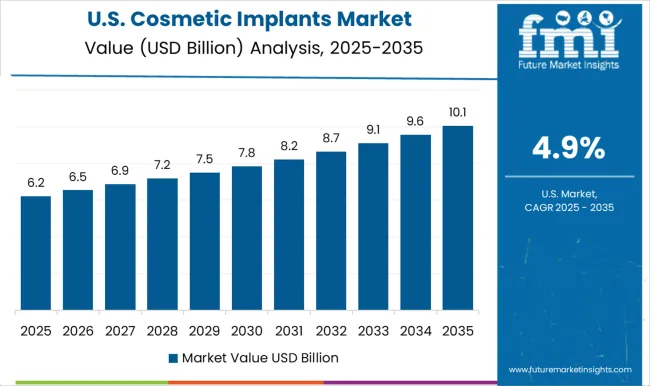
U.S. Cosmetic Implants Market Dominates Global Market with Technologically-advanced Equipment for Treatment

North America region dominates the global cosmetic implants market by acquiring the maximum share during the forecast period. The US is the leading contributor in the region due to increasing awareness and greater spending on cosmetic treatments and procedures in recent years. In addition, increasing awareness regarding cosmetic implants among the population drives the demand for cosmetic implants in the U.S.

Moreover, the changing lifestyles and increasing focus on dental aesthetics are increasing the adoption of cosmetic implant dentistry. These factors are expected to propel the cosmetic implants market share in the upcoming year.

For instance, in August 2022- Allergan Aesthetics, an AbbVie company, announced the U.S. FDA approval of JUVÉDERM® VOLUX™ XC for the improvement of jawline definition in adults over the age of 21 with moderate to a severe loss of jawline definition. These factors are growing the U.S. cosmetic implants market size in the coming years.

U.K. Cosmetics Implants Market Driven by Rising Cosmetic Treatment

The U.K. is followed by the U.S. market by rising global cosmetic treatment and rising awareness regarding cosmetic surgery and advanced technology during the forecast period. The number of key manufacturers in the healthcare sector and rising demand for cosmetic dental implants are flourishing in the U.K. cosmetic implants market size. Moreover, rising medical tourism, high patient awareness and rising accidents are increasing the cosmetic implant dentistry centre that rising demand for cosmetic implants in recent years. The growing popularity of minimally invasive surgeries is flourishing the global cosmetic implants market share during the forecast period.
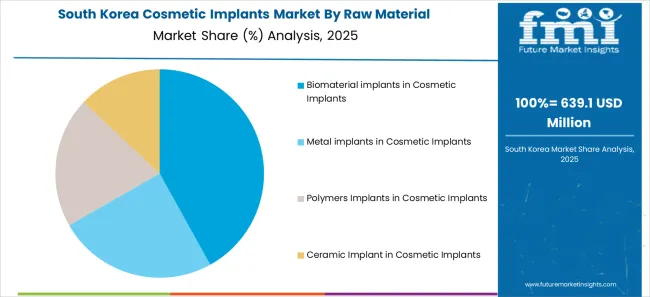
Korea Cosmetic Implants Market Advancing with Improvements in Healthcare Infrastructure

Asia Pacific is the fastest-growing region globally due to the rising generic population during the forecast period. The Korean market is upliftingly acquiring a relevant share in the global cosmetic implants market during the forecast period. With such acceleration in the dental industry, manufacturers of dental implants and prosthetics are focusing on leading the market footprint globally during the forecast period.

Moreover, the development of the Korean market can be credited to the rapid

development in the concerned field. The essential key players are contributing to their goals in the market by focusing on the end-users demand in recent years. Moreover, rising awareness about aesthetic appearance and looks increases the Korean cosmetic implants Market achieving the maximum output during the forecast period.
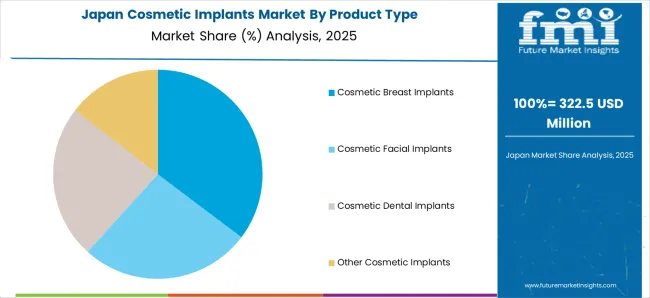
Japan Cosmetic Implants Market Enhanced by Rising Specialty Clinic

The Japanese market is growing in the cosmetic implants industry by capturing a high share during the forecast period. The innovation of cosmetic implants, such as facial implants and government initiatives are accelerating the demand for cosmetic implants in the market. Moreover, rising ambulatory centres and growing speciality clinics are anticipated to boost the Japanese cosmetic implants market size during the forecast period. The growing number of dental diseases and the rising awareness for the same is surging the Japanese cosmetic implants market growth in recent years. The key market players are playing a vital role in the market by focusing on the patient's requirements during the forecast period.

Regional Analysis of the Global Cosmetic Implants Market

Why is North America Considered the Most Prominent Market for cosmetics Implants?

North America is anticipated to lead in the global cosmetic implants market during the forecast period. The market is likely to garner US$ 6.4 Billion while exhibiting a CAGR of 5.5% from 2022 to 2032. North America is expected to hold a large share in the global Cosmetic Implants Market due to the increasing number of cosmetic surgeries and the presence of leading technological advancements in the healthcare sector.

The Cosmetic Implants Market is growing at a significant rate due to its high adoption in the region. The demand for cosmetic implants in Latin America is expected to rise at a moderate pace during the forecast period due to rising medical tourism, high patient awareness levels, an increasing number of accidents, and the growing popularity of minimally invasive surgeries.

Why is Demand for Cosmetics Implants Rising Across Europe & APAC?

Europe accounts for a significant share of the global Cosmetic Implants Market due to expansions witnessed in its major countries along with the increasing awareness and greater spending on cosmetics treatments and procedures.

With such acceleration in the dental industry, manufacturers of dental implants and prosthetics are focusing on leading economies to strengthen their market footprint globally. Increasing awareness regarding cosmetic implants among the population drives the demand for the cosmetic implants market in Europe.

APAC is anticipated to be the fastest-growing region during the forecast period. China is likely to make the most significant contribution to developing the market. China is estimated at US$ 1.3 Billion, expanding at a 5.1% CAGR during the forecast period. The growth of the market can be attributed to the presence of evolving countries such as; India, China, Japan, and others.

In addition, Japan has been recognized as another potent player in the region. According to the analysis, the country is anticipated at US$ 1.0 Billion while recording a CAGR of 4.2% in the forecast period. The development of the regional market can be credited to the rapid development in the concerned field.

The UK and South Korea are estimated at US$ 7.3 Billion and US$ 6.5 Billion respectively. The growth rate of the UK is anticipated to be 4.5% while for South Korea it is estimated at 3.7% from 2022-2032.

Country-wise Forecast CAGRs for the Cosmetic Implants Market

Countries Estimated CAGR
U.S 5.5%
U.K 4.5%
China 5.1%
Japan 4.2%
South Korea 3.7%

Who are the Key Players of the Global Cosmetic Implants Market?

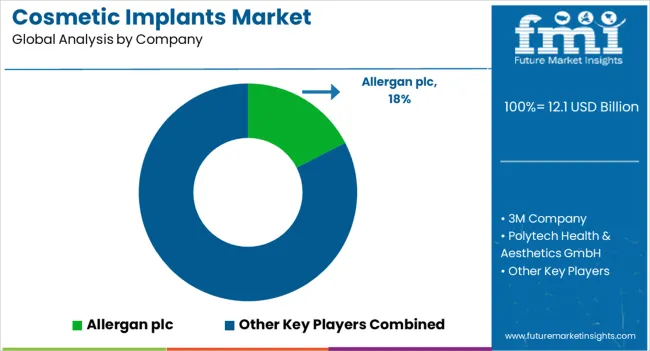
Eminent players of the global cosmetic implants market include Allergan plc, 3M Company, Polytech Health & Aesthetics GmbH, Sientra Inc., and GC Aesthetics plc among others. Recent key developments among players include:

  • In January 2022 -- Sientra, Inc. announced the acquisition of all of the assets related to AuraGen Aesthetic LLC’s novel fat grafting technology, the AuraGen with AuraClens. The AuraGen system was developed by leading researchers and plastic surgeons. “AuraGen’s transformative fat grafting system includes the face, potentially replacing currently available procedures using synthetic fillers with a procedure that uses the patient’s own tissue.
  • In May 2022 - GC Aesthetics® Inc. announced the launch of an innovative Nipple Areola Complex (NAC) This unrivaled medical device is the answer to a well-known clinical need of thousands of women around the world. Until now, a variety of surgical techniques are used to try to reconstruct the nipple-areola complex with none providing a long-term aesthetic solution.

Report Scope

Report Attribute Details
Growth Rate CAGR of 5.8% from 2022 to 2032
Base Year for Estimation 2021
Historical Data 2015 to 2021
Forecast Period 2022 to 2032
Quantitative Units USD Million for Value and Units for Volume
Report Coverage Revenue Forecast, Volume Forecast, Company Ranking, Competitive Landscape, Growth Factors, Trends and Pricing Analysis
Segments Covered
  • Product Type
  • Raw Material
  • Region
Regions Covered
  • North America
  • Europe
  • APAC
  • Latin America
  • Middle East & Africa
Key Countries Profiled
  • USA
  • Canada
  • Mexico
  • Brazil
  • Germany
  • France
  • Italy
  • BENELUX
  • U.K
  • Nordic
  • China
  • Japan
  • South Korea
  • GCC
  • South Africa
  • Turkey
Key Companies Profiled
  • 3M Company
  • Polytech Health & Aesthetics GmbH
  • Sientra Inc.
  • GC Aesthetics Plc.
  • Danaher Corporation
  • Dentsply Sirona Inc.
  • Straumann
  • Johnson & Johnson
  • Zimmer Biomet Holdings Inc.
  • AbbVie Inc.
  • Cochlear Ltd.
  • Henry Schein Inc.
Report Customization & Pricing Available upon Request

Key Segments Covered in the Cosmetic Implants Industry Survey

Cosmetic Implants Market by Product Type:

  • Cosmetic Breast Implants
  • Cosmetic Facial Implants
  • Cosmetic Dental Implants
  • Other Cosmetic Implants

Cosmetic Implants Market by Raw Material:

  • Biomaterial implants in Cosmetic Implants
  • Metal implants in Cosmetic Implants
  • Polymers Implants in Cosmetic Implants
  • Ceramic Implant in Cosmetic Implants

Cosmetic Implants Market by Region:

  • North America Cosmetic Implants Market
  • Europe Cosmetic Implants Market
  • APAC Cosmetic Implants Market
  • Middle East & Africa Cosmetic Implants Market
  • Latin America Cosmetic Implants Market

Frequently Asked Questions

What is the estimated market value of the global cosmetic implants market in 2021?

The global cosmetics implant market is likely to value US$ 9.6 Billion in 2021.

What is the projected CAGR of the global cosmetic implants market until 2032?

The global cosmetics implant market is estimated to grow at a CAGR of 5.8% from 2022 to 2032.

What is the expected market value of the global cosmetic implants market by 2032?

The global cosmetics implant market is predicted to procure USD 17.9 Billion from 2022 to 2032.

What is the contribution of the product type segment in driving the global cosmetic implants market?

The product type segment is projected to expand at a 5.8% CAGR during the forecast period.

Will the raw material segment propel the global cosmetic implants market?

The deployment segment is likely to exhibit a 5.9% CAGR from 2022-2032.

Who are the top five players in the global cosmetic implants market?

The main players in the cosmetics implant market are Allergan plc, 3M Company, Polytech Health & Aesthetics GmbH, and Sientra Inc.

What is the estimated market value of the U.S market?

The U.S market is expected to garner US$ 6.4 Billion while expanding at a 5.5% CAGR from 2022 to 2032.

Table of Content

1. Executive Summary

    1.1. Global Market Outlook

    1.2. Summary of Statistics

    1.3. Key Market Characteristics & Attributes

    1.4. Analysis and Recommendations

2. Market Overview

    2.1. Market Coverage / Taxonomy

    2.2. Market Definition / Scope / Limitations

3. Market Risks and Trends Assessment

    3.1. Risk Assessment

        3.1.1. COVID-19 Crisis and Impact on Demand

        3.1.2. COVID-19 Impact Benchmark with Previous Crisis

        3.1.3. Impact on Market Value (US$ Mn)

        3.1.4. Assessment by Key Countries

        3.1.5. Assessment by Key Market Segments

        3.1.6. Action Points and Recommendation for Suppliers

    3.2. Key Trends Impacting the Market

    3.3. Formulation and Product Development Trends

4. Market Background and Foundation Data Points

    4.1. Global Protective Coatings Market (US$ Mn)

    4.2. Market Opportunity Assessment (US$ Mn)

        4.2.1. Total Available Market

        4.2.2. Serviceable Addressable Market

        4.2.3. Serviceable Obtainable Market

    4.3. Market Scenario Forecast

        4.3.1. Demand in optimistic Scenario

        4.3.2. Demand in Likely Scenario

        4.3.3. Demand in Conservative Scenario

    4.4. Investment Feasibility Analysis

        4.4.1. Investment in Established Markets

            4.4.1.1. In Short Term

            4.4.1.2. In Long Term

        4.4.2. Investment in Emerging Markets

            4.4.2.1. In Short Term

            4.4.2.2. In Long Term

    4.5. Forecast Factors - Relevance & Impact

        4.5.1. Top Companies Historical Growth

        4.5.2. Global Protective Coatings Market Growth

        4.5.3. Adoption Rate, By Country

    4.6. Market Dynamics

        4.6.1. Market Driving Factors and Impact Assessment

        4.6.2. Prominent Market Challenges and Impact Assessment

        4.6.3. Market Opportunities

        4.6.4. Prominent Trends in the Global Market & Their Impact Assessment

5. Key Success Factors

    5.1. Manufacturers’ Focus on Low Penetration High Growth Markets

    5.2. Banking on with Segments High Incremental Opportunity

    5.3. Peer Benchmarking

6. Global Market Demand Analysis 2015-2021 and Forecast, 2022-2032

    6.1. Historical Market Analysis, 2015-2021

    6.2. Current and Future Market Projections, 2022-2032

    6.3. Y-o-Y Growth Trend Analysis

7. Global Market Value Analysis 2015-2021 and Forecast, 2022-2032

    7.1. Historical Market Value (US$ Mn) Analysis, 2015-2021

    7.2. Current and Future Market Value (US$ Mn) Projections, 2022-2032

        7.2.1. Y-o-Y Growth Trend Analysis

        7.2.2. Absolute $ Opportunity Analysis

8. Global Market Analysis 2015-2021 and Forecast 2022-2032, By Product Type

    8.1. Introduction / Key Findings

    8.2. Historical Market Size (US$ Mn) Analysis By Product Type, 2015-2021

    8.3. Current and Future Market Size (US$ Mn) Analysis and Forecast By Product Type, 2022-2032

        8.3.1. Breast Implants

        8.3.2. Facial Implants

        8.3.3. Dental Implants

        8.3.4. Others

    8.4. Market Attractiveness Analysis By Product Type

9. Global Market Analysis 2015-2021 and Forecast 2022-2032, By Raw Material

    9.1. Introduction / Key Findings

    9.2. Historical Market Size (US$ Mn) Analysis By Raw Material, 2015-2021

    9.3. Current and Future Market Size (US$ Mn) Analysis and Forecast By Raw Material, 2022-2032

        9.3.1. Biomaterials Implants

        9.3.2. Metals Implants

        9.3.3. Polymers Implants

        9.3.4. Ceramics Implants

    9.4. Market Attractiveness Analysis By Raw Material

10. Global Market Analysis 2015-2021 and Forecast 2022-2032, By Region

    10.1. Introduction

    10.2. Historical Market Size (US$ Mn) Analysis By Region, 2015-2021

    10.3. Current Market Size (US$ Mn) & Analysis and Forecast By Region, 2022-2032

        10.3.1. North America

        10.3.2. Latin America

        10.3.3. Europe

        10.3.4. Asia Pacific

        10.3.5. Middle East and Africa (MEA)

    10.4. Market Attractiveness Analysis By Region

11. North America Market Analysis 2015-2021 and Forecast 2022-2032

    11.1. Introduction

    11.2. Pricing Analysis

    11.3. Historical Market Value (US$ Mn) Trend Analysis By Market Taxonomy, 2015-2021

    11.4. Market Value (US$ Mn) & Forecast By Market Taxonomy, 2022-2032

        11.4.1. By Country

            11.4.1.1. U.S.

            11.4.1.2. Canada

            11.4.1.3. Rest of North America

        11.4.2. By Product Type

        11.4.3. By Raw Material

    11.5. Market Attractiveness Analysis

        11.5.1. By Country

        11.5.2. By Product Type

        11.5.3. By Raw Material

12. Latin America Market Analysis 2015-2021 and Forecast 2022-2032

    12.1. Introduction

    12.2. Pricing Analysis

    12.3. Historical Market Value (US$ Mn) Trend Analysis By Market Taxonomy, 2015-2021

    12.4. Market Value (US$ Mn) & Forecast By Market Taxonomy, 2022-2032

        12.4.1. By Country

            12.4.1.1. Brazil

            12.4.1.2. Mexico

            12.4.1.3. Rest of Latin America

        12.4.2. By Product Type

        12.4.3. By Raw Material

    12.5. Market Attractiveness Analysis

        12.5.1. By Country

        12.5.2. By Product Type

        12.5.3. By Raw Material

13. Europe Market Analysis 2015-2021 and Forecast 2022-2032

    13.1. Introduction

    13.2. Pricing Analysis

    13.3. Historical Market Value (US$ Mn) Trend Analysis By Market Taxonomy, 2015-2021

    13.4. Market Value (US$ Mn) & Forecast By Market Taxonomy, 2022-2032

        13.4.1. By Country

            13.4.1.1. Germany

            13.4.1.2. France

            13.4.1.3. U.K.

            13.4.1.4. Italy

            13.4.1.5. Benelux

            13.4.1.6. Nordic Countries

            13.4.1.7. Rest of Europe

        13.4.2. By Product Type

        13.4.3. By Raw Material

    13.5. Market Attractiveness Analysis

        13.5.1. By Country

        13.5.2. By Product Type

        13.5.3. By Raw Material

14. Asia Pacific Market Analysis 2015-2021 and Forecast 2022-2032

    14.1. Introduction

    14.2. Pricing Analysis

    14.3. Historical Market Value (US$ Mn) Trend Analysis By Market Taxonomy, 2015-2021

    14.4. Market Value (US$ Mn) & Forecast By Market Taxonomy, 2022-2032

        14.4.1. By Country

            14.4.1.1. China

            14.4.1.2. Japan

            14.4.1.3. South Korea

            14.4.1.4. Rest of Asia Pacific

        14.4.2. By Product Type

        14.4.3. By Raw Material

    14.5. Market Attractiveness Analysis

        14.5.1. By Country

        14.5.2. By Product Type

        14.5.3. By Raw Material

15. Middle East and Africa Market Analysis 2015-2021 and Forecast 2022-2032

    15.1. Introduction

    15.2. Pricing Analysis

    15.3. Historical Market Value (US$ Mn) Trend Analysis By Market Taxonomy, 2015-2021

    15.4. Market Value (US$ Mn) & Forecast By Market Taxonomy, 2022-2032

        15.4.1. By Country

            15.4.1.1. GCC Countries

            15.4.1.2. South Africa

            15.4.1.3. Turkey

            15.4.1.4. Rest of Middle East and Africa

        15.4.2. By Product Type

        15.4.3. By Raw Material

    15.5. Market Attractiveness Analysis

        15.5.1. By Country

        15.5.2. By Product Type

        15.5.3. By Raw Material

16. Key Countries Market Analysis 2015-2021 and Forecast 2022-2032

    16.1. Introduction

        16.1.1. Market Value Proportion Analysis, By Key Countries

        16.1.2. Global Vs. Country Growth Comparison

    16.2. US Market Analysis

        16.2.1. Value Proportion Analysis by Market Taxonomy

        16.2.2. Value & Analysis and Forecast by Market Taxonomy, 2015-2032

            16.2.2.1. By Product Type

            16.2.2.2. By Raw Material

    16.3. Canada Market Analysis

        16.3.1. Value Proportion Analysis by Market Taxonomy

        16.3.2. Value & Analysis and Forecast by Market Taxonomy, 2015-2032

            16.3.2.1. By Product Type

            16.3.2.2. By Raw Material

    16.4. Mexico Market Analysis

        16.4.1. Value Proportion Analysis by Market Taxonomy

        16.4.2. Value & Analysis and Forecast by Market Taxonomy, 2015-2032

            16.4.2.1. By Product Type

            16.4.2.2. By Raw Material

    16.5. Brazil Market Analysis

        16.5.1. Value Proportion Analysis by Market Taxonomy

        16.5.2. Value & Analysis and Forecast by Market Taxonomy, 2015-2032

            16.5.2.1. By Product Type

            16.5.2.2. By Raw Material

    16.6. Germany Market Analysis

        16.6.1. Value Proportion Analysis by Market Taxonomy

        16.6.2. Value & Analysis and Forecast by Market Taxonomy, 2015-2032

            16.6.2.1. By Product Type

            16.6.2.2. By Raw Material

    16.7. France Market Analysis

        16.7.1. Value Proportion Analysis by Market Taxonomy

        16.7.2. Value & Analysis and Forecast by Market Taxonomy, 2015-2032

            16.7.2.1. By Product Type

            16.7.2.2. By Raw Material

    16.8. Italy Market Analysis

        16.8.1. Value Proportion Analysis by Market Taxonomy

        16.8.2. Value & Analysis and Forecast by Market Taxonomy, 2015-2032

            16.8.2.1. By Product Type

            16.8.2.2. By Raw Material

    16.9. BENELUX Market Analysis

        16.9.1. Value Proportion Analysis by Market Taxonomy

        16.9.2. Value & Analysis and Forecast by Market Taxonomy, 2015-2032

            16.9.2.1. By Product Type

            16.9.2.2. By Raw Material

    16.10. UK Market Analysis

        16.10.1. Value Proportion Analysis by Market Taxonomy

        16.10.2. Value & Analysis and Forecast by Market Taxonomy, 2015-2032

            16.10.2.1. By Product Type

            16.10.2.2. By Raw Material

    16.11. Nordic Countries Market Analysis

        16.11.1. Value Proportion Analysis by Market Taxonomy

        16.11.2. Value & Analysis and Forecast by Market Taxonomy, 2015-2032

            16.11.2.1. By Product Type

            16.11.2.2. By Raw Material

    16.12. China Market Analysis

        16.12.1. Value Proportion Analysis by Market Taxonomy

        16.12.2. Value & Analysis and Forecast by Market Taxonomy, 2015-2032

            16.12.2.1. By Product Type

            16.12.2.2. By Raw Material

    16.13. Japan Market Analysis

        16.13.1. Value Proportion Analysis by Market Taxonomy

        16.13.2. Value & Analysis and Forecast by Market Taxonomy, 2015-2032

            16.13.2.1. By Product Type

            16.13.2.2. By Raw Material

    16.14. South Korea Market Analysis

        16.14.1. Value Proportion Analysis by Market Taxonomy

        16.14.2. Value & Analysis and Forecast by Market Taxonomy, 2015-2032

            16.14.2.1. By Product Type

            16.14.2.2. By Raw Material

    16.15. GCC Countries Market Analysis

        16.15.1. Value Proportion Analysis by Market Taxonomy

        16.15.2. Value & Analysis and Forecast by Market Taxonomy, 2015-2032

            16.15.2.1. By Product Type

            16.15.2.2. By Raw Material

    16.16. South Africa Market Analysis

        16.16.1. Value Proportion Analysis by Market Taxonomy

        16.16.2. Value & Analysis and Forecast by Market Taxonomy, 2015-2032

            16.16.2.1. By Product Type

            16.16.2.2. By Raw Material

    16.17. Turkey Market Analysis

        16.17.1. Value Proportion Analysis by Market Taxonomy

        16.17.2. Value & Analysis and Forecast by Market Taxonomy, 2015-2032

            16.17.2.1. By Product Type

            16.17.2.2. By Raw Material

        16.17.3. Competition Landscape and Player Concentration in the Country

17. Market Structure Analysis

    17.1. Market Analysis by Tier of Companies

    17.2. Market Concentration

    17.3. Market Share Analysis of Top Players

    17.4. Market Presence Analysis

        17.4.1. By Regional footprint of Players

        17.4.2. Product footprint by Players

18. Competition Analysis

    18.1. Competition Dashboard

    18.2. Competition Benchmarking

    18.3. Competition Deep Dive

        18.3.1. Allergan plc

            18.3.1.1. Overview

            18.3.1.2. Product Portfolio

            18.3.1.3. Sales Footprint

            18.3.1.4. Strategy Overview

        18.3.2. 3M Company

            18.3.2.1. Overview

            18.3.2.2. Product Portfolio

            18.3.2.3. Sales Footprint

            18.3.2.4. Strategy Overview

        18.3.3. Polytech Health & Aesthetics GmbH

            18.3.3.1. Overview

            18.3.3.2. Product Portfolio

            18.3.3.3. Sales Footprint

            18.3.3.4. Strategy Overview

        18.3.4. Sientra Inc.

            18.3.4.1. Overview

            18.3.4.2. Product Portfolio

            18.3.4.3. Sales Footprint

            18.3.4.4. Strategy Overview

        18.3.5. GC Aesthetics plc

            18.3.5.1. Overview

            18.3.5.2. Product Portfolio

            18.3.5.3. Sales Footprint

            18.3.5.4. Strategy Overview

        18.3.6. Danaher Corporation

            18.3.6.1. Overview

            18.3.6.2. Product Portfolio

            18.3.6.3. Sales Footprint

            18.3.6.4. Strategy Overview

        18.3.7. Dentsply Sirona Inc.

            18.3.7.1. Overview

            18.3.7.2. Product Portfolio

            18.3.7.3. Sales Footprint

            18.3.7.4. Strategy Overview

        18.3.8. Straumann

            18.3.8.1. Overview

            18.3.8.2. Product Portfolio

            18.3.8.3. Sales Footprint

            18.3.8.4. Strategy Overview

        18.3.9. Johnson & Johnson

            18.3.9.1. Overview

            18.3.9.2. Product Portfolio

            18.3.9.3. Sales Footprint

            18.3.9.4. Strategy Overview

        18.3.10. Zimmer Biomet Holdings, Inc.

            18.3.10.1. Overview

            18.3.10.2. Product Portfolio

            18.3.10.3. Sales Footprint

            18.3.10.4. Strategy Overview

        18.3.11. AbbVie, Inc

            18.3.11.1. Overview

            18.3.11.2. Product Portfolio

            18.3.11.3. Sales Footprint

            18.3.11.4. Strategy Overview

        18.3.12. Cochlear Ltd

            18.3.12.1. Overview

            18.3.12.2. Product Portfolio

            18.3.12.3. Sales Footprint

            18.3.12.4. Strategy Overview

        18.3.13. Henry Schein Inc.

            18.3.13.1. Overview

            18.3.13.2. Product Portfolio

            18.3.13.3. Sales Footprint

            18.3.13.4. Strategy Overview

19. Assumptions and Acronyms Used

20. Research Methodology

Don't pay for what you don't need

Customize your report by selecting specific countries or regions and save 30%!

List of Tables

Table 1: Global Market Value (US$ Mn), By Product Type, 2015 – 2021

Table 2: Global Market Value (US$ Mn), By Product Type, 2022 – 2032

Table 3: Global Market Value (US$ Mn), By Raw Material, 2015 – 2021

Table 4: Global Market Value (US$ Mn), By Raw Material, 2022 – 2032

Table 5: Global Market, By Region, 2015 – 2021

Table 6: Global Market, By Region, 2022 – 2032

Table 7: North America Market Value (US$ Mn), By Product Type, 2015 – 2021

Table 8: North America Market Value (US$ Mn), By Product Type, 2022 – 2032

Table 9: North America Market Value (US$ Mn), By Raw Material, 2015 – 2021

Table 10: North America Market Value (US$ Mn), By Raw Material, 2022 – 2032

Table 11: North America Market, By Country, 2015 – 2021

Table 12: North America Market, By Country, 2022 – 2032

Table 13: Latin America Market Value (US$ Mn), By Product Type, 2015 – 2021

Table 14: Latin America Market Value (US$ Mn), By Product Type, 2022 – 2032

Table 15: Latin America Market Value (US$ Mn), By Raw Material, 2015 – 2021

Table 16: Latin America Market Value (US$ Mn), By Raw Material, 2022 – 2032

Table 17: Latin America Market, By Country, 2015 – 2021

Table 18: Latin America Market, By Country, 2022 – 2032

Table 19: Europe Market Value (US$ Mn), By Product Type, 2015 – 2021

Table 20: Europe Market Value (US$ Mn), By Product Type, 2022 – 2032

Table 21: Europe Market Value (US$ Mn), By Raw Material, 2015 – 2021

Table 22: Europe Market Value (US$ Mn), By Raw Material, 2022 – 2032

Table 23: Europe Market, By Country, 2015 – 2021

Table 24: Europe Market, By Country, 2022 – 2032

Table 25: Asia Pacific Market Value (US$ Mn), By Product Type, 2015 – 2021

Table 26: Asia Pacific Market Value (US$ Mn), By Product Type, 2022 – 2032

Table 27: Asia Pacific Market Value (US$ Mn), By Raw Material, 2015 – 2021

Table 28: Asia Pacific Market Value (US$ Mn), By Raw Material, 2022 – 2032

Table 29: Asia Pacific Market, By Country, 2015 – 2021

Table 30: Asia Pacific Market, By Country, 2022 – 2032

Table 31: MEA Market Value (US$ Mn), By Product Type, 2015 – 2021

Table 32: MEA Market Value (US$ Mn), By Product Type, 2022 – 2032

Table 33: MEA Market Value (US$ Mn), By Raw Material, 2015 – 2021

Table 34: MEA Market Value (US$ Mn), By Raw Material, 2022 – 2032

Table 35: MEA Market, By Country, 2015 – 2021

Table 36: MEA Market, By Country, 2022 – 2032

Table 37: Global Market Incremental $ Opportunity, By Product Type, 2015 - 2021

Table 38: Global Market Incremental $ Opportunity, By Raw Material, 2022 – 2032

Table 39: Global Market Incremental $ Opportunity, By Region, 2022 – 2032

Table 40: North America Market Incremental $ Opportunity, By Product Type, 2015 - 2021

Table 41: North America Market Incremental $ Opportunity, By Raw Material, 2022 – 2032

Table 42: North America Market Incremental $ Opportunity, By Country, 2022 – 2032

Table 43: Latin America Market Incremental $ Opportunity, By Product Type, 2015 - 2021

Table 44: Latin America Market Incremental $ Opportunity, By Raw Material, 2022 – 2032

Table 45: Latin America Market Incremental $ Opportunity, By Country, 2022 – 2032

Table 46: Europe Market Incremental $ Opportunity, By Product Type, 2015 - 2021

Table 47: Europe Market Incremental $ Opportunity, By Raw Material, 2022 – 2032

Table 48: Europe Market Incremental $ Opportunity, By Country, 2022 - 2032

Table 49: Asia Pacific Market Incremental $ Opportunity, By Product Type, 2015 - 2021

Table 50: Asia Pacific Market Incremental $ Opportunity, By Raw Material, 2022 – 2032

Table 51: Asia Pacific Market Incremental $ Opportunity, By Country, 2022 – 2032

Table 52: MEA Market Incremental $ Opportunity, By Product Type, 2015 - 2021

Table 53: MEA Market Incremental $ Opportunity, By Raw Material, 2022 – 2032

Table 54: MEA Market Incremental $ Opportunity, By Country, 2022 - 2032
Sabyasachi Ghosh
Sabyasachi Ghosh

Principal Consultant

Talk to Analyst

Find your sweet spots for generating winning opportunities in this market.

List of Charts

Figure 1: Global Market Value (US$ Mn) and Year-on-Year Growth, 2015-2032

Figure 2: Global Market Absolute $ Historical Gain (2015 - 2021) and Opportunity (2022 – 2032), US$ Mn

Figure 3: Global Market Share, By Product Type, 2022 & 2032

Figure 4: Global Market Y-o-Y Growth Projections, By Product Type – 2022-2032

Figure 5: Global Market Attractiveness Index, By Product Type – 2022-2032

Figure 6: Global Market Share, By Raw Material, 2022 & 2032

Figure 7: Global Market Y-o-Y Growth Projections, By Raw Material – 2022-2032

Figure 8: Global Market Attractiveness Index, By Raw Material – 2022-2032

Figure 9: Global Market Share, By Region, 2022 & 2032

Figure 10: Global Market Y-o-Y Growth Projections, By Region – 2022-2032

Figure 11: Global Market Attractiveness Index, By Region – 2022-2032

Figure 12: North America Market Value (US$ Mn) and Year-on-Year Growth, 2015-2032

Figure 13: North America Market Absolute $ Opportunity Historical (2015 - 2021) and Forecast Period(2022 – 2032), US$ Mn

Figure 14: North America Market Share, By Product Type, 2022 & 2032

Figure 15: North America Market Y-o-Y Growth Projections, By Product Type – 2022-2032

Figure 16: North America Market Attractiveness Index, By Product Type – 2022-2032

Figure 17: North America Market Share, By Raw Material, 2022 & 2032

Figure 18: North America Market Y-o-Y Growth Projections, By Raw Material – 2022-2032

Figure 19: North America Market Attractiveness Index, By Raw Material – 2022-2032

Figure 20: North America Market Share, By Country, 2022 & 2032

Figure 21: North America Market Y-o-Y Growth Projections, By Country – 2022-2032

Figure 22: North America Market Attractiveness Index, By Country – 2022-2032

Figure 23: Latin America Market Value (US$ Mn) and Year-on-Year Growth, 2015-2032

Figure 24: Latin America Market Absolute $ Opportunity Historical (2015 - 2021) and Forecast Period (2022 – 2032), US$ Mn

Figure 25: Latin America Market Share, By Product Type, 2022 & 2032

Figure 26: Latin America Market Y-o-Y Growth Projections, By Product Type – 2022-2032

Figure 27: Latin America Market Attractiveness Index, By Product Type – 2022-2032

Figure 28: Latin America Market Share, By Raw Material, 2022 & 2032

Figure 29: Latin America Market Y-o-Y Growth Projections, By Raw Material – 2022-2032

Figure 30: Latin America Market Attractiveness Index, By Raw Material – 2022-2032

Figure 31: Latin America Market Share, By Country, 2022 & 2032

Figure 32: Latin America Market Y-o-Y Growth Projections, By Country – 2022-2032

Figure 33: Latin America Market Attractiveness Index, By Country – 2022-2032

Figure 34: Europe Market Value (US$ Mn) and Year-on-Year Growth, 2015-2032

Figure 35: Europe Market Absolute $ Opportunity Historical (2015 - 2021) and Forecast Period (2022–2032), US$ Mn

Figure 36: Europe Market Share, By Product Type, 2022 & 2032

Figure 37: Europe Market Y-o-Y Growth Projections, By Product Type – 2022-2032

Figure 38: Europe Market Attractiveness Index, By Product Type – 2022-2032

Figure 39: Europe Market Share, By Raw Material, 2022 & 2032

Figure 40: Europe Market Y-o-Y Growth Projections, By Raw Material – 2022-2032

Figure 41: Europe Market Attractiveness Index, By Raw Material – 2022-2032

Figure 42: Europe Market Share, By Country, 2022 & 2032

Figure 43: Europe Market Y-o-Y Growth Projections, By Country – 2022-2032

Figure 44: Europe Market Attractiveness Index, By Country – 2022-2032

Figure 45: MEA Market Value (US$ Mn) and Year-on-Year Growth, 2015-2032

Figure 46: MEA Market Absolute $ Opportunity Historical (2015 - 2021) and Forecast Period (2022 – 2032), US$ Mn

Figure 47: MEA Market Share, By Product Type, 2022 & 2032

Figure 48: MEA Market Y-o-Y Growth Projections, By Product Type – 2022-2032

Figure 49: MEA Market Attractiveness Index, By Product Type – 2022-2032

Figure 50: MEA Market Share, By Raw Material, 2022 & 2032

Figure 51: MEA Market Y-o-Y Growth Projections, By Raw Material – 2022-2032

Figure 52: MEA Market Attractiveness Index, By Raw Material – 2022-2032

Figure 53: MEA Market Share, By Country, 2022 & 2032

Figure 54: MEA Market Y-o-Y Growth Projections, By Country – 2022-2032

Figure 55: MEA Market Attractiveness Index, By Country – 2022-2032

Figure 56: Asia Pacific Market Value (US$ Mn) and Year-on-Year Growth, 2015-2032

Figure 57: Asia Pacific Market Absolute $ Opportunity Historical (2015 - 2021) and Forecast Period (2022–2032), US$ Mn

Figure 58: Asia Pacific Market Share, By Product Type, 2022 & 2032

Figure 59: Asia Pacific Market Y-o-Y Growth Projections, By Product Type – 2022-2032

Figure 60: Asia Pacific Market Attractiveness Index, By Product Type – 2022-2032

Figure 61: Asia Pacific Market Share, By Raw Material, 2022 & 2032

Figure 62: Asia Pacific Market Y-o-Y Growth Projections, By Raw Material – 2022-2032

Figure 63: Asia Pacific Market Attractiveness Index, By Raw Material – 2022-2032

Figure 64: Asia Pacific Market Share, By Country, 2022 & 2032

Figure 65: Asia Pacific Market Y-o-Y Growth Projections, By Country – 2022-2032

Figure 66: Asia Pacific Market Attractiveness Index, By Country – 2022-2032

Figure 67: US Market Value (US$ Mn) and Forecast, 2022 - 2032

Figure 68: US Market Share, By Product Type, 2021

Figure 69: US Market Share, By Raw Material, 2021

Figure 70: Canada Market Value (US$ Mn) and Forecast, 2022 - 2032

Figure 71: Canada Market Share, By Product Type, 2021

Figure 72: Canada Market Share, By Raw Material, 2021

Figure 73: Brazil Market Value (US$ Mn) and Forecast, 2022 - 2032

Figure 74: Brazil Market Share, By Product Type, 2021

Figure 75: Brazil Market Share, By Raw Material, 2021

Figure 76: Mexico Market Value (US$ Mn) and Forecast, 2022 - 2032

Figure 77: Mexico Market Share, By Product Type, 2021

Figure 78: Mexico Market Share, By Raw Material, 2021

Figure 79: Germany Market Value (US$ Mn) and Forecast, 2022 - 2032

Figure 80: Germany Market Share, By Product Type, 2021

Figure 81: Germany Market Share, By Raw Material, 2021

Figure 82: U.K. Market Value (US$ Mn) and Forecast, 2022 - 2032

Figure 83: U.K. Market Share, By Product Type, 2021

Figure 84: U.K. Market Share, By Raw Material, 2021

Figure 85: France Market Value (US$ Mn) and Forecast, 2022 - 2032

Figure 86: France Market Share, By Product Type, 2021

Figure 87: France Market Share, By Raw Material, 2021

Figure 88: Italy Market Value (US$ Mn) and Forecast, 2022 - 2032

Figure 89: Italy Market Share, By Product Type, 2021

Figure 90: Italy Market Share, By Raw Material, 2021

Figure 91: BENELUX Market Value (US$ Mn) and Forecast, 2022 - 2032

Figure 92: BENELUX Market Share, By Product Type, 2021

Figure 93: BENELUX Market Share, By Raw Material, 2021

Figure 94: Nordic Countries Market Value (US$ Mn) and Forecast, 2022 - 2032

Figure 95: Nordic Countries Market Share, By Product Type, 2021

Figure 96: Nordic Countries Market Share, By Raw Material, 2021

Figure 97: China Market Value (US$ Mn) and Forecast, 2022 - 2032

Figure 98: China Market Share, By Product Type, 2021

Figure 99: China Market Share, By Raw Material, 2021

Figure 100: Japan Market Value (US$ Mn) and Forecast, 2022 - 2032

Figure 101: Japan Market Share, By Product Type, 2021

Figure 102: Japan Market Share, By Raw Material, 2021

Figure 103: South Korea Market Value (US$ Mn) and Forecast, 2022 - 2032

Figure 104: South Korea Market Share, By Product Type, 2021

Figure 105: South Korea Market Share, By Raw Material, 2021

Figure 106: GCC Countries Market Value (US$ Mn) and Forecast, 2022 - 2032

Figure 107: GCC Countries Market Share, By Product Type, 2021

Figure 108: GCC Countries Market Share, By Raw Material, 2021

Figure 109: South Africa Market Value (US$ Mn) and Forecast, 2022 - 2032

Figure 110: South Africa Market Share, By Product Type, 2021

Figure 111: South Africa Market Share, By Raw Material, 2021

Figure 112: Turkey Market Value (US$ Mn) and Forecast, 2022 - 2032

Figure 113: Turkey Market Share, By Product Type, 2021

Figure 114: Turkey Market Share, By Raw Material, 2021

Recommendations

Healthcare

Anti-aging Product Service and Device Market

Published : March 2024

Healthcare

Cosmetic Surgery Products Market

Published : August 2023

Healthcare

Dental Implants and Prosthetics Market

Published : September 2022

Explore Healthcare Insights

View Reports