Cosmetic Nanoencapsulation Market Size and Share Forecast Outlook 2025 to 2035

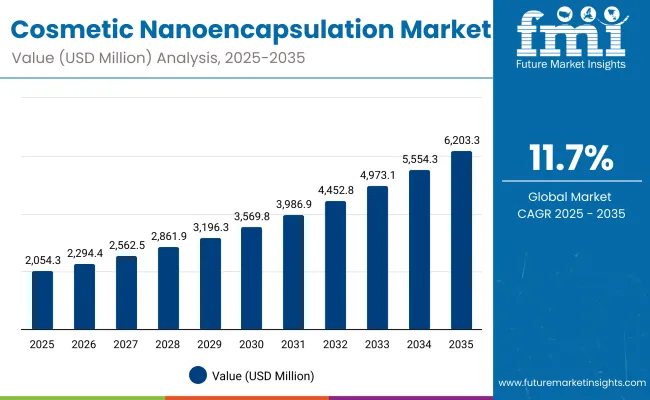
The Global Cosmetic Nanoencapsulation Market is expected to record a valuation of USD 2,054.3 million in 2025 and USD 6,203.3 million in 2035, with an increase of USD 4,149.0 million, which equals a growth of 193% over the decade. The overall expansion represents a CAGR of 11.7% and a nearly 2X increase in market size.
Quick Stats for Global Cosmetic Nanoencapsulation Market

  • Global Cosmetic Nanoencapsulation Market Value (2025): USD 2,054.3 million
  • Global Cosmetic Nanoencapsulation Market Forecast Value (2035): USD 6,203.3 million
  • Global Cosmetic Nanoencapsulation Market Forecast CAGR: 11.7%
  • Leading Segment in Global Cosmetic Nanoencapsulation Market in 2025: Lipid Nanoparticles (36.4%)
  • Key Growth Regions in the Global Cosmetic Nanoencapsulation Market: East Asia, South Asia & Pacific, Europe
  • Top Key Players in Global Cosmetic Nanoencapsulation Market: Lipotec (Lubrizol), Tagra Biotechnologies, Nanophase Technologies, Evonik, BASF, Ashland, Croda, Seppic, Gattefossé, Lucas Meyer Cosmetics

Cosmetic Nanoencapsulation Market

Metric Value
Global Cosmetic Nanoencapsulation Market Estimated Value in (2025E) USD 2,054.3 million
Global Cosmetic Nanoencapsulation Market Forecast Value in (2035F) USD 6,203.3 million
Forecast CAGR (2025 to 2035) 11.7%

During the first five-year period from 2025 to 2030, the market increases from USD 2,054.3 million to USD 3,569.8 million, adding USD 1,515.5 million, which accounts for 36.5% of the total decade growth. This phase records steady adoption in anti-aging skincare, suncare, and dermocosmetic formulations, driven by the need for stable delivery of retinoids, vitamins, and UV filters. Lipid nanoparticles dominate this period as they cater to over 30% of encapsulation needs, offering enhanced bioavailability and controlled release.

The second half from 2030 to 2035 contributes USD 2,633.5 million, equal to 63.5% of total growth, as the market jumps from USD 3,569.8 million to USD 6,203.3 million. This acceleration is powered by widespread deployment of nanoemulsions in haircare and color cosmetics, peptide-loaded polymeric nanocapsules, and AI-assisted product personalization in smart beauty platforms. UV filters and brightening agents capture a larger share above 40% by the end of the decade. Regulatory-driven EU-compliant innovations and APAC-first launches add recurring momentum, increasing the skincare share beyond 55% in total value.

From 2020 to 2024, the Global Cosmetic Nanoencapsulation Market grew from USD 1,240 million to USD 1,900 million, driven by skincare-centric adoption. During this period, the competitive landscape was dominated by specialty ingredient manufacturers controlling nearly 60% of revenue, with leaders such as Lipotec (Lubrizol), Evonik, and Croda focusing on lipid and polymer-based encapsulation platforms for anti-aging and sun protection applications.

Competitive differentiation relied on stability, penetration efficiency, and cost-effectiveness, while regulatory-compliant solutions were often positioned as a premium offering rather than a mainstream adoption path. Service-based product development had minimal traction, contributing less than 10% of the total market value.

Demand for cosmetic nanoencapsulation will expand to USD 2,054.3 million in 2025, and the revenue mix will shift as polymeric nanocapsules and nanoemulsions grow to over 50% share. Traditional lipid-based leaders face rising competition from digital-first and biotech-driven players offering AI-personalized skincare delivery, cloud-enabled formulation design, and subscription-based nano-beauty platforms.

Major encapsulation vendors are pivoting to hybrid models, integrating peptide/growth factor delivery systems and multifunctional encapsulation to retain relevance. Emerging entrants specializing in retinoid stability, UV filter micro-carriers, and APAC-first brightening solutions are gaining share. The competitive advantage is moving away from traditional lipid nanoparticle innovation alone to ecosystem partnerships, personalization scalability, and regulatory credibility across geographies.

Why the Global Cosmetic Nanoencapsulation Market is growing?

Advances in nano-carrier systems have improved stability, penetration, and controlled release, allowing for more efficient delivery of actives across skincare, suncare, and haircare categories. Lipid nanoparticles have gained popularity due to their biocompatibility, skin safety, and ability to encapsulate sensitive molecules like retinoids and vitamins. The rise of UV filter encapsulation has contributed to superior sun protection, reduced irritation, and longer-lasting formulations. Industries such as dermocosmetics, cosmeceuticals, and premium beauty are driving demand for nanoencapsulation that can integrate seamlessly into existing skincare routines.

Expansion of anti-aging serums, brightening essences, and multifunctional lotions has fueled market growth. Innovations in polymeric nanocapsules and nanoemulsions are expected to open new application areas such as color cosmetics and advanced sprays/mists. Segment growth is expected to be led by lipid nanoparticles in carrier systems, UV filters in active class, and skincare in applications due to their precision and adaptability across global consumer needs.

Segmental Analysis

The market is segmented by carrier system, active class, application, product format, regulatory positioning, and geography. Carrier systems include lipid nanoparticles (SLN/NLC), polymeric nanocapsules, nanoemulsions, and nanoclays/silica, highlighting the core encapsulation platforms driving adoption. Active classes cover retinoids, vitamins (C/E), UV filters, peptides & growth factors, and whitening/brightening agents to meet functional requirements. Applications include skincare, suncare, haircare, and color cosmetics. Product formats encompass serums, creams & lotions, essences/ampoules, and sprays/mists. Regulatory positioning is segmented as Global (EU-compliant), APAC-first, and USA-first. Regionally, the scope spans North America, Europe, East Asia, South Asia & Pacific, Latin America, and the Middle East & Africa.
Insights into the Carrier System Segment with Lipid Nanoparticles Leading in Market Share

Cosmetic Nanoencapsulation Market By Carrier Sys

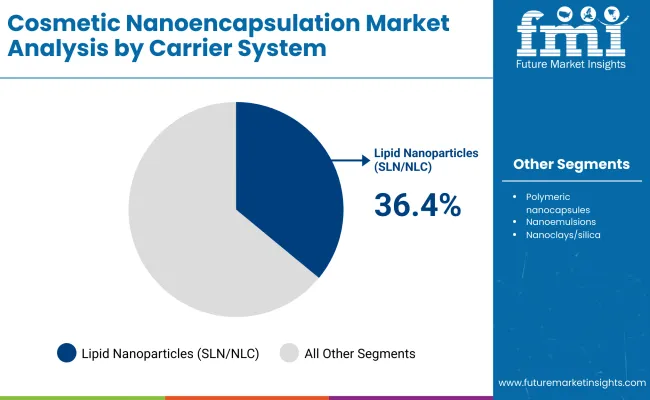
Carrier System Segment Market Value Share, 2025
Lipid Nanoparticles (SLN/NLC) 36.4%
Others 63.6%

The lipid nanoparticles segment is projected to contribute 36.4% of the Global Cosmetic Nanoencapsulation Market revenue in 2025, maintaining its lead as the dominant carrier system. This is driven by ongoing demand for biocompatible, safe, and stable nano-delivery in skincare and suncare. Lipid-based carriers are prioritized by brands seeking to improve retinoid stability, vitamin absorption, and UV filter dispersion across global formulations.

The segment’s growth is also supported by scalable manufacturing technologies and strong EU regulatory acceptance. As polymeric and hybrid systems become more integrated, lipid nanoparticles continue to retain their position as the backbone of cosmetic nanoencapsulation platforms.
Insights into the Carrier System Segment with Lipid Nanoparticles Leading in Market Share

Cosmetic Nanoencapsulation Market By Active Class

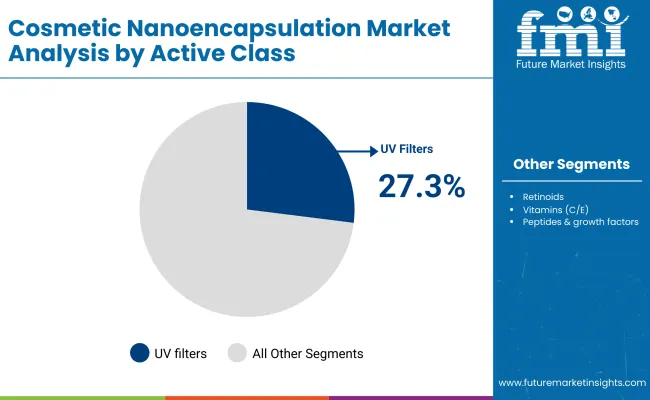
Active Class Segment Market Value Share, 2025
UV filters 27.3%
Others 72.7%

In 2025, UV filters account for 27.3% of the Global Cosmetic Nanoencapsulation Market, valued at USD 560.26 million, highlighting their central role in the fast-growing suncare and multifunctional skincare categories. Encapsulation improves UV filter stability, reduces irritation, and enhances long-lasting protection, making it a preferred technology in both premium and mass-market suncare formulations. Increasing consumer awareness of photoaging, coupled with stricter global sun protection regulations, ensures that UV filter encapsulation will continue to expand in importance.

The “Others” category dominates with 72.7% share, equal to USD 1,494.04 million, covering retinoids, vitamins, peptides, growth factors, and brightening agents. Demand is strongest in anti-aging serums and brightening essences, where encapsulation enhances penetration and protects unstable actives such as vitamin C and retinol. With dermocosmetic and cosmeceutical products gaining popularity worldwide, encapsulated multifunctional actives are expected to sustain their dominance. This balance between UV filters and broader active classes indicates a dual growth path one driven by regulatory-led suncare, and the other by performance-led anti-aging and skin brightening innovations.
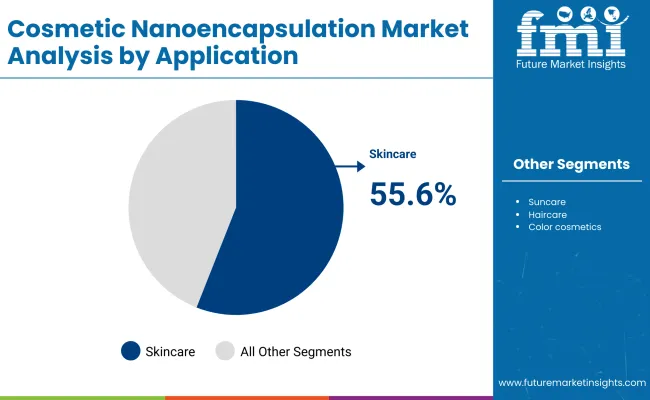
Insights into the Application Segment with Skincare Dominating the Demand

Cosmetic Nanoencapsulation Market By Application

Application Segment Market Value Share, 2025
Skincare 55.6%
Others 44.4%

The skincare segment is forecasted to hold 55.6% of the market share in 2025, led by its application in anti-aging, brightening, and dermocosmetic solutions. These formulations are favored for their efficacy, safety, and premium positioning, making them ideal for mass-market and luxury beauty brands alike.

Its broad product presence across serums, lotions, and essences has facilitated widespread adoption in both Western dermocosmetics and APAC beauty regimens. The segment’s growth is bolstered by encapsulation technologies that improve retinoid tolerance, vitamin stability, and long-lasting UV protection. As consumers increasingly demand visible efficacy and dermatological validation, skincare is expected to continue its dominance in the Global Cosmetic Nanoencapsulation Market.

What are the Drivers, Restraints, and Key Trends of the Global Cosmetic Nanoencapsulation Market?

Drivers

Rising Demand for High-Performance and Stable Cosmetic Formulations

One of the strongest drivers for the Global Cosmetic Nanoencapsulation Market is the growing consumer expectation for high-performance skincare and suncare products. Nanoencapsulation allows actives such as retinoids, vitamin C, peptides, and UV filters to be delivered with higher stability, improved penetration, and controlled release. Traditional formulations often face degradation (e.g., vitamin C oxidizing quickly, retinoids losing potency), which reduces efficacy. Encapsulation technology addresses these limitations by protecting actives from environmental stressors like light, oxygen, and pH fluctuations. This results in longer shelf life and more consistent results, which resonate strongly with both dermocosmetic and luxury beauty consumers. Global brands are actively reformulating hero products with nanoencapsulation, turning it into a key differentiator for anti-aging serums, brightening lotions, and multifunctional suncare.

Regulatory Push and Expansion into APAC Beauty Markets

The regulatory environment, particularly in Europe and East Asia, is another major growth catalyst. EU-compliant nanoencapsulation is increasingly seen as a safety and innovation benchmark, compelling global players to align their R&D and product launches with stricter standards. At the same time, APAC-first innovations in K-beauty and J-beauty are fueling demand for encapsulated actives, especially whitening/brightening agents and lightweight essences/ampoules. These markets are adopting encapsulation faster than Western peers due to consumer openness to science-backed, ingredient-driven claims. With India and China recording CAGRs of 19.6% and 17.4% respectively, regulatory positioning and early APAC adoption are creating a powerful pull factor, making encapsulation technologies indispensable for global rollouts.

Restraints

High Cost of Encapsulation Technology and Limited Scale-Up Efficiency

Despite its advantages, nanoencapsulation remains a cost-intensive process, which restrains mass-market adoption. Technologies like lipid nanoparticles (SLN/NLC) and polymeric nanocapsules require specialized equipment, precise particle size control, and stringent safety validation, which increase manufacturing costs. For many mid-tier brands, the added cost per unit reduces competitiveness, particularly in price-sensitive markets like Latin America or South Asia. Moreover, scale-up efficiency is limited moving from lab-scale encapsulation to industrial-scale production without compromising stability is a complex challenge. This cost barrier means adoption remains skewed toward premium and luxury segments, slowing down penetration into wider beauty categories.

Regulatory Ambiguity and Consumer Perception of “Nanotechnology”

Another restraint is the ambiguity in regulatory approvals and consumer perception of nanotechnology. While the EU has established strict guidelines for nanomaterials in cosmetics, many regions still lack harmonized frameworks. This creates uncertainty for multinational companies, delaying launches or increasing compliance costs. On the consumer side, the word “nano” sometimes raises safety concerns due to associations with nanoparticles in food or environmental toxicity. Negative media coverage or lack of transparent labeling can lead to hesitation, particularly among clean beauty and natural product consumers. Addressing these perceptions with clear education, safety data, and compliance certifications is critical but remains a barrier in market expansion.

Key Trends

Shift Toward Personalization and Smart Beauty Platforms

A defining trend is the integration of nanoencapsulation with AI-driven personalization and smart beauty delivery systems. Encapsulated actives are increasingly used in customized serums, boosters, and ampoules, tailored to skin diagnostics and real-time consumer feedback. Brands are combining encapsulation with digital skin analysis apps, IoT-enabled dispensers, and subscription models, where nano-loaded formulations are adjusted to consumer needs over time. This convergence of biotech, AI, and cosmetic delivery systems is shifting the competitive advantage from product-level innovation to ecosystem-level differentiation, especially among digitally native premium skincare brands.

Expansion of Encapsulation Beyond Skincare into Haircare and Color Cosmetics

While skincare currently accounts for 55.6% of the market, the trend is moving toward wider application in haircare and color cosmetics. In haircare, encapsulated actives such as keratin peptides and vitamins are being developed to enhance scalp absorption and improve hair strength. In color cosmetics, nanoemulsions and silica-based carriers are enabling longer-lasting pigments, lightweight textures, and multifunctional hybrids like makeup with built-in SPF or anti-pollution protection. This broadening of application segments not only diversifies revenue streams but also enhances consumer acceptance by embedding encapsulation benefits into everyday beauty rituals.
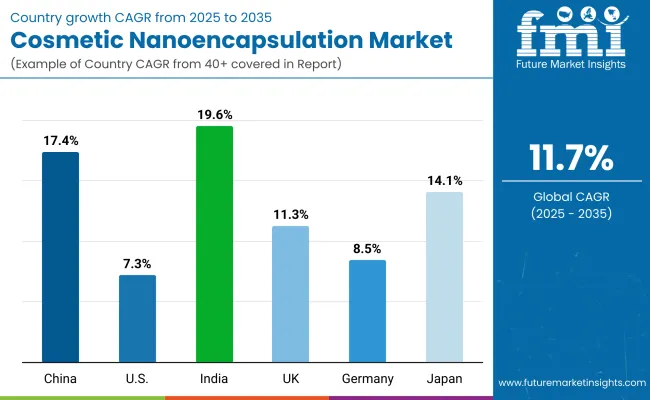
Analysis of Global Cosmetic Nanoencapsulation Market By Key Countries

Country Wise Cosmetic Nanoencapsulation Market

Countries Estimated CAGR (2025 to 2035)
China 17.4%
USA 7.3%
India 19.6%
UK 11.3%
Germany 8.5%
Japan 14.1%

Between 2025 and 2035, the Global Cosmetic Nanoencapsulation Market is expected to see its fastest growth in India (19.6% CAGR) and China (17.4% CAGR), reflecting the strong pull of APAC beauty markets. India’s rapid expansion is tied to rising middle-class demand, increasing adoption of premium skincare, and local manufacturing investments in cosmeceutical actives. China, on the other hand, benefits from its massive consumer base, strong whitening/brightening culture, and heavy innovation pipelines in K-beauty and C-beauty product formats. Japan also stands out with a 14.1% CAGR, supported by its early adoption of encapsulated actives in anti-aging and sun protection categories, aligning with its aging population’s skincare needs.

In contrast, mature Western markets display moderate but steady growth. The USA (7.3% CAGR) continues to expand due to demand for clinical skincare and dermocosmetics, although its share is gradually declining as APAC rises. Germany (8.5% CAGR) and the UK (11.3% CAGR) remain strong within Europe, with Germany benefiting from regulatory compliance strength and dermocosmetic leadership, while the UK grows faster due to its dynamic beauty retail ecosystem and consumer openness to innovative ingredients. Overall, the geographic outlook highlights APAC as the growth engine of cosmetic nanoencapsulation, with Europe and the USA providing a stable but slower-growing revenue base.
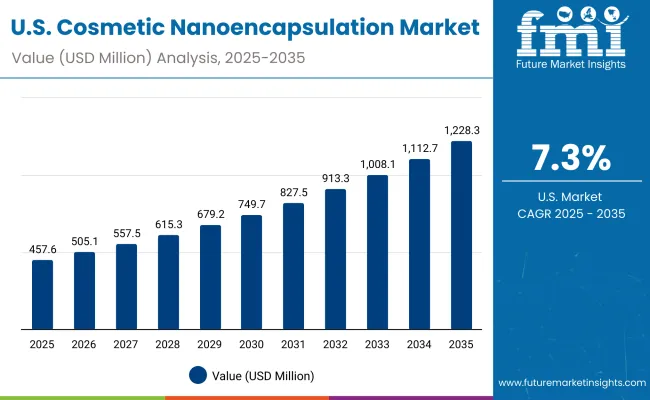
Sales Outlook for Cosmetic Nanoencapsulation in the United States

Usa Cosmetic Nanoencapsulation Market

Year USA Cosmetic Nanoencapsulation Market (USD Million)
2025 457.6
2026 505.1
2027 557.5
2028 615.4
2029 679.2
2030 749.7
2031 827.5
2032 913.4
2033 1008.2
2034 1112.8
2035 1228.3

The Cosmetic Nanoencapsulation Market in the United States is projected to grow at a CAGR of 7.3%, supported by strong demand for advanced skincare and dermocosmetic formulations. Growth is being led by encapsulated retinoids, vitamins, and UV filters incorporated into premium anti-aging serums and OTC cosmeceuticals. Dermatology-focused brands are investing heavily in encapsulated delivery systems to reduce irritation and improve efficacy, while suncare adoption is increasing due to the need for stable UV filters. The market is also seeing adoption in haircare, with encapsulated peptides and growth factors entering scalp health solutions. Regulatory alignment with FDA and rising consumer interest in clinically backed claims are fueling sustained growth.

  • Retinoid-based encapsulation is a major use case driving premium anti-aging skincare.
  • OTC dermocosmetics are integrating nanoencapsulation to reduce irritation and boost delivery.
  • Haircare brands are adopting encapsulated peptides for scalp treatments and hair vitality.

Growth and Expansion Outlook for Cosmetic Nanoencapsulation in the United Kingdom

The Cosmetic Nanoencapsulation Market in the United Kingdom is expected to grow at a CAGR of 11.3%, supported by applications in luxury skincare, hybrid color cosmetics, and dermocosmetic-led retail innovation. Premium brands are accelerating usage of encapsulated vitamins and peptides to improve claims around skin renewal, brightening, and hydration. Retail chains and online platforms are pushing EU-compliant nanoencapsulation as part of their “science-based beauty” product lines. Institutions and consumer groups have encouraged transparent labeling of nano-formulations, which is increasing consumer trust. The combination of EU regulatory standards, a dynamic retail ecosystem, and strong positioning in luxury skincare continues to fuel adoption.

  • Premium skincare brands are using nanoencapsulation for stability of vitamins and peptides.
  • Beauty retailers are highlighting EU-compliant nanoencapsulation for consumer trust.
  • Hybrid formats like color cosmetics with brightening or SPF encapsulation are gaining traction.

Growth and Expansion Outlook for Cosmetic Nanoencapsulation in India

India is witnessing rapid growth in the Cosmetic Nanoencapsulation Market, which is forecast to expand at a CAGR of 19.6% through 2035, the highest globally. Growth is being driven by the fast adoption of encapsulated brightening agents, UV filters, and vitamins in mass-premium skincare and suncare products. Local and multinational players are expanding their encapsulation capabilities to cater to tier-2 and tier-3 cities, where awareness of dermatology-backed products is rising. Educational and vocational institutions are also beginning to explore encapsulation as part of cosmetic science programs, adding to domestic R&D capabilities. Public interest in skin-brightening, anti-pollution, and protective formulations is expected to accelerate expansion.

  • Brightening agents and UV filter encapsulation are driving mass-market and premium launches.
  • Tier-2 and tier-3 cities are witnessing faster adoption of nanoencapsulated skincare.
  • Local institutes are training professionals in cosmetic nanoencapsulation science.

Sales Outlook for Cosmetic Nanoencapsulation in China

The Cosmetic Nanoencapsulation Market in China is expected to grow at a CAGR of 17.4%, among the highest across leading economies. This momentum is fueled by demand for whitening/brightening agents, peptide-based anti-aging, and UV filter encapsulation, especially within C-beauty and K-beauty influenced formats. Domestic brands are innovating rapidly with encapsulated serums, essences, and sprays, while international players are entering with premium dermocosmetic formulations. Municipal and regional consumer campaigns on sun protection and skin health are also expanding the suncare base. Competitive innovation by local ingredient firms is lowering costs, making encapsulation more accessible to mid-tier and online-first brands.

  • Whitening and brightening encapsulation dominates C-beauty skincare launches.
  • UV filter encapsulation is becoming central to China’s expanding suncare market.
  • Local firms are offering cost-competitive encapsulation, enabling wider adoption across brands.
Countries 2025 Share (%)
USA 22.3%
China 11.4%
Japan 6.6%
Germany 14.7%
UK 7.7%
India 4.7%
Countries 2035 Share (%)
USA 19.8%
China 12.3%
Japan 8.0%
Germany 12.8%
UK 6.9%
India 5.6%

Opportunity Analysis of United States Cosmetic Nanoencapsulation Market

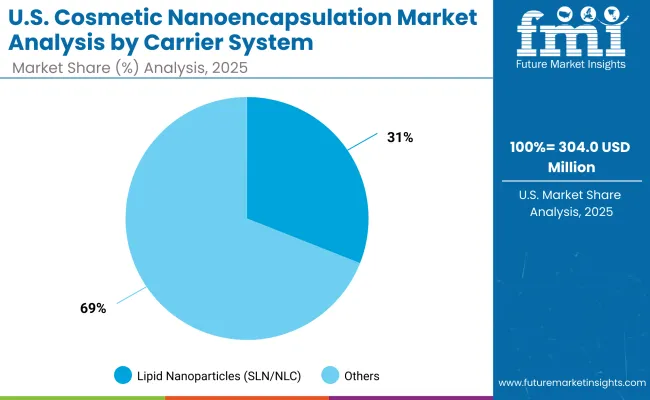
Us Cosmetic Nanoencapsulation Market By Carrier System

Carrier System Segment Market Value Share, 2025
Lipid Nanoparticles (SLN/NLC) 30.7%
Others 63.6%

The Cosmetic Nanoencapsulation Market in the United States is valued at USD 304.02 million in 2025, with lipid nanoparticles leading at 30.7% due to their safety, biocompatibility, and proven track record in dermocosmetics. These carriers are particularly important for encapsulating retinoids, peptides, and vitamins, which dominate the USA premium skincare segment. Their use reduces irritation, improves penetration, and ensures controlled release, aligning with consumer demand for dermatology-backed and OTC-approved products.

The strong base of clinical skincare, anti-aging serums, and suncare products is fueling lipid nanoparticle adoption. Other carriers, particularly nanoemulsions, are gaining relevance in lightweight mists and hybrid color cosmetics, but lipid-based systems remain the backbone for anti-aging and UV filter applications. As USA regulations prioritize safety and efficacy, encapsulated actives are expected to expand into mass-market OTC channels over the next decade.
  • Market size for the USA in 2025 is USD 304.02 million
  • Global market share is approximately 22.3%
  • Lipid nanoparticles lead at 30.7% due to strong dermocosmetic positioning

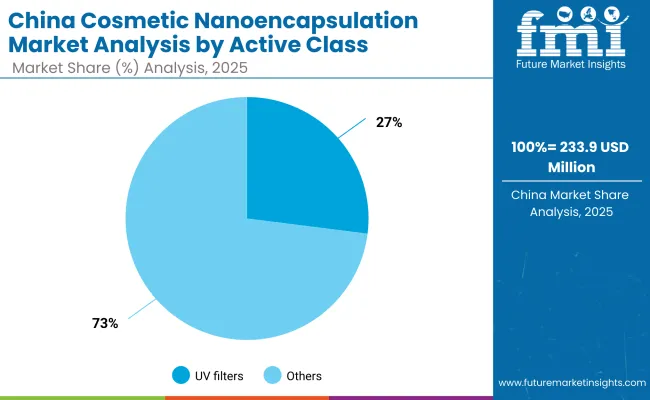
Opportunity Analysis of China Cosmetic Nanoencapsulation Market

China Cosmetic Nanoencapsulation Market By Active Class

Active Class Segment Market Value Share, 2025
UV filters 27.3%
Others 72.7%

The Cosmetic Nanoencapsulation Market in China is valued at USD 233.9 million in 2025, with UV filters leading at 27.5% as suncare becomes a central part of consumer routines. Rising concerns around skin health, photoaging, and regulatory campaigns on sun protection are making encapsulated UV filters indispensable. These systems enhance stability, extend efficacy, and reduce irritation, which resonate strongly with local consumers.

At the same time, whitening and brightening agents encapsulated in nanoemulsions and nanocapsules are highly sought after in China’s beauty culture. Serums and essences dominate the format landscape, while sprays and hybrid formulations are seeing faster uptake. Competitive innovation by local firms is pushing down production costs, enabling encapsulated actives to enter mid-tier and online-first C-beauty brands.
  • Market size for China in 2025 is USD 233.9 million
  • Global market share is approximately 11.4%
  • UV filters lead at 27.5% due to strong demand for high-performance suncare

Competitive Landscape of Global Cosmetic Nanoencapsulation Market

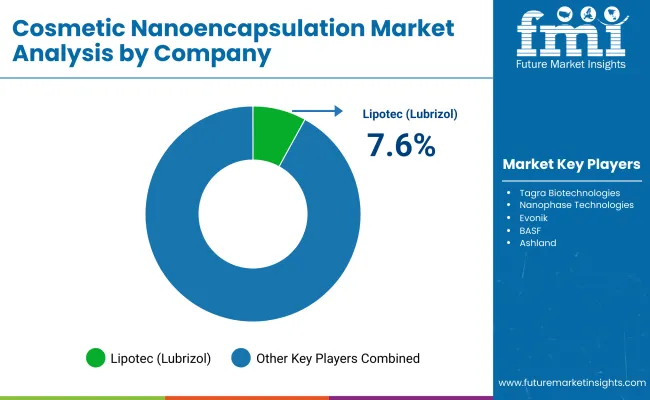
Cosmetic Nanoencapsulation Market By Comapny

Company Global Value Share 2025
Lipotec (Lubrizol) 7.6%
Others 92.4%

The Cosmetic Nanoencapsulation Market is moderately fragmented, with global ingredient leaders, mid-sized innovators, and niche-focused specialists competing across skincare, suncare, and color cosmetics. Global technology leaders such as Lipotec (Lubrizol), Evonik, BASF, and Croda hold significant market share, driven by advanced lipid and polymeric encapsulation platforms, clinical validation, and strong partnerships with multinational beauty brands. Their strategies emphasize regulatory-compliant actives, AI-assisted formulation design, and multifunctional delivery systems that extend into dermocosmetics and OTC categories.

Established mid-sized players, including Tagra Biotechnologies, Gattefossé, Seppic, and Lucas Meyer Cosmetics, cater to the rising demand for portable encapsulation formats such as nanoemulsions, ampoules, and sprays. These companies are accelerating adoption through ingredient–format innovation, making them highly relevant for APAC-driven launches in skincare and hybrid cosmetics.

Specialized providers such as Nanophase Technologies and Ashland focus on UV filter encapsulation, mineral-based systems, and application-specific nano-delivery for suncare and color cosmetics. Their strength lies in customization and alignment with regional consumer demands rather than global dominance.Competitive differentiation is shifting away from raw encapsulation technology toward ecosystem integration that includes personalized beauty platforms, regulatory credibility, and subscription-based models tied to skincare personalization and dermocosmetic diagnostics.

Key Developments in Global Cosmetic NanoencapsulationMarket

  • On March 12, 2024, Lipotec (Lubrizol) launched a new nanoencapsulated retinol system designed to minimize irritation while improving penetration in anti-aging serums. The technology was presented as a breakthrough for combining high potency with consumer tolerance.
  • On July 5, 2024, Tagra Biotechnologies introduced a patented encapsulated UV filter platform for suncare, claiming enhanced photostability and transparency. The innovation targeted global sunscreen reformulations amid tightening EU and USA regulatory standards.

Scope of the Report

Item Value
Quantitative Units USD 2,054.3 million
Carrier System Lipid nanoparticles (SLN/NLC), Polymeric nanocapsules, Nanoemulsions, Nanoclays /silica
Active Class Retinoids, Vitamins (C/E), UV filters, Peptides & growth factors, Whitening/brightening agents
Application Skincare, Suncare, Haircare, Color cosmetics
Product Format Serums, Creams & lotions, Essences/ampoules, Sprays/mists
End-use Industry Automotive, Aerospace & defense, Consumer electronics, Healthcare, Oil & gas, Energy and power, and Others
Regions Covered North America, Europe, Asia-Pacific, Latin America, Middle East & Africa
Country Covered United States, Canada, Germany, France, United Kingdom, China, Japan, India, Brazil, South Africa
Key Companies Profiled Lipotec (Lubrizol), Tagra Biotechnologies, Nanophase Technologies, Evonik, BASF, Ashland, Croda, Seppic, Gattefossé, Lucas Meyer Cosmetics
Additional Attributes Dollar sales by carrier system, active class, application, and geography; adoption trends in skincare, suncare, and hybrid formats; rising demand for serums, ampoules, and multifunctional creams; sector-specific growth in dermocosmetics and premium beauty; regulatory-driven product positioning across EU, APAC, and USA; integration of nano -delivery systems into AI-personalized beauty; regional trends influenced by sun protection awareness, anti-aging demand, and brightening culture; innovations in lipid nanoparticles, nanoemulsions, and polymeric nanocapsules .

Key Segments

By Carrier System:

  • Lipid nanoparticles (SLN/NLC)
  • Polymeric nanocapsules
  • Nanoemulsions
  • Nanoclays/silica

By Active Class:

  • Retinoids
  • Vitamins (C/E)
  • UV filters
  • Peptides & growth factors
  • Whitening/brightening agents

By Application:

  • Skincare
  • Suncare
  • Haircare
  • Color cosmetics

By Product Format:

  • Serums
  • Creams & lotions
  • Essences/ampoules
  • Sprays/mists

By Regulatory Positioning:

  • Global (EU-compliant)
  • APAC-first
  • USA-first

By Region:

  • North America
  • Latin America
  • Europe
  • East Asia
  • South Asia & Pacific
  • Middle East and Africa

Table of Content

  1. Executive Summary
    • Global Market Outlook
    • Demand-side Trends
    • Supply-side Trends
    • Technology Roadmap Analysis
    • Analysis and Recommendations
  2. Market Overview
    • Market Coverage / Taxonomy
    • Market Definition / Scope / Limitations
  3. Market Background
    • Market Dynamics
      • Drivers
      • Restraints
      • Opportunity
      • Trends
    • Scenario Forecast
      • Demand in Optimistic Scenario
      • Demand in Likely Scenario
      • Demand in Conservative Scenario
    • Opportunity Map Analysis
    • Product Life Cycle Analysis
    • Supply Chain Analysis
      • Supply Side Participants and their Roles
        • Producers
        • Mid-Level Participants (Traders/ Agents/ Brokers)
        • Wholesalers and Distributors
      • Value Added and Value Created at Node in the Supply Chain
      • List of Raw Material Suppliers
      • List of Existing and Potential Buyer’s
    • Investment Feasibility Matrix
    • Value Chain Analysis
      • Profit Margin Analysis
      • Wholesalers and Distributors
      • Retailers
    • PESTLE and Porter’s Analysis
    • Regulatory Landscape
      • By Key Regions
      • By Key Countries
    • Regional Parent Market Outlook
    • Production and Consumption Statistics
    • Import and Export Statistics
  4. Global Market Analysis 2020 to 2024 and Forecast, 2025 to 2035
    • Historical Market Size Value (USD Million) & Volume (Units) Analysis, 2020 to 2024
    • Current and Future Market Size Value (USD Million) & Volume (Units) Projections, 2025 to 2035
      • Y-o-Y Growth Trend Analysis
      • Absolute $ Opportunity Analysis
  5. Global Market Analysis 2020 to 2024 and Forecast 2025 to 2035, By Carrier System
    • Introduction / Key Findings
    • Historical Market Size Value (USD Million) & Volume (Units) Analysis By Carrier System, 2020 to 2024
    • Current and Future Market Size Value (USD Million) & Volume (Units) Analysis and Forecast By Carrier System, 2025 to 2035
      • Lipid nanoparticles (SLN/NLC)
      • Polymeric nanocapsules
      • Nanoemulsions
      • Nanoclays/silica
    • Y-o-Y Growth Trend Analysis By Carrier System, 2020 to 2024
    • Absolute $ Opportunity Analysis By Carrier System, 2025 to 2035
  6. Global Market Analysis 2020 to 2024 and Forecast 2025 to 2035, By Active Class
    • Introduction / Key Findings
    • Historical Market Size Value (USD Million) & Volume (Units) Analysis By Active Class, 2020 to 2024
    • Current and Future Market Size Value (USD Million) & Volume (Units) Analysis and Forecast By Active Class, 2025 to 2035
      • Retinoids
      • Vitamins (C/E)
      • UV filters
      • Peptides & growth factors
      • Whitening/brightening agents
    • Y-o-Y Growth Trend Analysis By Active Class, 2020 to 2024
    • Absolute $ Opportunity Analysis By Active Class, 2025 to 2035
  7. Global Market Analysis 2020 to 2024 and Forecast 2025 to 2035, By Application
    • Introduction / Key Findings
    • Historical Market Size Value (USD Million) & Volume (Units) Analysis By Application, 2020 to 2024
    • Current and Future Market Size Value (USD Million) & Volume (Units) Analysis and Forecast By Application, 2025 to 2035
      • Skincare
      • Suncare
      • Haircare
      • Color cosmetics
    • Y-o-Y Growth Trend Analysis By Application, 2020 to 2024
    • Absolute $ Opportunity Analysis By Application, 2025 to 2035
  8. Global Market Analysis 2020 to 2024 and Forecast 2025 to 2035, By Product Format
    • Introduction / Key Findings
    • Historical Market Size Value (USD Million) & Volume (Units) Analysis By Product Format, 2020 to 2024
    • Current and Future Market Size Value (USD Million) & Volume (Units) Analysis and Forecast By Product Format, 2025 to 2035
      • Serums
      • Creams & lotions
      • Essences/ampoules
      • Sprays/mists
    • Y-o-Y Growth Trend Analysis By Product Format, 2020 to 2024
    • Absolute $ Opportunity Analysis By Product Format, 2025 to 2035
  9. Global Market Analysis 2020 to 2024 and Forecast 2025 to 2035, By Regulatory Positioning
    • Introduction / Key Findings
    • Historical Market Size Value (USD Million) & Volume (Units) Analysis By Regulatory Positioning, 2020 to 2024
    • Current and Future Market Size Value (USD Million) & Volume (Units) Analysis and Forecast By Regulatory Positioning, 2025 to 2035
      • Global (EU-compliant)
      • APAC-first
      • U.S.-first
    • Y-o-Y Growth Trend Analysis By Regulatory Positioning, 2020 to 2024
    • Absolute $ Opportunity Analysis By Regulatory Positioning, 2025 to 2035
  10. Global Market Analysis 2020 to 2024 and Forecast 2025 to 2035, By Region
    • Introduction
    • Historical Market Size Value (USD Million) & Volume (Units) Analysis By Region, 2020 to 2024
    • Current Market Size Value (USD Million) & Volume (Units) Analysis and Forecast By Region, 2025 to 2035
      • North America
      • Latin America
      • Europe
      • East Asia
      • South Asia & Pacific
      • Middle East and Africa
    • Market Attractiveness Analysis By Region
  11. North America Market Analysis 2020 to 2024 and Forecast 2025 to 2035, By Country
    • Historical Market Size Value (USD Million) & Volume (Units) Trend Analysis By Market Taxonomy, 2020 to 2024
    • Market Size Value (USD Million) & Volume (Units) Forecast By Market Taxonomy, 2025 to 2035
      • By Country
        • U.S.
        • Canada
      • By Carrier System
      • By Active Class
      • By Application
      • By Product Format
      • By Regulatory Positioning
    • Market Attractiveness Analysis
      • By Country
      • By Carrier System
      • By Active Class
      • By Application
      • By Product Format
      • By Regulatory Positioning
    • Key Takeaways
  12. Latin America Market Analysis 2020 to 2024 and Forecast 2025 to 2035, By Country
    • Historical Market Size Value (USD Million) & Volume (Units) Trend Analysis By Market Taxonomy, 2020 to 2024
    • Market Size Value (USD Million) & Volume (Units) Forecast By Market Taxonomy, 2025 to 2035
      • By Country
        • Brazil
        • Mexico
        • Colombia
        • Rest of Latin America
      • By Carrier System
      • By Active Class
      • By Application
      • By Product Format
      • By Regulatory Positioning
    • Market Attractiveness Analysis
      • By Country
      • By Carrier System
      • By Active Class
      • By Application
      • By Product Format
      • By Regulatory Positioning
    • Key Takeaways
  13. Europe Market Analysis 2020 to 2024 and Forecast 2025 to 2035, By Country
    • Historical Market Size Value (USD Million) & Volume (Units) Trend Analysis By Market Taxonomy, 2020 to 2024
    • Market Size Value (USD Million) & Volume (Units) Forecast By Market Taxonomy, 2025 to 2035
      • By Country
        • Germany
        • U.K.
        • France
        • Italy
        • Spain
        • Belgium
        • Netherlands
        • Nordic
        • Switzerland
        • Russia
        • Poland
        • Rest of Europe
      • By Carrier System
      • By Active Class
      • By Application
      • By Product Format
      • By Regulatory Positioning
    • Market Attractiveness Analysis
      • By Country
      • By Carrier System
      • By Active Class
      • By Application
      • By Product Format
      • By Regulatory Positioning
    • Key Takeaways
  14. East Asia Market Analysis 2020 to 2024 and Forecast 2025 to 2035, By Country
    • Historical Market Size Value (USD Million) & Volume (Units) Trend Analysis By Market Taxonomy, 2020 to 2024
    • Market Size Value (USD Million) & Volume (Units) Forecast By Market Taxonomy, 2025 to 2035
      • By Country
        • China
        • Japan
        • South Korea
      • By Carrier System
      • By Active Class
      • By Application
      • By Product Format
      • By Regulatory Positioning
    • Market Attractiveness Analysis
      • By Country
      • By Carrier System
      • By Active Class
      • By Application
      • By Product Format
      • By Regulatory Positioning
    • Key Takeaways
  15. South Asia & Pacific Market Analysis 2020 to 2024 and Forecast 2025 to 2035, By Country
    • Historical Market Size Value (USD Million) & Volume (Units) Trend Analysis By Market Taxonomy, 2020 to 2024
    • Market Size Value (USD Million) & Volume (Units) Forecast By Market Taxonomy, 2025 to 2035
      • By Country
        • India
        • Thailand
        • Malaysia
        • Indonesia
        • Singapore
        • Vietnam
        • Australia
        • New Zealand
        • Rest of South Asia
      • By Carrier System
      • By Active Class
      • By Application
      • By Product Format
      • By Regulatory Positioning
    • Market Attractiveness Analysis
      • By Country
      • By Carrier System
      • By Active Class
      • By Application
      • By Product Format
      • By Regulatory Positioning
    • Key Takeaways
  16. Middle East and Africa Market Analysis 2020 to 2024 and Forecast 2025 to 2035, By Country
    • Historical Market Size Value (USD Million) & Volume (Units) Trend Analysis By Market Taxonomy, 2020 to 2024
    • Market Size Value (USD Million) & Volume (Units) Forecast By Market Taxonomy, 2025 to 2035
      • By Country
        • Turkey
        • UAE
        • Saudi Arabia
        • Israel
        • Other GCC Countries
        • North Africa
        • South Africa
      • By Carrier System
      • By Active Class
      • By Application
      • By Product Format
      • By Regulatory Positioning
    • Market Attractiveness Analysis
      • By Country
      • By Carrier System
      • By Active Class
      • By Application
      • By Product Format
      • By Regulatory Positioning
    • Key Takeaways
  17. Key Countries Market Analysis
    • U.S.
      • Pricing Analysis
      • Market Share Analysis, 2024
        • By Carrier System
        • By Active Class
        • By Application
        • By Product Format
        • By Regulatory Positioning
    • Canada
      • Pricing Analysis
      • Market Share Analysis, 2024
        • By Carrier System
        • By Active Class
        • By Application
        • By Product Format
        • By Regulatory Positioning
    • Brazil
      • Pricing Analysis
      • Market Share Analysis, 2024
        • By Carrier System
        • By Active Class
        • By Application
        • By Product Format
        • By Regulatory Positioning
    • Mexico
      • Pricing Analysis
      • Market Share Analysis, 2024
        • By Carrier System
        • By Active Class
        • By Application
        • By Product Format
        • By Regulatory Positioning
    • Colombia
      • Pricing Analysis
      • Market Share Analysis, 2024
        • By Carrier System
        • By Active Class
        • By Application
        • By Product Format
        • By Regulatory Positioning
    • Germany
      • Pricing Analysis
      • Market Share Analysis, 2024
        • By Carrier System
        • By Active Class
        • By Application
        • By Product Format
        • By Regulatory Positioning
    • U.K.
      • Pricing Analysis
      • Market Share Analysis, 2024
        • By Carrier System
        • By Active Class
        • By Application
        • By Product Format
        • By Regulatory Positioning
    • France
      • Pricing Analysis
      • Market Share Analysis, 2024
        • By Carrier System
        • By Active Class
        • By Application
        • By Product Format
        • By Regulatory Positioning
    • Italy
      • Pricing Analysis
      • Market Share Analysis, 2024
        • By Carrier System
        • By Active Class
        • By Application
        • By Product Format
        • By Regulatory Positioning
    • Spain
      • Pricing Analysis
      • Market Share Analysis, 2024
        • By Carrier System
        • By Active Class
        • By Application
        • By Product Format
        • By Regulatory Positioning
    • Belgium
      • Pricing Analysis
      • Market Share Analysis, 2024
        • By Carrier System
        • By Active Class
        • By Application
        • By Product Format
        • By Regulatory Positioning
    • Netherlands
      • Pricing Analysis
      • Market Share Analysis, 2024
        • By Carrier System
        • By Active Class
        • By Application
        • By Product Format
        • By Regulatory Positioning
    • Nordic
      • Pricing Analysis
      • Market Share Analysis, 2024
        • By Carrier System
        • By Active Class
        • By Application
        • By Product Format
        • By Regulatory Positioning
    • Switzerland
      • Pricing Analysis
      • Market Share Analysis, 2024
        • By Carrier System
        • By Active Class
        • By Application
        • By Product Format
        • By Regulatory Positioning
    • Russia
      • Pricing Analysis
      • Market Share Analysis, 2024
        • By Carrier System
        • By Active Class
        • By Application
        • By Product Format
        • By Regulatory Positioning
    • Poland
      • Pricing Analysis
      • Market Share Analysis, 2024
        • By Carrier System
        • By Active Class
        • By Application
        • By Product Format
        • By Regulatory Positioning
    • China
      • Pricing Analysis
      • Market Share Analysis, 2024
        • By Carrier System
        • By Active Class
        • By Application
        • By Product Format
        • By Regulatory Positioning
    • Japan
      • Pricing Analysis
      • Market Share Analysis, 2024
        • By Carrier System
        • By Active Class
        • By Application
        • By Product Format
        • By Regulatory Positioning
    • South Korea
      • Pricing Analysis
      • Market Share Analysis, 2024
        • By Carrier System
        • By Active Class
        • By Application
        • By Product Format
        • By Regulatory Positioning
    • India
      • Pricing Analysis
      • Market Share Analysis, 2024
        • By Carrier System
        • By Active Class
        • By Application
        • By Product Format
        • By Regulatory Positioning
    • Thailand
      • Pricing Analysis
      • Market Share Analysis, 2024
        • By Carrier System
        • By Active Class
        • By Application
        • By Product Format
        • By Regulatory Positioning
    • Indonesia
      • Pricing Analysis
      • Market Share Analysis, 2024
        • By Carrier System
        • By Active Class
        • By Application
        • By Product Format
        • By Regulatory Positioning
    • Australia
      • Pricing Analysis
      • Market Share Analysis, 2024
        • By Carrier System
        • By Active Class
        • By Application
        • By Product Format
        • By Regulatory Positioning
    • New Zealand
      • Pricing Analysis
      • Market Share Analysis, 2024
        • By Carrier System
        • By Active Class
        • By Application
        • By Product Format
        • By Regulatory Positioning
    • Turkey
      • Pricing Analysis
      • Market Share Analysis, 2024
        • By Carrier System
        • By Active Class
        • By Application
        • By Product Format
        • By Regulatory Positioning
    • UAE
      • Pricing Analysis
      • Market Share Analysis, 2024
        • By Carrier System
        • By Active Class
        • By Application
        • By Product Format
        • By Regulatory Positioning
    • Saudi Arabia
      • Pricing Analysis
      • Market Share Analysis, 2024
        • By Carrier System
        • By Active Class
        • By Application
        • By Product Format
        • By Regulatory Positioning
    • Israel
      • Pricing Analysis
      • Market Share Analysis, 2024
        • By Carrier System
        • By Active Class
        • By Application
        • By Product Format
        • By Regulatory Positioning
    • North Africa
      • Pricing Analysis
      • Market Share Analysis, 2024
        • By Carrier System
        • By Active Class
        • By Application
        • By Product Format
        • By Regulatory Positioning
    • South Africa
      • Pricing Analysis
      • Market Share Analysis, 2024
        • By Carrier System
        • By Active Class
        • By Application
        • By Product Format
        • By Regulatory Positioning
  18. Market Structure Analysis
    • Competition Dashboard
    • Competition Benchmarking
    • Market Share Analysis of Top Players
      • By Regional
      • By Carrier System
      • By Active Class
      • By Application
      • By Product Format
      • By Regulatory Positioning
  19. Competition Analysis
    • Competition Deep Dive
      • Lipotec (Lubrizol)
        • Overview
        • Product Portfolio
        • Profitability by Market Segments (Product/Age /Sales Channel/Region)
        • Sales Footprint
        • Strategy Overview
          • Marketing Strategy
          • Product Strategy
          • Channel Strategy
      • Tagra Biotechnologies
        • Overview
        • Product Portfolio
        • Profitability by Market Segments (Product/Age /Sales Channel/Region)
        • Sales Footprint
        • Strategy Overview
          • Marketing Strategy
          • Product Strategy
          • Channel Strategy
      • Nanophase Technologies
        • Overview
        • Product Portfolio
        • Profitability by Market Segments (Product/Age /Sales Channel/Region)
        • Sales Footprint
        • Strategy Overview
          • Marketing Strategy
          • Product Strategy
          • Channel Strategy
      • Evonik
        • Overview
        • Product Portfolio
        • Profitability by Market Segments (Product/Age /Sales Channel/Region)
        • Sales Footprint
        • Strategy Overview
          • Marketing Strategy
          • Product Strategy
          • Channel Strategy
      • BASF
        • Overview
        • Product Portfolio
        • Profitability by Market Segments (Product/Age /Sales Channel/Region)
        • Sales Footprint
        • Strategy Overview
          • Marketing Strategy
          • Product Strategy
          • Channel Strategy
      • Ashland
        • Overview
        • Product Portfolio
        • Profitability by Market Segments (Product/Age /Sales Channel/Region)
        • Sales Footprint
        • Strategy Overview
          • Marketing Strategy
          • Product Strategy
          • Channel Strategy
      • Croda
        • Overview
        • Product Portfolio
        • Profitability by Market Segments (Product/Age /Sales Channel/Region)
        • Sales Footprint
        • Strategy Overview
          • Marketing Strategy
          • Product Strategy
          • Channel Strategy
      • Seppic
        • Overview
        • Product Portfolio
        • Profitability by Market Segments (Product/Age /Sales Channel/Region)
        • Sales Footprint
        • Strategy Overview
          • Marketing Strategy
          • Product Strategy
          • Channel Strategy
      • Gattefossé
        • Overview
        • Product Portfolio
        • Profitability by Market Segments (Product/Age /Sales Channel/Region)
        • Sales Footprint
        • Strategy Overview
          • Marketing Strategy
          • Product Strategy
          • Channel Strategy
      • Lucas Meyer Cosmetics
        • Overview
        • Product Portfolio
        • Profitability by Market Segments (Product/Age /Sales Channel/Region)
        • Sales Footprint
        • Strategy Overview
          • Marketing Strategy
          • Product Strategy
          • Channel Strategy
  20. Assumptions & Acronyms Used
  21. Research Methodology

List of Tables

  • Table 1: Global Market Value (USD Million) Forecast by Region, 2020-2035
  • Table 2: Global Market Volume (Units) Forecast by Region, 2020-2035
  • Table 3: Global Market Value (USD Million) Forecast by Carrier System, 2020-2035
  • Table 4: Global Market Volume (Units) Forecast by Carrier System, 2020-2035
  • Table 5: Global Market Value (USD Million) Forecast by Active Class, 2020-2035
  • Table 6: Global Market Volume (Units) Forecast by Active Class, 2020-2035
  • Table 7: Global Market Value (USD Million) Forecast by Application, 2020-2035
  • Table 8: Global Market Volume (Units) Forecast by Application, 2020-2035
  • Table 9: Global Market Value (USD Million) Forecast by Product Format, 2020-2035
  • Table 10: Global Market Volume (Units) Forecast by Product Format, 2020-2035
  • Table 11: Global Market Value (USD Million) Forecast by Regulatory Positioning, 2020-2035
  • Table 12: Global Market Volume (Units) Forecast by Regulatory Positioning, 2020-2035
  • Table 13: North America Market Value (USD Million) Forecast by Country, 2020-2035
  • Table 14: North America Market Volume (Units) Forecast by Country, 2020-2035
  • Table 15: North America Market Value (USD Million) Forecast by Carrier System, 2020-2035
  • Table 16: North America Market Volume (Units) Forecast by Carrier System, 2020-2035
  • Table 17: North America Market Value (USD Million) Forecast by Active Class, 2020-2035
  • Table 18: North America Market Volume (Units) Forecast by Active Class, 2020-2035
  • Table 19: North America Market Value (USD Million) Forecast by Application, 2020-2035
  • Table 20: North America Market Volume (Units) Forecast by Application, 2020-2035
  • Table 21: North America Market Value (USD Million) Forecast by Product Format, 2020-2035
  • Table 22: North America Market Volume (Units) Forecast by Product Format, 2020-2035
  • Table 23: North America Market Value (USD Million) Forecast by Regulatory Positioning, 2020-2035
  • Table 24: North America Market Volume (Units) Forecast by Regulatory Positioning, 2020-2035
  • Table 25: Latin America Market Value (USD Million) Forecast by Country, 2020-2035
  • Table 26: Latin America Market Volume (Units) Forecast by Country, 2020-2035
  • Table 27: Latin America Market Value (USD Million) Forecast by Carrier System, 2020-2035
  • Table 28: Latin America Market Volume (Units) Forecast by Carrier System, 2020-2035
  • Table 29: Latin America Market Value (USD Million) Forecast by Active Class, 2020-2035
  • Table 30: Latin America Market Volume (Units) Forecast by Active Class, 2020-2035
  • Table 31: Latin America Market Value (USD Million) Forecast by Application, 2020-2035
  • Table 32: Latin America Market Volume (Units) Forecast by Application, 2020-2035
  • Table 33: Latin America Market Value (USD Million) Forecast by Product Format, 2020-2035
  • Table 34: Latin America Market Volume (Units) Forecast by Product Format, 2020-2035
  • Table 35: Latin America Market Value (USD Million) Forecast by Regulatory Positioning, 2020-2035
  • Table 36: Latin America Market Volume (Units) Forecast by Regulatory Positioning, 2020-2035
  • Table 37: Europe Market Value (USD Million) Forecast by Country, 2020-2035
  • Table 38: Europe Market Volume (Units) Forecast by Country, 2020-2035
  • Table 39: Europe Market Value (USD Million) Forecast by Carrier System, 2020-2035
  • Table 40: Europe Market Volume (Units) Forecast by Carrier System, 2020-2035
  • Table 41: Europe Market Value (USD Million) Forecast by Active Class, 2020-2035
  • Table 42: Europe Market Volume (Units) Forecast by Active Class, 2020-2035
  • Table 43: Europe Market Value (USD Million) Forecast by Application, 2020-2035
  • Table 44: Europe Market Volume (Units) Forecast by Application, 2020-2035
  • Table 45: Europe Market Value (USD Million) Forecast by Product Format, 2020-2035
  • Table 46: Europe Market Volume (Units) Forecast by Product Format, 2020-2035
  • Table 47: Europe Market Value (USD Million) Forecast by Regulatory Positioning, 2020-2035
  • Table 48: Europe Market Volume (Units) Forecast by Regulatory Positioning, 2020-2035
  • Table 49: East Asia Market Value (USD Million) Forecast by Country, 2020-2035
  • Table 50: East Asia Market Volume (Units) Forecast by Country, 2020-2035
  • Table 51: East Asia Market Value (USD Million) Forecast by Carrier System, 2020-2035
  • Table 52: East Asia Market Volume (Units) Forecast by Carrier System, 2020-2035
  • Table 53: East Asia Market Value (USD Million) Forecast by Active Class, 2020-2035
  • Table 54: East Asia Market Volume (Units) Forecast by Active Class, 2020-2035
  • Table 55: East Asia Market Value (USD Million) Forecast by Application, 2020-2035
  • Table 56: East Asia Market Volume (Units) Forecast by Application, 2020-2035
  • Table 57: East Asia Market Value (USD Million) Forecast by Product Format, 2020-2035
  • Table 58: East Asia Market Volume (Units) Forecast by Product Format, 2020-2035
  • Table 59: East Asia Market Value (USD Million) Forecast by Regulatory Positioning, 2020-2035
  • Table 60: East Asia Market Volume (Units) Forecast by Regulatory Positioning, 2020-2035
  • Table 61: South Asia & Pacific Market Value (USD Million) Forecast by Country, 2020-2035
  • Table 62: South Asia & Pacific Market Volume (Units) Forecast by Country, 2020-2035
  • Table 63: South Asia & Pacific Market Value (USD Million) Forecast by Carrier System, 2020-2035
  • Table 64: South Asia & Pacific Market Volume (Units) Forecast by Carrier System, 2020-2035
  • Table 65: South Asia & Pacific Market Value (USD Million) Forecast by Active Class, 2020-2035
  • Table 66: South Asia & Pacific Market Volume (Units) Forecast by Active Class, 2020-2035
  • Table 67: South Asia & Pacific Market Value (USD Million) Forecast by Application, 2020-2035
  • Table 68: South Asia & Pacific Market Volume (Units) Forecast by Application, 2020-2035
  • Table 69: South Asia & Pacific Market Value (USD Million) Forecast by Product Format, 2020-2035
  • Table 70: South Asia & Pacific Market Volume (Units) Forecast by Product Format, 2020-2035
  • Table 71: South Asia & Pacific Market Value (USD Million) Forecast by Regulatory Positioning, 2020-2035
  • Table 72: South Asia & Pacific Market Volume (Units) Forecast by Regulatory Positioning, 2020-2035
  • Table 73: Middle East and Africa Market Value (USD Million) Forecast by Country, 2020-2035
  • Table 74: Middle East and Africa Market Volume (Units) Forecast by Country, 2020-2035
  • Table 75: Middle East and Africa Market Value (USD Million) Forecast by Carrier System, 2020-2035
  • Table 76: Middle East and Africa Market Volume (Units) Forecast by Carrier System, 2020-2035
  • Table 77: Middle East and Africa Market Value (USD Million) Forecast by Active Class, 2020-2035
  • Table 78: Middle East and Africa Market Volume (Units) Forecast by Active Class, 2020-2035
  • Table 79: Middle East and Africa Market Value (USD Million) Forecast by Application, 2020-2035
  • Table 80: Middle East and Africa Market Volume (Units) Forecast by Application, 2020-2035
  • Table 81: Middle East and Africa Market Value (USD Million) Forecast by Product Format, 2020-2035
  • Table 82: Middle East and Africa Market Volume (Units) Forecast by Product Format, 2020-2035
  • Table 83: Middle East and Africa Market Value (USD Million) Forecast by Regulatory Positioning, 2020-2035
  • Table 84: Middle East and Africa Market Volume (Units) Forecast by Regulatory Positioning, 2020-2035

List of Figures

  • Figure 1: Global Market Value (USD Million) by Carrier System, 2025-2035
  • Figure 2: Global Market Value (USD Million) by Active Class, 2025-2035
  • Figure 3: Global Market Value (USD Million) by Application, 2025-2035
  • Figure 4: Global Market Value (USD Million) by Product Format, 2025-2035
  • Figure 5: Global Market Value (USD Million) by Regulatory Positioning, 2025-2035
  • Figure 6: Global Market Value (USD Million) by Region, 2025-2035
  • Figure 7: Global Market Value (USD Million) Analysis by Region, 2020-2035
  • Figure 8: Global Market Volume (Units) Analysis by Region, 2020-2035
  • Figure 9: Global Market Value Share (%) and BPS Analysis by Region, 2025-2035
  • Figure 10: Global Market Y-o-Y Growth (%) Projections by Region, 2025-2035
  • Figure 11: Global Market Value (USD Million) Analysis by Carrier System, 2020-2035
  • Figure 12: Global Market Volume (Units) Analysis by Carrier System, 2020-2035
  • Figure 13: Global Market Value Share (%) and BPS Analysis by Carrier System, 2025-2035
  • Figure 14: Global Market Y-o-Y Growth (%) Projections by Carrier System, 2025-2035
  • Figure 15: Global Market Value (USD Million) Analysis by Active Class, 2020-2035
  • Figure 16: Global Market Volume (Units) Analysis by Active Class, 2020-2035
  • Figure 17: Global Market Value Share (%) and BPS Analysis by Active Class, 2025-2035
  • Figure 18: Global Market Y-o-Y Growth (%) Projections by Active Class, 2025-2035
  • Figure 19: Global Market Value (USD Million) Analysis by Application, 2020-2035
  • Figure 20: Global Market Volume (Units) Analysis by Application, 2020-2035
  • Figure 21: Global Market Value Share (%) and BPS Analysis by Application, 2025-2035
  • Figure 22: Global Market Y-o-Y Growth (%) Projections by Application, 2025-2035
  • Figure 23: Global Market Value (USD Million) Analysis by Product Format, 2020-2035
  • Figure 24: Global Market Volume (Units) Analysis by Product Format, 2020-2035
  • Figure 25: Global Market Value Share (%) and BPS Analysis by Product Format, 2025-2035
  • Figure 26: Global Market Y-o-Y Growth (%) Projections by Product Format, 2025-2035
  • Figure 27: Global Market Value (USD Million) Analysis by Regulatory Positioning, 2020-2035
  • Figure 28: Global Market Volume (Units) Analysis by Regulatory Positioning, 2020-2035
  • Figure 29: Global Market Value Share (%) and BPS Analysis by Regulatory Positioning, 2025-2035
  • Figure 30: Global Market Y-o-Y Growth (%) Projections by Regulatory Positioning, 2025-2035
  • Figure 31: Global Market Attractiveness by Carrier System, 2025-2035
  • Figure 32: Global Market Attractiveness by Active Class, 2025-2035
  • Figure 33: Global Market Attractiveness by Application, 2025-2035
  • Figure 34: Global Market Attractiveness by Product Format, 2025-2035
  • Figure 35: Global Market Attractiveness by Regulatory Positioning, 2025-2035
  • Figure 36: Global Market Attractiveness by Region, 2025-2035
  • Figure 37: North America Market Value (USD Million) by Carrier System, 2025-2035
  • Figure 38: North America Market Value (USD Million) by Active Class, 2025-2035
  • Figure 39: North America Market Value (USD Million) by Application, 2025-2035
  • Figure 40: North America Market Value (USD Million) by Product Format, 2025-2035
  • Figure 41: North America Market Value (USD Million) by Regulatory Positioning, 2025-2035
  • Figure 42: North America Market Value (USD Million) by Country, 2025-2035
  • Figure 43: North America Market Value (USD Million) Analysis by Country, 2020-2035
  • Figure 44: North America Market Volume (Units) Analysis by Country, 2020-2035
  • Figure 45: North America Market Value Share (%) and BPS Analysis by Country, 2025-2035
  • Figure 46: North America Market Y-o-Y Growth (%) Projections by Country, 2025-2035
  • Figure 47: North America Market Value (USD Million) Analysis by Carrier System, 2020-2035
  • Figure 48: North America Market Volume (Units) Analysis by Carrier System, 2020-2035
  • Figure 49: North America Market Value Share (%) and BPS Analysis by Carrier System, 2025-2035
  • Figure 50: North America Market Y-o-Y Growth (%) Projections by Carrier System, 2025-2035
  • Figure 51: North America Market Value (USD Million) Analysis by Active Class, 2020-2035
  • Figure 52: North America Market Volume (Units) Analysis by Active Class, 2020-2035
  • Figure 53: North America Market Value Share (%) and BPS Analysis by Active Class, 2025-2035
  • Figure 54: North America Market Y-o-Y Growth (%) Projections by Active Class, 2025-2035
  • Figure 55: North America Market Value (USD Million) Analysis by Application, 2020-2035
  • Figure 56: North America Market Volume (Units) Analysis by Application, 2020-2035
  • Figure 57: North America Market Value Share (%) and BPS Analysis by Application, 2025-2035
  • Figure 58: North America Market Y-o-Y Growth (%) Projections by Application, 2025-2035
  • Figure 59: North America Market Value (USD Million) Analysis by Product Format, 2020-2035
  • Figure 60: North America Market Volume (Units) Analysis by Product Format, 2020-2035
  • Figure 61: North America Market Value Share (%) and BPS Analysis by Product Format, 2025-2035
  • Figure 62: North America Market Y-o-Y Growth (%) Projections by Product Format, 2025-2035
  • Figure 63: North America Market Value (USD Million) Analysis by Regulatory Positioning, 2020-2035
  • Figure 64: North America Market Volume (Units) Analysis by Regulatory Positioning, 2020-2035
  • Figure 65: North America Market Value Share (%) and BPS Analysis by Regulatory Positioning, 2025-2035
  • Figure 66: North America Market Y-o-Y Growth (%) Projections by Regulatory Positioning, 2025-2035
  • Figure 67: North America Market Attractiveness by Carrier System, 2025-2035
  • Figure 68: North America Market Attractiveness by Active Class, 2025-2035
  • Figure 69: North America Market Attractiveness by Application, 2025-2035
  • Figure 70: North America Market Attractiveness by Product Format, 2025-2035
  • Figure 71: North America Market Attractiveness by Regulatory Positioning, 2025-2035
  • Figure 72: North America Market Attractiveness by Country, 2025-2035
  • Figure 73: Latin America Market Value (USD Million) by Carrier System, 2025-2035
  • Figure 74: Latin America Market Value (USD Million) by Active Class, 2025-2035
  • Figure 75: Latin America Market Value (USD Million) by Application, 2025-2035
  • Figure 76: Latin America Market Value (USD Million) by Product Format, 2025-2035
  • Figure 77: Latin America Market Value (USD Million) by Regulatory Positioning, 2025-2035
  • Figure 78: Latin America Market Value (USD Million) by Country, 2025-2035
  • Figure 79: Latin America Market Value (USD Million) Analysis by Country, 2020-2035
  • Figure 80: Latin America Market Volume (Units) Analysis by Country, 2020-2035
  • Figure 81: Latin America Market Value Share (%) and BPS Analysis by Country, 2025-2035
  • Figure 82: Latin America Market Y-o-Y Growth (%) Projections by Country, 2025-2035
  • Figure 83: Latin America Market Value (USD Million) Analysis by Carrier System, 2020-2035
  • Figure 84: Latin America Market Volume (Units) Analysis by Carrier System, 2020-2035
  • Figure 85: Latin America Market Value Share (%) and BPS Analysis by Carrier System, 2025-2035
  • Figure 86: Latin America Market Y-o-Y Growth (%) Projections by Carrier System, 2025-2035
  • Figure 87: Latin America Market Value (USD Million) Analysis by Active Class, 2020-2035
  • Figure 88: Latin America Market Volume (Units) Analysis by Active Class, 2020-2035
  • Figure 89: Latin America Market Value Share (%) and BPS Analysis by Active Class, 2025-2035
  • Figure 90: Latin America Market Y-o-Y Growth (%) Projections by Active Class, 2025-2035
  • Figure 91: Latin America Market Value (USD Million) Analysis by Application, 2020-2035
  • Figure 92: Latin America Market Volume (Units) Analysis by Application, 2020-2035
  • Figure 93: Latin America Market Value Share (%) and BPS Analysis by Application, 2025-2035
  • Figure 94: Latin America Market Y-o-Y Growth (%) Projections by Application, 2025-2035
  • Figure 95: Latin America Market Value (USD Million) Analysis by Product Format, 2020-2035
  • Figure 96: Latin America Market Volume (Units) Analysis by Product Format, 2020-2035
  • Figure 97: Latin America Market Value Share (%) and BPS Analysis by Product Format, 2025-2035
  • Figure 98: Latin America Market Y-o-Y Growth (%) Projections by Product Format, 2025-2035
  • Figure 99: Latin America Market Value (USD Million) Analysis by Regulatory Positioning, 2020-2035
  • Figure 100: Latin America Market Volume (Units) Analysis by Regulatory Positioning, 2020-2035
  • Figure 101: Latin America Market Value Share (%) and BPS Analysis by Regulatory Positioning, 2025-2035
  • Figure 102: Latin America Market Y-o-Y Growth (%) Projections by Regulatory Positioning, 2025-2035
  • Figure 103: Latin America Market Attractiveness by Carrier System, 2025-2035
  • Figure 104: Latin America Market Attractiveness by Active Class, 2025-2035
  • Figure 105: Latin America Market Attractiveness by Application, 2025-2035
  • Figure 106: Latin America Market Attractiveness by Product Format, 2025-2035
  • Figure 107: Latin America Market Attractiveness by Regulatory Positioning, 2025-2035
  • Figure 108: Latin America Market Attractiveness by Country, 2025-2035
  • Figure 109: Europe Market Value (USD Million) by Carrier System, 2025-2035
  • Figure 110: Europe Market Value (USD Million) by Active Class, 2025-2035
  • Figure 111: Europe Market Value (USD Million) by Application, 2025-2035
  • Figure 112: Europe Market Value (USD Million) by Product Format, 2025-2035
  • Figure 113: Europe Market Value (USD Million) by Regulatory Positioning, 2025-2035
  • Figure 114: Europe Market Value (USD Million) by Country, 2025-2035
  • Figure 115: Europe Market Value (USD Million) Analysis by Country, 2020-2035
  • Figure 116: Europe Market Volume (Units) Analysis by Country, 2020-2035
  • Figure 117: Europe Market Value Share (%) and BPS Analysis by Country, 2025-2035
  • Figure 118: Europe Market Y-o-Y Growth (%) Projections by Country, 2025-2035
  • Figure 119: Europe Market Value (USD Million) Analysis by Carrier System, 2020-2035
  • Figure 120: Europe Market Volume (Units) Analysis by Carrier System, 2020-2035
  • Figure 121: Europe Market Value Share (%) and BPS Analysis by Carrier System, 2025-2035
  • Figure 122: Europe Market Y-o-Y Growth (%) Projections by Carrier System, 2025-2035
  • Figure 123: Europe Market Value (USD Million) Analysis by Active Class, 2020-2035
  • Figure 124: Europe Market Volume (Units) Analysis by Active Class, 2020-2035
  • Figure 125: Europe Market Value Share (%) and BPS Analysis by Active Class, 2025-2035
  • Figure 126: Europe Market Y-o-Y Growth (%) Projections by Active Class, 2025-2035
  • Figure 127: Europe Market Value (USD Million) Analysis by Application, 2020-2035
  • Figure 128: Europe Market Volume (Units) Analysis by Application, 2020-2035
  • Figure 129: Europe Market Value Share (%) and BPS Analysis by Application, 2025-2035
  • Figure 130: Europe Market Y-o-Y Growth (%) Projections by Application, 2025-2035
  • Figure 131: Europe Market Value (USD Million) Analysis by Product Format, 2020-2035
  • Figure 132: Europe Market Volume (Units) Analysis by Product Format, 2020-2035
  • Figure 133: Europe Market Value Share (%) and BPS Analysis by Product Format, 2025-2035
  • Figure 134: Europe Market Y-o-Y Growth (%) Projections by Product Format, 2025-2035
  • Figure 135: Europe Market Value (USD Million) Analysis by Regulatory Positioning, 2020-2035
  • Figure 136: Europe Market Volume (Units) Analysis by Regulatory Positioning, 2020-2035
  • Figure 137: Europe Market Value Share (%) and BPS Analysis by Regulatory Positioning, 2025-2035
  • Figure 138: Europe Market Y-o-Y Growth (%) Projections by Regulatory Positioning, 2025-2035
  • Figure 139: Europe Market Attractiveness by Carrier System, 2025-2035
  • Figure 140: Europe Market Attractiveness by Active Class, 2025-2035
  • Figure 141: Europe Market Attractiveness by Application, 2025-2035
  • Figure 142: Europe Market Attractiveness by Product Format, 2025-2035
  • Figure 143: Europe Market Attractiveness by Regulatory Positioning, 2025-2035
  • Figure 144: Europe Market Attractiveness by Country, 2025-2035
  • Figure 145: East Asia Market Value (USD Million) by Carrier System, 2025-2035
  • Figure 146: East Asia Market Value (USD Million) by Active Class, 2025-2035
  • Figure 147: East Asia Market Value (USD Million) by Application, 2025-2035
  • Figure 148: East Asia Market Value (USD Million) by Product Format, 2025-2035
  • Figure 149: East Asia Market Value (USD Million) by Regulatory Positioning, 2025-2035
  • Figure 150: East Asia Market Value (USD Million) by Country, 2025-2035
  • Figure 151: East Asia Market Value (USD Million) Analysis by Country, 2020-2035
  • Figure 152: East Asia Market Volume (Units) Analysis by Country, 2020-2035
  • Figure 153: East Asia Market Value Share (%) and BPS Analysis by Country, 2025-2035
  • Figure 154: East Asia Market Y-o-Y Growth (%) Projections by Country, 2025-2035
  • Figure 155: East Asia Market Value (USD Million) Analysis by Carrier System, 2020-2035
  • Figure 156: East Asia Market Volume (Units) Analysis by Carrier System, 2020-2035
  • Figure 157: East Asia Market Value Share (%) and BPS Analysis by Carrier System, 2025-2035
  • Figure 158: East Asia Market Y-o-Y Growth (%) Projections by Carrier System, 2025-2035
  • Figure 159: East Asia Market Value (USD Million) Analysis by Active Class, 2020-2035
  • Figure 160: East Asia Market Volume (Units) Analysis by Active Class, 2020-2035
  • Figure 161: East Asia Market Value Share (%) and BPS Analysis by Active Class, 2025-2035
  • Figure 162: East Asia Market Y-o-Y Growth (%) Projections by Active Class, 2025-2035
  • Figure 163: East Asia Market Value (USD Million) Analysis by Application, 2020-2035
  • Figure 164: East Asia Market Volume (Units) Analysis by Application, 2020-2035
  • Figure 165: East Asia Market Value Share (%) and BPS Analysis by Application, 2025-2035
  • Figure 166: East Asia Market Y-o-Y Growth (%) Projections by Application, 2025-2035
  • Figure 167: East Asia Market Value (USD Million) Analysis by Product Format, 2020-2035
  • Figure 168: East Asia Market Volume (Units) Analysis by Product Format, 2020-2035
  • Figure 169: East Asia Market Value Share (%) and BPS Analysis by Product Format, 2025-2035
  • Figure 170: East Asia Market Y-o-Y Growth (%) Projections by Product Format, 2025-2035
  • Figure 171: East Asia Market Value (USD Million) Analysis by Regulatory Positioning, 2020-2035
  • Figure 172: East Asia Market Volume (Units) Analysis by Regulatory Positioning, 2020-2035
  • Figure 173: East Asia Market Value Share (%) and BPS Analysis by Regulatory Positioning, 2025-2035
  • Figure 174: East Asia Market Y-o-Y Growth (%) Projections by Regulatory Positioning, 2025-2035
  • Figure 175: East Asia Market Attractiveness by Carrier System, 2025-2035
  • Figure 176: East Asia Market Attractiveness by Active Class, 2025-2035
  • Figure 177: East Asia Market Attractiveness by Application, 2025-2035
  • Figure 178: East Asia Market Attractiveness by Product Format, 2025-2035
  • Figure 179: East Asia Market Attractiveness by Regulatory Positioning, 2025-2035
  • Figure 180: East Asia Market Attractiveness by Country, 2025-2035
  • Figure 181: South Asia & Pacific Market Value (USD Million) by Carrier System, 2025-2035
  • Figure 182: South Asia & Pacific Market Value (USD Million) by Active Class, 2025-2035
  • Figure 183: South Asia & Pacific Market Value (USD Million) by Application, 2025-2035
  • Figure 184: South Asia & Pacific Market Value (USD Million) by Product Format, 2025-2035
  • Figure 185: South Asia & Pacific Market Value (USD Million) by Regulatory Positioning, 2025-2035
  • Figure 186: South Asia & Pacific Market Value (USD Million) by Country, 2025-2035
  • Figure 187: South Asia & Pacific Market Value (USD Million) Analysis by Country, 2020-2035
  • Figure 188: South Asia & Pacific Market Volume (Units) Analysis by Country, 2020-2035
  • Figure 189: South Asia & Pacific Market Value Share (%) and BPS Analysis by Country, 2025-2035
  • Figure 190: South Asia & Pacific Market Y-o-Y Growth (%) Projections by Country, 2025-2035
  • Figure 191: South Asia & Pacific Market Value (USD Million) Analysis by Carrier System, 2020-2035
  • Figure 192: South Asia & Pacific Market Volume (Units) Analysis by Carrier System, 2020-2035
  • Figure 193: South Asia & Pacific Market Value Share (%) and BPS Analysis by Carrier System, 2025-2035
  • Figure 194: South Asia & Pacific Market Y-o-Y Growth (%) Projections by Carrier System, 2025-2035
  • Figure 195: South Asia & Pacific Market Value (USD Million) Analysis by Active Class, 2020-2035
  • Figure 196: South Asia & Pacific Market Volume (Units) Analysis by Active Class, 2020-2035
  • Figure 197: South Asia & Pacific Market Value Share (%) and BPS Analysis by Active Class, 2025-2035
  • Figure 198: South Asia & Pacific Market Y-o-Y Growth (%) Projections by Active Class, 2025-2035
  • Figure 199: South Asia & Pacific Market Value (USD Million) Analysis by Application, 2020-2035
  • Figure 200: South Asia & Pacific Market Volume (Units) Analysis by Application, 2020-2035
  • Figure 201: South Asia & Pacific Market Value Share (%) and BPS Analysis by Application, 2025-2035
  • Figure 202: South Asia & Pacific Market Y-o-Y Growth (%) Projections by Application, 2025-2035
  • Figure 203: South Asia & Pacific Market Value (USD Million) Analysis by Product Format, 2020-2035
  • Figure 204: South Asia & Pacific Market Volume (Units) Analysis by Product Format, 2020-2035
  • Figure 205: South Asia & Pacific Market Value Share (%) and BPS Analysis by Product Format, 2025-2035
  • Figure 206: South Asia & Pacific Market Y-o-Y Growth (%) Projections by Product Format, 2025-2035
  • Figure 207: South Asia & Pacific Market Value (USD Million) Analysis by Regulatory Positioning, 2020-2035
  • Figure 208: South Asia & Pacific Market Volume (Units) Analysis by Regulatory Positioning, 2020-2035
  • Figure 209: South Asia & Pacific Market Value Share (%) and BPS Analysis by Regulatory Positioning, 2025-2035
  • Figure 210: South Asia & Pacific Market Y-o-Y Growth (%) Projections by Regulatory Positioning, 2025-2035
  • Figure 211: South Asia & Pacific Market Attractiveness by Carrier System, 2025-2035
  • Figure 212: South Asia & Pacific Market Attractiveness by Active Class, 2025-2035
  • Figure 213: South Asia & Pacific Market Attractiveness by Application, 2025-2035
  • Figure 214: South Asia & Pacific Market Attractiveness by Product Format, 2025-2035
  • Figure 215: South Asia & Pacific Market Attractiveness by Regulatory Positioning, 2025-2035
  • Figure 216: South Asia & Pacific Market Attractiveness by Country, 2025-2035
  • Figure 217: Middle East and Africa Market Value (USD Million) by Carrier System, 2025-2035
  • Figure 218: Middle East and Africa Market Value (USD Million) by Active Class, 2025-2035
  • Figure 219: Middle East and Africa Market Value (USD Million) by Application, 2025-2035
  • Figure 220: Middle East and Africa Market Value (USD Million) by Product Format, 2025-2035
  • Figure 221: Middle East and Africa Market Value (USD Million) by Regulatory Positioning, 2025-2035
  • Figure 222: Middle East and Africa Market Value (USD Million) by Country, 2025-2035
  • Figure 223: Middle East and Africa Market Value (USD Million) Analysis by Country, 2020-2035
  • Figure 224: Middle East and Africa Market Volume (Units) Analysis by Country, 2020-2035
  • Figure 225: Middle East and Africa Market Value Share (%) and BPS Analysis by Country, 2025-2035
  • Figure 226: Middle East and Africa Market Y-o-Y Growth (%) Projections by Country, 2025-2035
  • Figure 227: Middle East and Africa Market Value (USD Million) Analysis by Carrier System, 2020-2035
  • Figure 228: Middle East and Africa Market Volume (Units) Analysis by Carrier System, 2020-2035
  • Figure 229: Middle East and Africa Market Value Share (%) and BPS Analysis by Carrier System, 2025-2035
  • Figure 230: Middle East and Africa Market Y-o-Y Growth (%) Projections by Carrier System, 2025-2035
  • Figure 231: Middle East and Africa Market Value (USD Million) Analysis by Active Class, 2020-2035
  • Figure 232: Middle East and Africa Market Volume (Units) Analysis by Active Class, 2020-2035
  • Figure 233: Middle East and Africa Market Value Share (%) and BPS Analysis by Active Class, 2025-2035
  • Figure 234: Middle East and Africa Market Y-o-Y Growth (%) Projections by Active Class, 2025-2035
  • Figure 235: Middle East and Africa Market Value (USD Million) Analysis by Application, 2020-2035
  • Figure 236: Middle East and Africa Market Volume (Units) Analysis by Application, 2020-2035
  • Figure 237: Middle East and Africa Market Value Share (%) and BPS Analysis by Application, 2025-2035
  • Figure 238: Middle East and Africa Market Y-o-Y Growth (%) Projections by Application, 2025-2035
  • Figure 239: Middle East and Africa Market Value (USD Million) Analysis by Product Format, 2020-2035
  • Figure 240: Middle East and Africa Market Volume (Units) Analysis by Product Format, 2020-2035
  • Figure 241: Middle East and Africa Market Value Share (%) and BPS Analysis by Product Format, 2025-2035
  • Figure 242: Middle East and Africa Market Y-o-Y Growth (%) Projections by Product Format, 2025-2035
  • Figure 243: Middle East and Africa Market Value (USD Million) Analysis by Regulatory Positioning, 2020-2035
  • Figure 244: Middle East and Africa Market Volume (Units) Analysis by Regulatory Positioning, 2020-2035
  • Figure 245: Middle East and Africa Market Value Share (%) and BPS Analysis by Regulatory Positioning, 2025-2035
  • Figure 246: Middle East and Africa Market Y-o-Y Growth (%) Projections by Regulatory Positioning, 2025-2035
  • Figure 247: Middle East and Africa Market Attractiveness by Carrier System, 2025-2035
  • Figure 248: Middle East and Africa Market Attractiveness by Active Class, 2025-2035
  • Figure 249: Middle East and Africa Market Attractiveness by Application, 2025-2035
  • Figure 250: Middle East and Africa Market Attractiveness by Product Format, 2025-2035
  • Figure 251: Middle East and Africa Market Attractiveness by Regulatory Positioning, 2025-2035
  • Figure 252: Middle East and Africa Market Attractiveness by Country, 2025-2035

Frequently Asked Questions

How big is the Global Cosmetic Nanoencapsulation Market in 2025?

The Global Cosmetic Nanoencapsulation Market is estimated to be valued at USD 2,054.3 million in 2025.

What will be the size of the Global Cosmetic Nanoencapsulation Market in 2035?

The market size for the Global Cosmetic Nanoencapsulation Market is projected to reach USD 6,203.3 million by 2035.

How much will be the Global Cosmetic Nanoencapsulation Market growth between 2025 and 2035?

The Global Cosmetic Nanoencapsulation Market is expected to grow at a CAGR of 11.7% between 2025 and 2035.

What are the key product types in the Global Cosmetic Nanoencapsulation Market?

The key product formats in the Global Cosmetic Nanoencapsulation Market are serums, creams & lotions, essences/ampoules, and sprays/mists.

Which segment will contribute a significant share in the Global Cosmetic Nanoencapsulation Market in 2025?

In terms of application, skincare is set to command 55.6% share of the Global Cosmetic Nanoencapsulation Market in 2025.

Explore Similar Insights

Future Market Insights

Cosmetic Nanoencapsulation Market