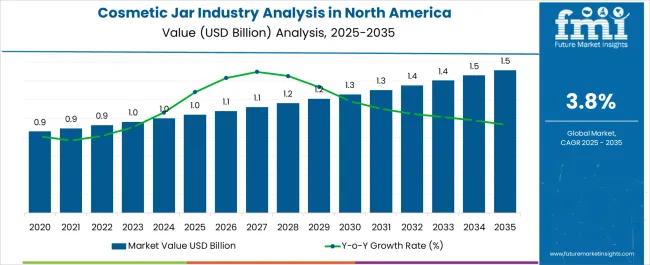
The Cosmetic Jar Industry Analysis in North America is estimated to be valued at USD 1.0 billion in 2025 and is projected to reach USD 1.5 billion by 2035, registering a compound annual growth rate (CAGR) of 3.8% over the forecast period.
| Metric | Value |
|---|---|
| Cosmetic Jar Industry Analysis in North America Estimated Value in (2025 E) | USD 1.0 billion |
| Cosmetic Jar Industry Analysis in North America Forecast Value in (2035 F) | USD 1.5 billion |
| Forecast CAGR (2025 to 2035) | 3.8% |
The cosmetic jar industry in North America is experiencing robust expansion. Growth is being fueled by rising consumer demand for premium skincare and personal care products, coupled with strong innovation in packaging design and materials.
Current dynamics highlight a shift toward lightweight, sustainable, and aesthetically appealing jars that align with evolving consumer preferences for both functionality and brand value. Plastic remains a dominant material choice due to its versatility, cost-effectiveness, and adaptability to high-volume production, while manufacturers are simultaneously exploring eco-friendly alternatives to meet sustainability goals.
The future outlook is shaped by increasing investment in recyclable and refillable packaging formats, expansion of e-commerce platforms driving diverse packaging requirements, and the growing influence of luxury and mid-tier skincare brands Growth rationale is centered on the ability of cosmetic jar manufacturers to balance affordability, durability, and environmental responsibility, while also catering to the rising consumer inclination toward smaller, travel-friendly formats that enhance convenience and product accessibility across the region.
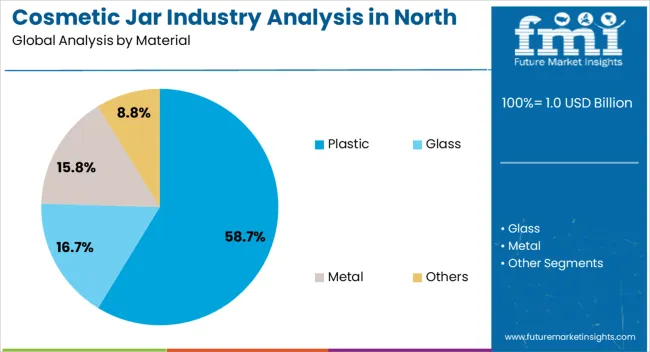
The plastic segment, representing 58.7% of the material category, has established leadership due to its lightweight nature, durability, and suitability for mass production in the cosmetic industry. Its market share has been reinforced by the material’s adaptability to diverse designs, finishes, and branding requirements that align with consumer preferences.
Manufacturers have capitalized on plastic’s cost efficiency to cater to both premium and mass-market brands. Recent advances in bio-based plastics and post-consumer recycled resin integration have further enhanced sustainability credentials, ensuring compliance with regional environmental regulations.
The segment’s growth is being supported by ongoing demand from skincare and personal care products, where consistent supply chains and scalability remain critical Future potential lies in balancing innovation with eco-conscious initiatives, positioning plastic jars as a durable yet increasingly sustainable option within the North American cosmetic packaging landscape.
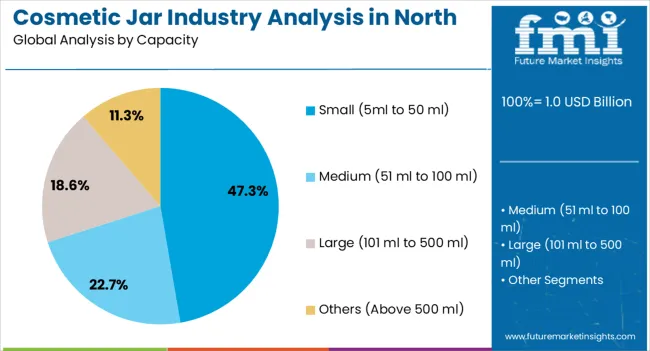
The small capacity segment, covering 5ml to 50ml jars and holding 47.3% of the capacity category, has emerged as the preferred format due to rising consumer demand for portability, convenience, and single-use or travel-friendly packaging. Its dominance has been driven by skincare brands leveraging smaller jars for sample distribution, premium launches, and on-the-go products.
The segment has benefited from increasing emphasis on portion control, which aligns with consumer preferences for cost-effective trial purchases before committing to larger sizes. E-commerce growth has further amplified the appeal of small jars, as lightweight packaging ensures reduced shipping costs and enhanced unboxing experiences.
Innovations in cap and closure design, alongside premium finishes, have also reinforced consumer perception of quality Continued alignment with lifestyle shifts, travel culture, and regulatory allowances for carry-on sizes is expected to sustain the growth trajectory of this capacity segment.
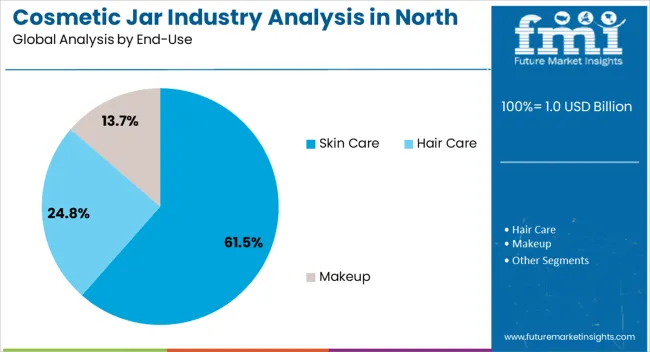
The skin care segment, accounting for 61.5% of the end-use category, has remained the leading application due to the sector’s consistent innovation and rising consumer focus on self-care routines. Increasing product launches in moisturizers, serums, and anti-aging creams have reinforced reliance on jars as primary packaging solutions.
The segment’s share is supported by strong brand differentiation strategies, where packaging aesthetics play a pivotal role in consumer purchasing decisions. Market growth has been accelerated by premiumization trends, with luxury skincare brands opting for distinctive jar designs that highlight exclusivity and sophistication.
Demand has also been reinforced by sustainability initiatives, as brands introduce recyclable or refillable jars to align with consumer expectations for environmentally responsible packaging The ongoing expansion of the skincare industry, supported by rising disposable incomes and heightened awareness of personal wellness, is expected to ensure that cosmetic jars remain an indispensable packaging format in North America.
The cosmetic jar business in North America is projected to experience lucrative growth from 2025 to 2035. It is set to stimulate a supplementary potential worth USD 1.5 million by 2035. The total revenue is also expected to surge 1.5 times its current value.
Due to the growing knowledge of the dangers of high chemical content in synthetic beauty products, natural and organic cosmetics have become popular in North America in recent years. This is also attributed to the rising incidence of diseases such as skin cancer, Alzheimer's, allergies, and congenital defects with the use of synthetic beauty products.
The beauty and personal care sector is a prominent user of cosmetic jars. These are set to be significantly utilized for packaging skincare, haircare, and beauty products. The cosmetic jar business is mainly dominated by sustainability trends, consumer perception, and regulatory environment.
The cosmetics sector is being influenced by the increased spending of consumers on beauty products. The rising penetration of cosmetics in developing countries and the premiumization of packaging in the field are also set to aid demand.
Cosmetic jars are a primary interface between the product and the consumer. These not only protect the products but also act as a powerful promotional tool for brands.
Proper packaging for cosmetic products potentially influences consumer perception, purchase decisions, and brand experience. Increased consciousness among modern consumers about the environmental impact of cosmetic packaging waste is set to drive demand.
It has encouraged manufacturers of cosmetic jars to focus mainly on sustainability. This has further led beauty brands to reduce their carbon footprint by adopting biodegradable materials and refillable and recyclable packaging jars.
The trend for minimalistic and simple packaging incorporating clean and straightforward designs to deliver a concise brand image is creating traction in the cosmetic packaging sector. Smart packaging solutions such as augmented reality experiences or interactive elements to enhance the user experience are paving the way in the cosmetic packaging sector. It is projected to be driven by ongoing innovations and technological advancements.
New trends and innovations in the cosmetic packaging sector are driving the cosmetic jar business in North America. Leading players are designing cosmetic jars that are gender-neutral, accessible, and cater to different end-users across the region.
North America’s cosmetic jar business recorded a CAGR of 2.1% during the historical period. It reached a value of USD 1 million in 2025 from USD 0.9 million in 2020.
| Historical CAGR (2025 to 2035) | 2.1% |
|---|---|
| Historical Value (2025) | USD 1 million |
The cosmetic sector has seen a discernible movement in the last ten years toward more environmentally friendly and sustainable packaging options, such as cosmetic jars. Rising consumer knowledge of environmental problems has been the driving force behind this trend.
In order to provide customers with distinctive and unforgettable experiences, cosmetic manufacturers have been expanding their range of personalization and customization possibilities for packaging. This involves selecting new cosmetic jar colors, sizes, and finishes.
Trends in the cosmetic packaging business have placed a strong emphasis on transparency. Transparent or translucent cosmetic jars have become immensely popular since they let customers see the products within, encouraging openness and confidence.
Cosmetic jar designs have steadily changed throughout time, with an emphasis on cutting-edge dispensing techniques. To enhance product dispensing and cleanliness, airless pumps, droppers, and spatulas have become increasingly widespread.
The integration of technology into packaging has garnered increasing attention in the past five years. Additional information and interactive experiences have been offered to customers through the use of QR codes, NFC tags, and augmented reality experiences.
The cosmetic business has been significantly impacted by the health and wellness movement. Cosmetic jars and other container choices have been impacted by consumers' growing desire for goods made with natural, organic, and clean components.
Inclination toward Luxury Packaging Elevates the Demand for Premium Jars
Premium and luxury packaging is driving the cosmetic jar business in North America. It enhances consumer satisfaction with the brand and increases the likelihood of repeat purchases and recommendations to others. Prominent players operating in the cosmetic jar business are introducing luxury cosmetic jars for premium applications, which is expected to boost demand.
Cosmetic brands are also investing in luxurious and premium packaging to provide a high-end experience to their customers. They incorporate intricate details, opulent materials, and elegant finishes to elevate the brand presentation and create a sense of indulgence.
A handful of the leading luxury effects adopted by several brands include glitter and soft touch coatings, metallic sheen, pearlescent coatings, and raised UV coating.
Premium packaging utilizes several materials, including leather, silk, or canvas, on conventional glass jars. Premium cosmetic jars can help convey a message of exclusivity and sophistication, further appealing to discerning consumers.
For instance, in December 2025, Corpack GMBH launched its new ‘Made in Europe’ luxurious jar series. These have double walls, transparency, and attractive finishes with prestige looks that are mainly needed for skincare products.
Integration of RFID, QR Codes, and Sensors Propel Demand for Cosmetic Jars
Cosmetic brands are incorporating intelligent features in the packaging, such as QR codes, RFID, NFC technology, augmented reality, and sensors. These can provide information about the product's purity, ingredients, expiry date, manufacturing details, and user recommendations.
The emergence of smart packaging in the cosmetic sector is pushing the boundaries and enhancing user experience. This is also projected to help in building trust and enable brands to interact directly with their customers.
Transparency about the materials used in the cosmetics is an important factor offering an opportunity for engaging consumers with the brand. These features can lead consumers to a virtual space that will allow them to witness the ingredient-sourcing process. They can also visualize the molecular structure and skin benefits of each ingredient.
Advancements and innovations similar to these show how technology is shaping the future of cosmetic jars. These enable modern brands to add extra value and utility to the product, which would go beyond the aesthetics.
The table presents the expected CAGR for North America cosmetic jar space over several semi-annual periods spanning from 2025 to 2035. In the first half (H1) of the decade from 2025 to 2035, the field is projected to surge at a CAGR of 3.1%, followed by a slightly lower growth rate of 2.7% in the second half (H2) of the same decade.
Moving into the subsequent period, from H1 2025 to H2 2035, the CAGR is projected to increase slightly to 2.9% in the first half and remain relatively moderate at 3.3% in the second half.
These values offer insights into the projected growth trends for the North America cosmetic jar space, aiding investors and stakeholders in making informed decisions regarding investments and strategies.
| Particular | Value CAGR |
|---|---|
| H1 (2025 to 2035) | 3.1% |
| H2 (2025 to 2035) | 2.7% |
| H1 (2025 to 2035) | 2.9% |
| H2 (2025 to 2035) | 3.3% |
The table below provides the latest trends observed in North America cosmetic jar space, growth obstacles, and upcoming opportunities. Business strategies for pushing cosmetic jar sales in North America would enable stakeholders to invest in the right area and gain profit.
| Attributes | Key Factors |
|---|---|
| Latest Trends |
|
| Upcoming Opportunities |
|
| Challenges |
|
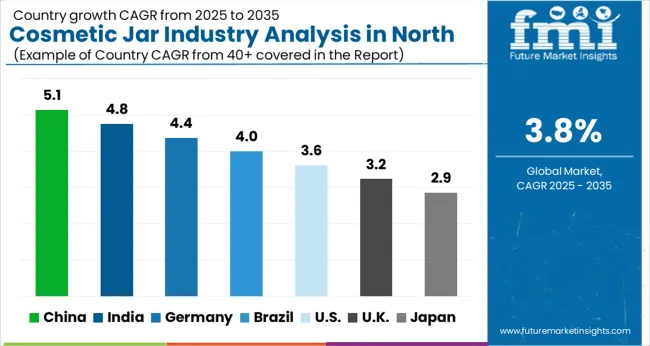
In the below table of the growth potential of the cosmetic jar in North America, the CAGRs of the top two countries are provided. Out of these two, the United States will likely lead the field of cosmetic jars in North America by exhibiting a CAGR of 3.4% from 2025 to 2035. Canada is expected to witness cosmetic jar sales in the region at a CAGR of 5.1%.
| Countries | Value (CAGR) |
|---|---|
| United States | 3.4% |
| Canada | 5.1% |
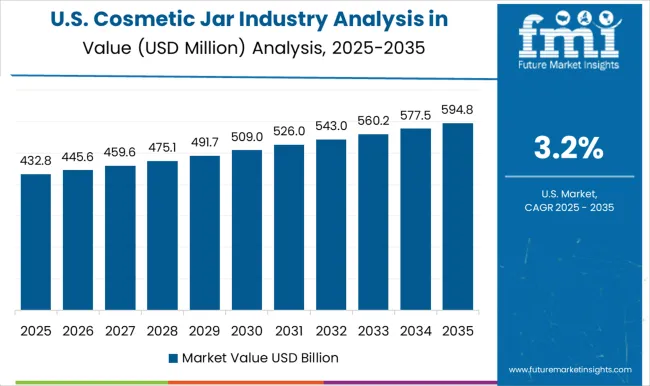
The United States is expected to spark extra avenues worth USD 1.5 million, advancing at a CAGR of 3.4% through 2035. This growth is attributed to the rising demand for natural and organic products among modern consumers as they have become more conscious about the environment.
The growing demand for cosmetics and personal care products with a focus on sustainability in the United States is prominently influencing the cosmetic jar business.
Canada is expected to witness steady growth in the assessment period due to changing consumer preferences, increased focus on personal grooming, and the introduction of innovative products.
The emerging ecosystem of Canada is translating to an increasing demand for cosmetic jars for several beauty and personal care products. Canada is anticipated to surge at 5.1% CAGR, reaching a value of USD 292.8 million by 2035.
The table below highlights the demand for cosmetic jars in North America by material type and end-use. Under material type, the plastic segment will likely remain dominant in the assessment period.
The plastic segment, on the other hand, is set to showcase a significant CAGR of 4.7% through 2035 in the field of cosmetic jars in North America. Further, the skincare segment by end-use is expected to surge at a CAGR of 3.9% through 2035.
| Segment | Value-based CAGR |
|---|---|
| Plastic (Material) | 4.7% |
| Skincare (End-use) | 3.9% |
Plastic-based cosmetic jars are at the forefront in North America, capturing 40.0% of the share in 2025. This dominance is projected to persist due to its lightweight and cost-effective nature.
Emerging environmental concerns associated with plastic jars are subject to reducing their consumption in the future. The packaging sector is becoming more focused on using bio-plastics and recyclable plastics to achieve its circular economy goals.
For skincare items and other cosmetics, plastic and glass bottles remain the most popular packaging materials in the region. Hence, it is anticipated that the consumption of materials will rise positively along with this product category's expansion.
The materials that are mainly favored for plastic bottles are acrylic, PP, PE, and PET. Plastics, which are less expensive and safer to transport than glass, are predicted to gain high popularity as more people turn to online platforms.
Glass-based cosmetic jars are being significantly used by premium beauty brands in the cosmetic packaging field as they provide stability and safety. These also help in ensuring the integrity of the product. Glass jars are projected to promote incremental avenues of USD 1.5 million by 2035.
Skincare is projected to be one of the leading categories of the beauty sector. It has become the most important ritual for modern consumers.
The growing importance of skincare among Gen-Z and millennials is contributing to the high demand for cosmetic jar packaging. Skincare is anticipated to gain around half of the share, while the haircare segment is set to rise at a 4.8% CAGR during the forecast period.
Haircare has also become a crucial part of people’s lives, irrespective of gender. Consumers are continually spending on premium hair care products. The strong interest of consumers in their hair health has resulted in prominent growth.
There has been a greater degree of realignment in North America in favor of nutrient-rich, clean brands. As a result, companies that make their variety of lipsticks and multi-sticks with food-grade ingredients are starting to flourish. It is anticipated that this trend will continue to increase the demand for new packaging requirements along similar lines.
In keeping with the worldwide trend, the cosmetics sector is also seeing an increasing demand for premiumization. Hence, there is a growing need for creative and high-quality packaging.
For instance, Estée Lauder introduced the Bobbi Brown Art Stick Liquid Lip in a new color cosmetic container that makes applying liquid lipstick easier. More upscale packaging in glass and specialized cosmetic containers is being driven by this general premiumization.
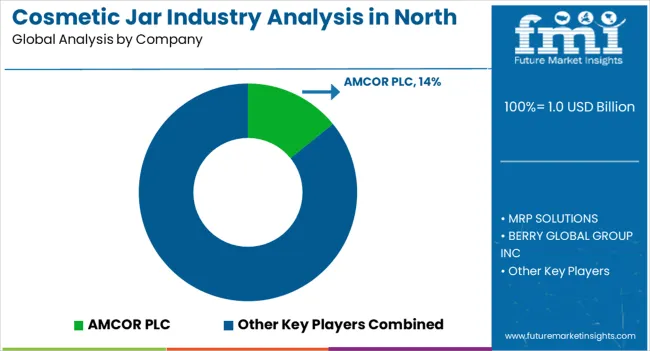
The cosmetic jar business in North America is driven by evolving consumer preferences, expansion of the beauty sector, emerging packaging trends, and the presence of new brands. There are several well-established cosmetic jar manufacturers and cosmetics brands based in North America. They offer a wide variety of designs, materials, and customization options.
Sustainable cosmetic jars have become of significant importance in the cosmetic sector. Hence, manufacturers are developing jars based on eco-friendly and recycled materials.
Companies are also focusing on developing glass cosmetic packaging solutions to replace plastic jars. Recent activities of key players operating in the North America cosmetic jar business are:
| Attribute | Details |
|---|---|
| Estimated North America Cosmetic Jar Revenue (2025) | USD 1.0 billion |
| Projected North America Cosmetic Jar Revenue (2035) | USD 1.5 billion |
| Value-based CAGR (2025 to 2035) | 3.8% |
| Historical Data | 2020 to 2025 |
| Forecast Period | 2025 to 2035 |
| Quantitative Units | Value (USD million) |
| Report Coverage | Revenue Forecast, Volume Forecast, Company Ranking, Competitive Landscape, Growth Factors, Trends and Pricing Analysis |
| Segments Covered | Material, Capacity, End-use, Country |
| Key Country Covered | United States, Canada |
| Key Companies Profiled | MRP SOLUTIONS; AMCOR PLC; BERRY GLOBAL GROUP INC; QUADPACK USA; GERRESHEIMER AG; HCP PACKAGING; HCT GROUP; STOELZLE GLASS GROUP; FH PACKAGING INC.; Albéa Group S.A.S.; RIEKE CORP.; PRETIUM PACKAGING; COSMETIC SPECIALTIES INTERNATIONAL LLC; TAKEMOTO YOHKI CO.LTD |
The global cosmetic jar industry analysis in north america is estimated to be valued at USD 1.0 billion in 2025.
The market size for the cosmetic jar industry analysis in north america is projected to reach USD 1.5 billion by 2035.
The cosmetic jar industry analysis in north america is expected to grow at a 3.8% CAGR between 2025 and 2035.
The key product types in cosmetic jar industry analysis in north america are plastic, glass, metal and others.
In terms of capacity, small (5ml to 50 ml) segment to command 47.3% share in the cosmetic jar industry analysis in north america in 2025.


Full Research Suite comprises of:
Market outlook & trends analysis
Interviews & case studies
Strategic recommendations
Vendor profiles & capabilities analysis
5-year forecasts
8 regions and 60+ country-level data splits
Market segment data splits
12 months of continuous data updates
DELIVERED AS:
PDF EXCEL ONLINE
Cosmetic Pigment Market Forecast and Outlook 2025 to 2035
Cosmetic Dropper Market Size and Share Forecast Outlook 2025 to 2035
Cosmetic Sucrose Cocoate Market Size and Share Forecast Outlook 2025 to 2035
Cosmetic Nanoencapsulation Market Size and Share Forecast Outlook 2025 to 2035
Cosmetic Wax Market Size and Share Forecast Outlook 2025 to 2035
Cosmetic Pencil & Pen Market Size and Share Forecast Outlook 2025 to 2035
Cosmetic Implants Market Size and Share Forecast Outlook 2025 to 2035
Cosmetic Tubes Market by Material Type & Application from 2025 to 2035
Cosmetic Chemicals Market Growth - Trends & Forecast 2025 to 2035
Cosmetics ODM Market Analysis – Size, Trends & Forecast 2025-2035
Cosmetic Surgery Products Market Analysis - Size, Share, and Forecast Outlook 2025 to 2035
Analysis and Growth Projections for Cosmetic Grade Preservative Market
Cosmetic Oil Market Growth - Size, Demand & Forecast 2025 to 2035
Cosmetic Vials Market Trends - Size & Growth 2025 to 2035
Global Cosmetic CDMO Market Analysis – Size, Share & Forecast 2024-2034
Cosmetic Lasers Market
Cosmetic Spray Bottles Market
Cosmetic Ingredients For Hair Removal Market Size and Share Forecast Outlook 2025 to 2035
Cosmetic Filling Machines Market Size and Share Forecast Outlook 2025 to 2035
Cosmetic Kaolin Powder Market Size and Share Forecast Outlook 2025 to 2035

Thank you!
You will receive an email from our Business Development Manager. Please be sure to check your SPAM/JUNK folder too.
Chat With
MaRIA