Reports

- Global Locations -

Headquarters

Future Market Insights, Inc.

Christiana Corporate, 200
Continental Drive, Suite 401,
Newark, Delaware - 19713,
United States

T: +1-845-579-5705

Americas

Future Market Insights, Inc.

616 Corporate Way, Suite 2-9018,
Valley Cottage, NY 10989, United States

T: +1-347-918-3531

MEA

Future Market Insights

1602-6 Jumeirah Bay X2 Tower, Plot No: JLT-PH2-X2A,
Jumeirah Lakes Towers, Dubai,
United Arab Emirates

Europe

Future Market Insights

3rd Floor, 207 Regent Street,
W1B 3HH London
United Kingdom

T: + 44 (0) 20 8123 9659
D: +44 (0) 20 3287 4268

Asia Pacific

Future Market Insights

IndiaLand Global Tech Park, Unit UG-1, Behind Grand HighStreet, Phase 1, Hinjawadi, MH, Pune – 411057, India

Packaging Jars Market Outlook (2022 to 2032)

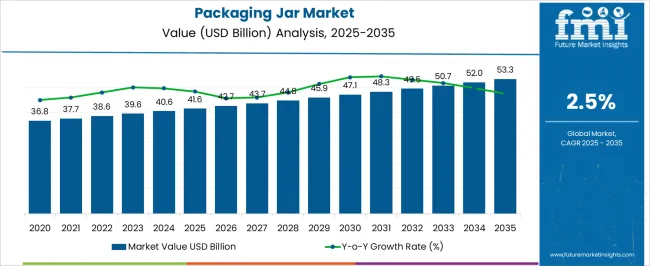
The global packaging jars market is projected to have a moderate-paced CAGR of 2.9% during the forecast period. The current valuation of the market is US$ 33,040.4 Million in 2022. The market value of the packaging jars market is anticipated to reach a value of US$ 43,974.3 Million by the year 2032. A historical CAGR of 2.5% has been recorded by the experts of Future Market Insights for the concerned market.

The demand for packaging jars, in recent years, has been steadily soaring as a result of the widening application spectrum of packaging jars in various end-user sectors, such as cosmetics and personal care, food and beverages, pharmaceuticals, and home care, among others. These jars are employed to protect the products from wear and tear while handling and during transportation. They also offer various functionalities.

The rising sales of packaging jars can be attributed to the rising demand for cosmetics products and personal care across the globe. Moreover, the rising emphasis on sustainable packaging solutions is expected to provide further stimulus to the market development of packaging jars over the course of the forecast period.

Report Attribute Details
Packaging Jars Market Value (2022) US$ 33,040.4 Million
Packaging Jars Market Anticipated Value (2032) US$ 43,974.3 Million
Packaging Jars Projected Growth Rate (2022 to 2032) 2.9%

Don't pay for what you don't need

Customize your report by selecting specific countries or regions and save 30%!

Prominent Drivers in the Packaging Jars Market

FMI has analyzed that a large number of elements are likely to drive the growth of the packaging jars market in the upcoming years and unravel a positive dimension to the concerned market. They are as follows:

  • The packaging jars market is being driven by the surging demand for the product in the cosmetics and personal care sector owing to rising consciousness among consumers pertaining to personal appearance.
  • The packaging jars possess high chemical resistivity, are light in weight, and are easy to use. The demand for packaging jars is spurring owing to a growing requirement for packaging solutions for storing purposes, such as pharmaceutical items and chemical solvents.
  • Additionally, the heightened demand for effective and cost-efficient packaging formats across different industries, especially in the food and beverage industry, is likely to boost the market growth.
  • Rising urbanization and inflating disposable income across geographies are predicted to facilitate market growth over the forecast period. The market is also expected to be influenced by e-commerce transportation and online retail positively.

Factors Restraining the Expansion of the Packaging Jars Market

Besides the factors bolstering the growth of the packaging jars market, the expert analysts at FMI have also identified some elements that are likely to hinder the pace of advancement in the long run. They are as follows:

  • The fluctuating prices of raw materials might derail the market for packaging jars in the upcoming years.
  • Another limiting factor for the market includes rising pressure on the packaging jar manufacturers.
  • The implementation of strict regulatory policies is anticipated to challenge the packaging jars usage, especially the plastic ones.
Ismail Sutaria
Ismail Sutaria

Principal Consultant

Talk to Analyst

Find your sweet spots for generating winning opportunities in this market.

Regional Outlook

Growth Prospect of Packaging Jars in Regional Markets

Region North America
Statistics

North America is projected to dominate the global packaging jars market through 2032.

At present, this region is accountable for a market share of 18% globally.

Responsible Factors

The factors attributing to the rising market size for packaging jars in North America are:

  • Growing demand for durable, impact-resistant, and cost-effective packaging in this region is fueling the market growth.
  • The presence of key market players in North America is projected to aid the growth of the forum.
Region Europe
Statistics

Europe is projected to hold the second-largest share in the global packaging jars market after North America.

Currently, the Europe region is accountable for a market share of 15% in 2022.

Responsible Factors

Key elements bolstering the market size in Europe can be identified:

  • The regional growth of packaging jars is expected to be propelled by technological advancements in the market.
  • Further, the rising expansion of e-commerce and online retail platform has boosted transportation essentials, which is fueling the demand for packaging jars.
Region Asia Pacific
Statistics The Asia Pacific region is projected to witness rapid growth in the global packaging jars market.
Responsible Factors

The aspects fueling the growth of the packaging jars market in the Asia Pacific region are:

  • A large consumer base for packaging jars, coupled with rapid urbanization are key demand drivers.
  • Further, the extending applications of packaging jars in various sectors, such as healthcare, food and beverage, and administration, in the Asia Pacific region are likely to boost further growth of the market through 2032.

Rising Innovations by the New Entrants to Propel Market Growth in the Forecast Period

The new entrants in the market are offering sustainable packaging solutions to reduce carbon footprint. Glass, which is considered an excellent packaging material, is being considered by small businesses and start-ups to lessen the dependency on recyclable plastic. Glass can be recycled indefinitely without losing quality, improves the food taste, is microwave safe, reduces harmful emissions, and offers premium appearing packaging solutions. Further, the incoming of start-ups has also resulted in strong competition and innovation. Many start-ups are offering packaging solutions that promote healthy living, keeping in mind the fast-paced lifestyle of consumers.

Fuze

In March 2020, the start-up conceptualized FUZE and commenced with the Research and Development activities, investment, and prototypes to launch the premium quality Borosilicate Glass bottle via online and offline channels on December 2020. The product is a unique combination of glass and raw detachable copper filter to charge water with health-beneficial properties, thereby promoting healthy living among the urban population. The material used in the filter is raw copper, which has no extra coating and lacquering, thus preventing the bottles from any chemical contamination.

Get the data you need at a Fraction of the cost

Personalize your report by choosing insights you need
and save 40%!

Competitive Landscape

Biggies Revolutionizing the Market

The key players proliferating in the forum are focusing on introducing new products and enhancing their product offerings to better cater to the changing needs of the end-user industries while retaining their competitiveness globally.

There is keen attention paid by the market players to the maintenance of the quality of products and innovation. They are also trying to diversify its range of manufacturing, indulging in mergers and acquisitions, and adopting organic growth strategies for a strong foothold in the global market.

Recent Developments

  • In January 2021, Owens-Illinois, a glass bottle manufacturer, announced that it has fired up a formerly idled furnace at its Waco, Texas plant, as a result of heightened demand for alcoholic-beverage bottles due to the pandemic. The bottles witnessed increased demand due to more people drinking at home since bars and restaurants slowed or halted their operations during this time. Each furnace produces glass containers as per the specifications of the customers, including the use of recycled glass.
  • In January 2021, Graham Packaging, a global leading company in the conception and manufacturing of sustainable, innovative packaging solutions, launched a new website and corporate identity. Through this, the company aims to reintroduce itself to reinstate and elevate its commitment to smart, and sustainable packaging that has minimal impact on the planet.

Some of the key companies in the market are:

  • Owens Illinois Group Inc.
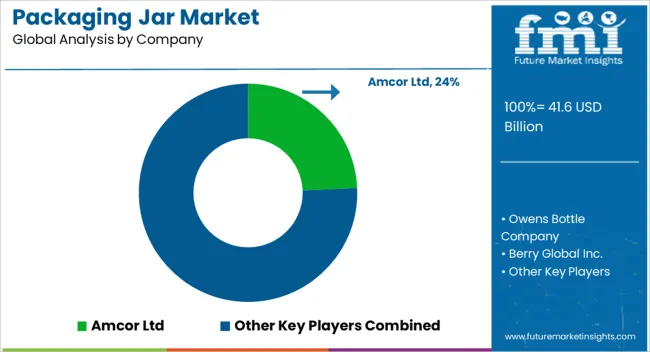
  • Amcor Ltd
  • Owens Bottle Company
  • Berry Global Inc.
  • Graham Packaging Company Inc.
  • Ball Corporation
  • Silgan Holdings Inc.
  • AG Poly Packs Ltd.
  • Olcott Plastics, Inc.
  • Cospak Pty Ltd.
  • Beatson Clark.
  • Great Western Containers Inc
  • Ajanta Bottle Pvt Ltd

Report Scope

Report Attribute Details
Growth Rate CAGR of 2.9% from 2022 to 2032
Base Year for Estimation 2021
Historical Data 2016 to 2021
Forecast Period 2022 to 2032
Quantitative Units Revenue in US$ million and CAGR from 2022 to 2032
Report Coverage Revenue Forecast, Volume Forecast, Company Ranking, Competitive Landscape, Growth Factors, Trends, and Pricing Analysis
Segments Covered
  • Material Type
  • Product Type
  • Capacity
  • End User
  • Region
Regions Covered
  • North America
  • Latin America
  • Europe
  • East Asia
  • South Asia
  • Oceania
  • Middle East and Africa
Key Countries Profiled
  • USA
  • Canada
  • Brazil
  • Argentina
  • Germany
  • United Kingdom
  • France
  • Spain
  • Italy
  • Nordics
  • BENELUX
  • Australia & New Zealand
  • China
  • India
  • ASIAN
  • GCC Countries
  • South Africa
Key Companies Profiled
  • Owens Illinois Group Inc.
  • Amcor Ltd
  • Owens Bottle Company
  • Berry Global Inc.
  • Graham Packaging Company Inc.
  • Ball Corporation
  • Silgan Holdings Inc.
  • AG Poly Packs Ltd.
  • Olcott Plastics, Inc.
  • Cospak Pty Ltd.
  • Beatson Clark.
  • Great Western Containers Inc
  • Ajanta Bottle Pvt Ltd
Customization Available Upon Request

Key Segments in the Packaging Jars Market

By Material Type :

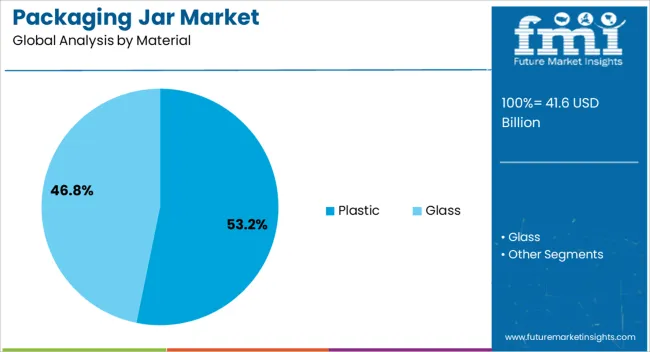
  • Plastic
    • Polyethylene (PE)
    • HDPE
    • LDPE
    • Polyethylene Terephthalate (PET)
    • Polyvinyl Chloride (PVC)
    • Polystyrene (PS)
    • Polypropylene (PP)
    • Ethyl Vinyl Alcohol (EVOH)
  • Glass

By Product Type:

  • Straight Sided
  • Snap-Top
  • Domed Based
  • Taped Jars
  • Others

By Capacity:

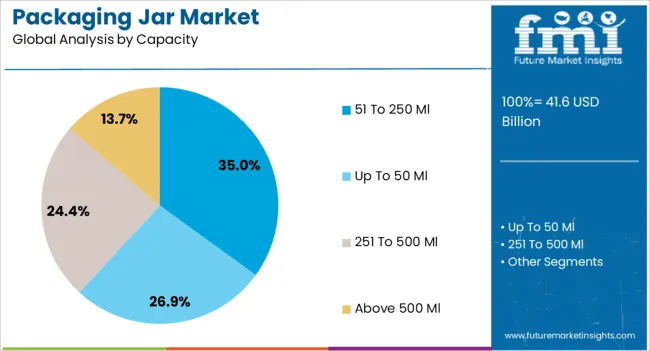
  • Small Size (Less than 10 oz)
  • Medium Size (10 oz to 30 oz)
  • Large Size (30 oz to 100 oz)
  • Very Large Size (100 oz & above)

By End User:

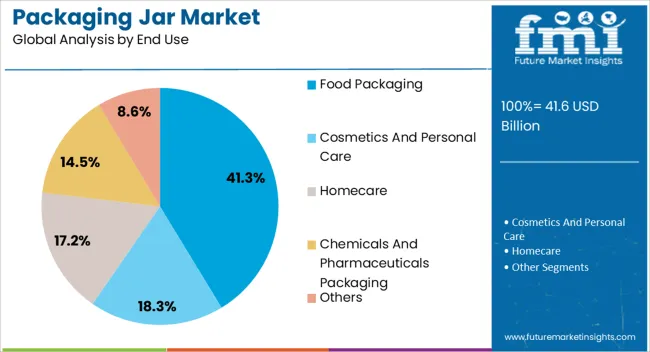
  • Food and Beverages
  • Cosmetics and Personal Care
  • Home Care
  • Pharmaceuticals
  • Chemicals and Lubricants
  • Others

By Region:

  • North America
  • Latin America
  • Asia Pacific
  • Middle East and Africa
  • Europe

Frequently Asked Questions

What is the Growth Outlook for the Packaging Jars Market?

The growth outlook for the packaging jars market is predicted to advance at a CAGR of 2.9% from 2022 to 2032.

Which Region Leads the Packaging Jars Market?

The North American region is anticipated to lead the packaging jars market during the forecast period.

How much Growth Potential does the Packaging Jars Market hold?

The packaging jars market is likely to hold a valuation of US$ 43,974.3 Million by 2032.

Which sector is the key driver in the Packaging Jars Market?

The food and beverage sector is the key driver in the packaging jars market.

Table of Content

1. Executive Summary | Packaging Jars Market

    1.1. Global Market Outlook

    1.2. Demand-side Trends

    1.3. Supply-side Trends

    1.4. Technology Roadmap Analysis

    1.5. Analysis and Recommendations

2. Market Overview

    2.1. Market Coverage / Taxonomy

    2.2. Market Definition / Scope / Limitations

3. Market Background

    3.1. Market Dynamics

        3.1.1. Drivers

        3.1.2. Restraints

        3.1.3. Opportunity

        3.1.4. Trends

    3.2. Scenario Forecast

        3.2.1. Demand in Optimistic Scenario

        3.2.2. Demand in Likely Scenario

        3.2.3. Demand in Conservative Scenario

    3.3. Opportunity Map Analysis

    3.4. Product Life Cycle Analysis

    3.5. Supply Chain Analysis

        3.5.1. Supply Side Participants and their Roles

            3.5.1.1. Producers

            3.5.1.2. Mid-Level Participants (Traders/ Agents/ Brokers)

            3.5.1.3. Wholesalers and Distributors

        3.5.2. Value Added and Value Created at Node in the Supply Chain

        3.5.3. List of Raw Material Suppliers

        3.5.4. List of Existing and Potential Buyers

    3.6. Investment Feasibility Matrix

    3.7. Value Chain Analysis

        3.7.1. Profit Margin Analysis

        3.7.2. Wholesalers and Distributors

        3.7.3. Retailers

    3.8. PESTLE and Porter’s Analysis

    3.9. Regulatory Landscape

        3.9.1. By Key Regions

        3.9.2. By Key Countries

    3.10. Regional Parent Market Outlook

    3.11. Production and Consumption Statistics

    3.12. Import and Export Statistics

4. Global Market Analysis 2017 to 2021 and Forecast, 2022 to 2032

    4.1. Historical Market Size Value (US$ Million) & Volume (Units) Analysis, 2017 to 2021

    4.2. Current and Future Market Size Value (US$ Million) & Volume (Units) Projections, 2022 to 2032

        4.2.1. Y-o-Y Growth Trend Analysis

        4.2.2. Absolute $ Opportunity Analysis

5. Global Market Analysis 2017 to 2021 and Forecast 2022 to 2032, By Material Type

    5.1. Introduction / Key Findings

    5.2. Historical Market Size Value (US$ Million) & Volume (Units) Analysis By Material Type, 2017 to 2021

    5.3. Current and Future Market Size Value (US$ Million) & Volume (Units) Analysis and Forecast By Material Type, 2022 to 2032

        5.3.1. Plastic

            5.3.1.1. Polyethylene (PE)

            5.3.1.2. HDPE

            5.3.1.3. LDPE

            5.3.1.4. Polyethylene Terephthalate (PET)

            5.3.1.5. Polyvinyl Chloride (PVC)

            5.3.1.6. Polystyrene (PS)

            5.3.1.7. Polypropylene (PP)

            5.3.1.8. Ethyl Vinyl Alcohol (EVOH)

            5.3.1.9. Others

        5.3.2. Glass

    5.4. Y-o-Y Growth Trend Analysis By Material Type, 2017 to 2021

    5.5. Absolute $ Opportunity Analysis By Material Type, 2022 to 2032

6. Global Market Analysis 2017 to 2021 and Forecast 2022 to 2032, By Product Type

    6.1. Introduction / Key Findings

    6.2. Historical Market Size Value (US$ Million) & Volume (Units) Analysis By Product Type, 2017 to 2021

    6.3. Current and Future Market Size Value (US$ Million) & Volume (Units) Analysis and Forecast By Product Type, 2022 to 2032

        6.3.1. Straight Sided

        6.3.2. Snap Top

        6.3.3. Domed Based

        6.3.4. Taped Jars

        6.3.5. Others

    6.4. Y-o-Y Growth Trend Analysis By Product Type, 2017 to 2021

    6.5. Absolute $ Opportunity Analysis By Product Type, 2022 to 2032

7. Global Market Analysis 2017 to 2021 and Forecast 2022 to 2032, By Capacity

    7.1. Introduction / Key Findings

    7.2. Historical Market Size Value (US$ Million) & Volume (Units) Analysis By Capacity, 2017 to 2021

    7.3. Current and Future Market Size Value (US$ Million) & Volume (Units) Analysis and Forecast By Capacity, 2022 to 2032

        7.3.1. Small Size (Less than 10 oz)

        7.3.2. Medium Size (10 oz to 30 oz)

        7.3.3. Large Size (30 oz to 100 oz)

        7.3.4. Very Large Size (100 oz & Above)

    7.4. Y-o-Y Growth Trend Analysis By Capacity, 2017 to 2021

    7.5. Absolute $ Opportunity Analysis By Capacity, 2022 to 2032

8. Global Market Analysis 2017 to 2021 and Forecast 2022 to 2032, By End User

    8.1. Introduction / Key Findings

    8.2. Historical Market Size Value (US$ Million) & Volume (Units) Analysis By End User, 2017 to 2021

    8.3. Current and Future Market Size Value (US$ Million) & Volume (Units) Analysis and Forecast By End User, 2022 to 2032

        8.3.1. Food & Beverages

        8.3.2. Cosmetics & Personal Care

        8.3.3. Home Care

        8.3.4. Pharmaceuticals

        8.3.5. Chemicals & Lubricants

        8.3.6. Others

    8.4. Y-o-Y Growth Trend Analysis By End User, 2017 to 2021

    8.5. Absolute $ Opportunity Analysis By End User, 2022 to 2032

9. Global Market Analysis 2017 to 2021 and Forecast 2022 to 2032, By Region

    9.1. Introduction

    9.2. Historical Market Size Value (US$ Million) & Volume (Units) Analysis By Region, 2017 to 2021

    9.3. Current Market Size Value (US$ Million) & Volume (Units) Analysis and Forecast By Region, 2022 to 2032

        9.3.1. North America

        9.3.2. Latin America

        9.3.3. Europe

        9.3.4. Asia Pacific

        9.3.5. Middle East and Africa

    9.4. Market Attractiveness Analysis By Region

10. North America Market Analysis 2017 to 2021 and Forecast 2022 to 2032, By Country

    10.1. Historical Market Size Value (US$ Million) & Volume (Units) Trend Analysis By Market Taxonomy, 2017 to 2021

    10.2. Market Size Value (US$ Million) & Volume (Units) Forecast By Market Taxonomy, 2022 to 2032

        10.2.1. By Country

            10.2.1.1. USA

            10.2.1.2. Canada

        10.2.2. By Material Type

        10.2.3. By Product Type

        10.2.4. By Capacity

        10.2.5. By End User

    10.3. Market Attractiveness Analysis

        10.3.1. By Country

        10.3.2. By Material Type

        10.3.3. By Product Type

        10.3.4. By Capacity

        10.3.5. By End User

    10.4. Key Takeaways

11. Latin America Market Analysis 2017 to 2021 and Forecast 2022 to 2032, By Country

    11.1. Historical Market Size Value (US$ Million) & Volume (Units) Trend Analysis By Market Taxonomy, 2017 to 2021

    11.2. Market Size Value (US$ Million) & Volume (Units) Forecast By Market Taxonomy, 2022 to 2032

        11.2.1. By Country

            11.2.1.1. Brazil

            11.2.1.2. Mexico

            11.2.1.3. Rest of Latin America

        11.2.2. By Material Type

        11.2.3. By Product Type

        11.2.4. By Capacity

        11.2.5. By End User

    11.3. Market Attractiveness Analysis

        11.3.1. By Country

        11.3.2. By Material Type

        11.3.3. By Product Type

        11.3.4. By Capacity

        11.3.5. By End User

    11.4. Key Takeaways

12. Europe Market Analysis 2017 to 2021 and Forecast 2022 to 2032, By Country

    12.1. Historical Market Size Value (US$ Million) & Volume (Units) Trend Analysis By Market Taxonomy, 2017 to 2021

    12.2. Market Size Value (US$ Million) & Volume (Units) Forecast By Market Taxonomy, 2022 to 2032

        12.2.1. By Country

            12.2.1.1. Germany

            12.2.1.2. United Kingdom

            12.2.1.3. France

            12.2.1.4. Spain

            12.2.1.5. Italy

            12.2.1.6. Rest of Europe

        12.2.2. By Material Type

        12.2.3. By Product Type

        12.2.4. By Capacity

        12.2.5. By End User

    12.3. Market Attractiveness Analysis

        12.3.1. By Country

        12.3.2. By Material Type

        12.3.3. By Product Type

        12.3.4. By Capacity

        12.3.5. By End User

    12.4. Key Takeaways

13. Asia Pacific Market Analysis 2017 to 2021 and Forecast 2022 to 2032, By Country

    13.1. Historical Market Size Value (US$ Million) & Volume (Units) Trend Analysis By Market Taxonomy, 2017 to 2021

    13.2. Market Size Value (US$ Million) & Volume (Units) Forecast By Market Taxonomy, 2022 to 2032

        13.2.1. By Country

            13.2.1.1. China

            13.2.1.2. Japan

            13.2.1.3. South Korea

            13.2.1.4. Malaysia

            13.2.1.5. Singapore

            13.2.1.6. Australia

            13.2.1.7. New Zealand

            13.2.1.8. Rest of Asia Pacific

        13.2.2. By Material Type

        13.2.3. By Product Type

        13.2.4. By Capacity

        13.2.5. By End User

    13.3. Market Attractiveness Analysis

        13.3.1. By Country

        13.3.2. By Material Type

        13.3.3. By Product Type

        13.3.4. By Capacity

        13.3.5. By End User

    13.4. Key Takeaways

14. Middle East and Africa Market Analysis 2017 to 2021 and Forecast 2022 to 2032, By Country

    14.1. Historical Market Size Value (US$ Million) & Volume (Units) Trend Analysis By Market Taxonomy, 2017 to 2021

    14.2. Market Size Value (US$ Million) & Volume (Units) Forecast By Market Taxonomy, 2022 to 2032

        14.2.1. By Country

            14.2.1.1. GCC Countries

            14.2.1.2. South Africa

            14.2.1.3. Israel

            14.2.1.4. Rest of Middle East and Africa

        14.2.2. By Material Type

        14.2.3. By Product Type

        14.2.4. By Capacity

        14.2.5. By End User

    14.3. Market Attractiveness Analysis

        14.3.1. By Country

        14.3.2. By Material Type

        14.3.3. By Product Type

        14.3.4. By Capacity

        14.3.5. By End User

    14.4. Key Takeaways

15. Key Countries Market Analysis

    15.1. USA

        15.1.1. Pricing Analysis

        15.1.2. Market Share Analysis, 2021

            15.1.2.1. By Material Type

            15.1.2.2. By Product Type

            15.1.2.3. By Capacity

            15.1.2.4. By End User

    15.2. Canada

        15.2.1. Pricing Analysis

        15.2.2. Market Share Analysis, 2021

            15.2.2.1. By Material Type

            15.2.2.2. By Product Type

            15.2.2.3. By Capacity

            15.2.2.4. By End User

    15.3. Brazil

        15.3.1. Pricing Analysis

        15.3.2. Market Share Analysis, 2021

            15.3.2.1. By Material Type

            15.3.2.2. By Product Type

            15.3.2.3. By Capacity

            15.3.2.4. By End User

    15.4. Mexico

        15.4.1. Pricing Analysis

        15.4.2. Market Share Analysis, 2021

            15.4.2.1. By Material Type

            15.4.2.2. By Product Type

            15.4.2.3. By Capacity

            15.4.2.4. By End User

    15.5. Germany

        15.5.1. Pricing Analysis

        15.5.2. Market Share Analysis, 2021

            15.5.2.1. By Material Type

            15.5.2.2. By Product Type

            15.5.2.3. By Capacity

            15.5.2.4. By End User

    15.6. United Kingdom

        15.6.1. Pricing Analysis

        15.6.2. Market Share Analysis, 2021

            15.6.2.1. By Material Type

            15.6.2.2. By Product Type

            15.6.2.3. By Capacity

            15.6.2.4. By End User

    15.7. France

        15.7.1. Pricing Analysis

        15.7.2. Market Share Analysis, 2021

            15.7.2.1. By Material Type

            15.7.2.2. By Product Type

            15.7.2.3. By Capacity

            15.7.2.4. By End User

    15.8. Spain

        15.8.1. Pricing Analysis

        15.8.2. Market Share Analysis, 2021

            15.8.2.1. By Material Type

            15.8.2.2. By Product Type

            15.8.2.3. By Capacity

            15.8.2.4. By End User

    15.9. Italy

        15.9.1. Pricing Analysis

        15.9.2. Market Share Analysis, 2021

            15.9.2.1. By Material Type

            15.9.2.2. By Product Type

            15.9.2.3. By Capacity

            15.9.2.4. By End User

    15.10. China

        15.10.1. Pricing Analysis

        15.10.2. Market Share Analysis, 2021

            15.10.2.1. By Material Type

            15.10.2.2. By Product Type

            15.10.2.3. By Capacity

            15.10.2.4. By End User

    15.11. Japan

        15.11.1. Pricing Analysis

        15.11.2. Market Share Analysis, 2021

            15.11.2.1. By Material Type

            15.11.2.2. By Product Type

            15.11.2.3. By Capacity

            15.11.2.4. By End User

    15.12. South Korea

        15.12.1. Pricing Analysis

        15.12.2. Market Share Analysis, 2021

            15.12.2.1. By Material Type

            15.12.2.2. By Product Type

            15.12.2.3. By Capacity

            15.12.2.4. By End User

    15.13. Malaysia

        15.13.1. Pricing Analysis

        15.13.2. Market Share Analysis, 2021

            15.13.2.1. By Material Type

            15.13.2.2. By Product Type

            15.13.2.3. By Capacity

            15.13.2.4. By End User

    15.14. Singapore

        15.14.1. Pricing Analysis

        15.14.2. Market Share Analysis, 2021

            15.14.2.1. By Material Type

            15.14.2.2. By Product Type

            15.14.2.3. By Capacity

            15.14.2.4. By End User

    15.15. Australia

        15.15.1. Pricing Analysis

        15.15.2. Market Share Analysis, 2021

            15.15.2.1. By Material Type

            15.15.2.2. By Product Type

            15.15.2.3. By Capacity

            15.15.2.4. By End User

    15.16. New Zealand

        15.16.1. Pricing Analysis

        15.16.2. Market Share Analysis, 2021

            15.16.2.1. By Material Type

            15.16.2.2. By Product Type

            15.16.2.3. By Capacity

            15.16.2.4. By End User

    15.17. GCC Countries

        15.17.1. Pricing Analysis

        15.17.2. Market Share Analysis, 2021

            15.17.2.1. By Material Type

            15.17.2.2. By Product Type

            15.17.2.3. By Capacity

            15.17.2.4. By End User

    15.18. South Africa

        15.18.1. Pricing Analysis

        15.18.2. Market Share Analysis, 2021

            15.18.2.1. By Material Type

            15.18.2.2. By Product Type

            15.18.2.3. By Capacity

            15.18.2.4. By End User

    15.19. Israel

        15.19.1. Pricing Analysis

        15.19.2. Market Share Analysis, 2021

            15.19.2.1. By Material Type

            15.19.2.2. By Product Type

            15.19.2.3. By Capacity

            15.19.2.4. By End User

16. Market Structure Analysis

    16.1. Competition Dashboard

    16.2. Competition Benchmarking

    16.3. Market Share Analysis of Top Players

        16.3.1. By Regional

        16.3.2. By Material Type

        16.3.3. By Product Type

        16.3.4. By Capacity

        16.3.5. By End User

17. Competition Analysis

    17.1. Competition Deep Dive

        17.1.1. Owens Illinois Group

            17.1.1.1. Overview

            17.1.1.2. Product Portfolio

            17.1.1.3. Profitability by Market Segments

            17.1.1.4. Sales Footprint

            17.1.1.5. Strategy Overview

                17.1.1.5.1. Marketing Strategy

                17.1.1.5.2. Product Strategy

                17.1.1.5.3. Channel Strategy

        17.1.2. Amcor Ltd

            17.1.2.1. Overview

            17.1.2.2. Product Portfolio

            17.1.2.3. Profitability by Market Segments

            17.1.2.4. Sales Footprint

            17.1.2.5. Strategy Overview

                17.1.2.5.1. Marketing Strategy

                17.1.2.5.2. Product Strategy

                17.1.2.5.3. Channel Strategy

        17.1.3. Berry Global

            17.1.3.1. Overview

            17.1.3.2. Product Portfolio

            17.1.3.3. Profitability by Market Segments

            17.1.3.4. Sales Footprint

            17.1.3.5. Strategy Overview

                17.1.3.5.1. Marketing Strategy

                17.1.3.5.2. Product Strategy

                17.1.3.5.3. Channel Strategy

        17.1.4. Graham Packaging Company Inc.

            17.1.4.1. Overview

            17.1.4.2. Product Portfolio

            17.1.4.3. Profitability by Market Segments

            17.1.4.4. Sales Footprint

            17.1.4.5. Strategy Overview

                17.1.4.5.1. Marketing Strategy

                17.1.4.5.2. Product Strategy

                17.1.4.5.3. Channel Strategy

        17.1.5. Ball Corporation

            17.1.5.1. Overview

            17.1.5.2. Product Portfolio

            17.1.5.3. Profitability by Market Segments

            17.1.5.4. Sales Footprint

            17.1.5.5. Strategy Overview

                17.1.5.5.1. Marketing Strategy

                17.1.5.5.2. Product Strategy

                17.1.5.5.3. Channel Strategy

        17.1.6. Silgan Holdings Inc

            17.1.6.1. Overview

            17.1.6.2. Product Portfolio

            17.1.6.3. Profitability by Market Segments

            17.1.6.4. Sales Footprint

            17.1.6.5. Strategy Overview

                17.1.6.5.1. Marketing Strategy

                17.1.6.5.2. Product Strategy

                17.1.6.5.3. Channel Strategy

        17.1.7. Ontario Plastic Container Producers Ltd

            17.1.7.1. Overview

            17.1.7.2. Product Portfolio

            17.1.7.3. Profitability by Market Segments

            17.1.7.4. Sales Footprint

            17.1.7.5. Strategy Overview

                17.1.7.5.1. Marketing Strategy

                17.1.7.5.2. Product Strategy

                17.1.7.5.3. Channel Strategy

        17.1.8. Container Corporation of Canada Ltd

            17.1.8.1. Overview

            17.1.8.2. Product Portfolio

            17.1.8.3. Profitability by Market Segments

            17.1.8.4. Sales Footprint

            17.1.8.5. Strategy Overview

                17.1.8.5.1. Marketing Strategy

                17.1.8.5.2. Product Strategy

                17.1.8.5.3. Channel Strategy

        17.1.9. Raepak Ltd

            17.1.9.1. Overview

            17.1.9.2. Product Portfolio

            17.1.9.3. Profitability by Market Segments

            17.1.9.4. Sales Footprint

            17.1.9.5. Strategy Overview

                17.1.9.5.1. Marketing Strategy

                17.1.9.5.2. Product Strategy

                17.1.9.5.3. Channel Strategy

        17.1.10. Alpha Packaging

            17.1.10.1. Overview

            17.1.10.2. Product Portfolio

            17.1.10.3. Profitability by Market Segments

            17.1.10.4. Sales Footprint

            17.1.10.5. Strategy Overview

                17.1.10.5.1. Marketing Strategy

                17.1.10.5.2. Product Strategy

                17.1.10.5.3. Channel Strategy

        17.1.11. Olcott Plastics

            17.1.11.1. Overview

            17.1.11.2. Product Portfolio

            17.1.11.3. Profitability by Market Segments

            17.1.11.4. Sales Footprint

            17.1.11.5. Strategy Overview

                17.1.11.5.1. Marketing Strategy

                17.1.11.5.2. Product Strategy

                17.1.11.5.3. Channel Strategy

        17.1.12. Cospak 

            17.1.12.1. Overview

            17.1.12.2. Product Portfolio

            17.1.12.3. Profitability by Market Segments

            17.1.12.4. Sales Footprint

            17.1.12.5. Strategy Overview

                17.1.12.5.1. Marketing Strategy

                17.1.12.5.2. Product Strategy

                17.1.12.5.3. Channel Strategy

        17.1.13. Great Western Containers Inc.

            17.1.13.1. Overview

            17.1.13.2. Product Portfolio

            17.1.13.3. Profitability by Market Segments

            17.1.13.4. Sales Footprint

            17.1.13.5. Strategy Overview

                17.1.13.5.1. Marketing Strategy

                17.1.13.5.2. Product Strategy

                17.1.13.5.3. Channel Strategy

18. Assumptions & Acronyms Used

19. Research Methodology

Don't pay for what you don't need

Customize your report by selecting specific countries or regions and save 30%!

List of Tables

Table 01: Global Market Value (US$ Million) Forecast by Region, 2017 to 2032

Table 02: Global Market Volume (Units) Forecast by Region, 2017 to 2032

Table 03: Global Market Value (US$ Million) Forecast by Material Type, 2017 to 2032

Table 04: Global Market Volume (Units) Forecast by Material Type, 2017 to 2032

Table 05: Global Market Value (US$ Million) Forecast by Product Type, 2017 to 2032

Table 06: Global Market Volume (Units) Forecast by Product Type, 2017 to 2032

Table 07: Global Market Value (US$ Million) Forecast by Capacity, 2017 to 2032

Table 08: Global Market Volume (Units) Forecast by Capacity, 2017 to 2032

Table 09: Global Market Value (US$ Million) Forecast by End User, 2017 to 2032

Table 10: Global Market Volume (Units) Forecast by End User, 2017 to 2032

Table 11: North America Market Value (US$ Million) Forecast by Country, 2017 to 2032

Table 12: North America Market Volume (Units) Forecast by Country, 2017 to 2032

Table 13: North America Market Value (US$ Million) Forecast by Material Type, 2017 to 2032

Table 14: North America Market Volume (Units) Forecast by Material Type, 2017 to 2032

Table 15: North America Market Value (US$ Million) Forecast by Product Type, 2017 to 2032

Table 16: North America Market Volume (Units) Forecast by Product Type, 2017 to 2032

Table 17: North America Market Value (US$ Million) Forecast by Capacity, 2017 to 2032

Table 18: North America Market Volume (Units) Forecast by Capacity, 2017 to 2032

Table 19: North America Market Value (US$ Million) Forecast by End User, 2017 to 2032

Table 20: North America Market Volume (Units) Forecast by End User, 2017 to 2032

Table 21: Latin America Market Value (US$ Million) Forecast by Country, 2017 to 2032

Table 22: Latin America Market Volume (Units) Forecast by Country, 2017 to 2032

Table 23: Latin America Market Value (US$ Million) Forecast by Material Type, 2017 to 2032

Table 24: Latin America Market Volume (Units) Forecast by Material Type, 2017 to 2032

Table 25: Latin America Market Value (US$ Million) Forecast by Product Type, 2017 to 2032

Table 26: Latin America Market Volume (Units) Forecast by Product Type, 2017 to 2032

Table 27: Latin America Market Value (US$ Million) Forecast by Capacity, 2017 to 2032

Table 28: Latin America Market Volume (Units) Forecast by Capacity, 2017 to 2032

Table 29: Latin America Market Value (US$ Million) Forecast by End User, 2017 to 2032

Table 30: Latin America Market Volume (Units) Forecast by End User, 2017 to 2032

Table 31: Europe Market Value (US$ Million) Forecast by Country, 2017 to 2032

Table 32: Europe Market Volume (Units) Forecast by Country, 2017 to 2032

Table 33: Europe Market Value (US$ Million) Forecast by Material Type, 2017 to 2032

Table 34: Europe Market Volume (Units) Forecast by Material Type, 2017 to 2032

Table 35: Europe Market Value (US$ Million) Forecast by Product Type, 2017 to 2032

Table 36: Europe Market Volume (Units) Forecast by Product Type, 2017 to 2032

Table 37: Europe Market Value (US$ Million) Forecast by Capacity, 2017 to 2032

Table 38: Europe Market Volume (Units) Forecast by Capacity, 2017 to 2032

Table 39: Europe Market Value (US$ Million) Forecast by End User, 2017 to 2032

Table 40: Europe Market Volume (Units) Forecast by End User, 2017 to 2032

Table 41: Asia Pacific Market Value (US$ Million) Forecast by Country, 2017 to 2032

Table 42: Asia Pacific Market Volume (Units) Forecast by Country, 2017 to 2032

Table 43: Asia Pacific Market Value (US$ Million) Forecast by Material Type, 2017 to 2032

Table 44: Asia Pacific Market Volume (Units) Forecast by Material Type, 2017 to 2032

Table 45: Asia Pacific Market Value (US$ Million) Forecast by Product Type, 2017 to 2032

Table 46: Asia Pacific Market Volume (Units) Forecast by Product Type, 2017 to 2032

Table 47: Asia Pacific Market Value (US$ Million) Forecast by Capacity, 2017 to 2032

Table 48: Asia Pacific Market Volume (Units) Forecast by Capacity, 2017 to 2032

Table 49: Asia Pacific Market Value (US$ Million) Forecast by End User, 2017 to 2032

Table 50: Asia Pacific Market Volume (Units) Forecast by End User, 2017 to 2032

Table 51: Middle East and Africa Market Value (US$ Million) Forecast by Country, 2017 to 2032

Table 52: Middle East and Africa Market Volume (Units) Forecast by Country, 2017 to 2032

Table 53: Middle East and Africa Market Value (US$ Million) Forecast by Material Type, 2017 to 2032

Table 54: Middle East and Africa Market Volume (Units) Forecast by Material Type, 2017 to 2032

Table 55: Middle East and Africa Market Value (US$ Million) Forecast by Product Type, 2017 to 2032

Table 56: Middle East and Africa Market Volume (Units) Forecast by Product Type, 2017 to 2032

Table 57: Middle East and Africa Market Value (US$ Million) Forecast by Capacity, 2017 to 2032

Table 58: Middle East and Africa Market Volume (Units) Forecast by Capacity, 2017 to 2032

Table 59: Middle East and Africa Market Value (US$ Million) Forecast by End User, 2017 to 2032

Table 60: Middle East and Africa Market Volume (Units) Forecast by End User, 2017 to 2032
Ismail Sutaria
Ismail Sutaria

Principal Consultant

Talk to Analyst

Find your sweet spots for generating winning opportunities in this market.

List of Charts

Figure 01: Global Market Value (US$ Million) by Material Type, 2022 to 2032

Figure 02: Global Market Value (US$ Million) by Product Type, 2022 to 2032

Figure 03: Global Market Value (US$ Million) by Capacity, 2022 to 2032

Figure 04: Global Market Value (US$ Million) by End User, 2022 to 2032

Figure 05: Global Market Value (US$ Million) by Region, 2022 to 2032

Figure 06: Global Market Value (US$ Million) Analysis by Region, 2017 to 2032

Figure 07: Global Market Volume (Units) Analysis by Region, 2017 to 2032

Figure 08: Global Market Value Share (%) and BPS Analysis by Region, 2022 to 2032

Figure 09: Global Market Y-o-Y Growth (%) Projections by Region, 2022 to 2032

Figure 10: Global Market Value (US$ Million) Analysis by Material Type, 2017 to 2032

Figure 11: Global Market Volume (Units) Analysis by Material Type, 2017 to 2032

Figure 12: Global Market Value Share (%) and BPS Analysis by Material Type, 2022 to 2032

Figure 13: Global Market Y-o-Y Growth (%) Projections by Material Type, 2022 to 2032

Figure 14: Global Market Value (US$ Million) Analysis by Product Type, 2017 to 2032

Figure 15: Global Market Volume (Units) Analysis by Product Type, 2017 to 2032

Figure 16: Global Market Value Share (%) and BPS Analysis by Product Type, 2022 to 2032

Figure 17: Global Market Y-o-Y Growth (%) Projections by Product Type, 2022 to 2032

Figure 18: Global Market Value (US$ Million) Analysis by Capacity, 2017 to 2032

Figure 19: Global Market Volume (Units) Analysis by Capacity, 2017 to 2032

Figure 20: Global Market Value Share (%) and BPS Analysis by Capacity, 2022 to 2032

Figure 21: Global Market Y-o-Y Growth (%) Projections by Capacity, 2022 to 2032

Figure 22: Global Market Value (US$ Million) Analysis by End User, 2017 to 2032

Figure 23: Global Market Volume (Units) Analysis by End User, 2017 to 2032

Figure 24: Global Market Value Share (%) and BPS Analysis by End User, 2022 to 2032

Figure 25: Global Market Y-o-Y Growth (%) Projections by End User, 2022 to 2032

Figure 26: Global Market Attractiveness by Material Type, 2022 to 2032

Figure 27: Global Market Attractiveness by Product Type, 2022 to 2032

Figure 28: Global Market Attractiveness by Capacity, 2022 to 2032

Figure 29: Global Market Attractiveness by End User, 2022 to 2032

Figure 30: Global Market Attractiveness by Region, 2022 to 2032

Figure 31: North America Market Value (US$ Million) by Material Type, 2022 to 2032

Figure 32: North America Market Value (US$ Million) by Product Type, 2022 to 2032

Figure 33: North America Market Value (US$ Million) by Capacity, 2022 to 2032

Figure 34: North America Market Value (US$ Million) by End User, 2022 to 2032

Figure 35: North America Market Value (US$ Million) by Country, 2022 to 2032

Figure 36: North America Market Value (US$ Million) Analysis by Country, 2017 to 2032

Figure 37: North America Market Volume (Units) Analysis by Country, 2017 to 2032

Figure 38: North America Market Value Share (%) and BPS Analysis by Country, 2022 to 2032

Figure 39: North America Market Y-o-Y Growth (%) Projections by Country, 2022 to 2032

Figure 40: North America Market Value (US$ Million) Analysis by Material Type, 2017 to 2032

Figure 41: North America Market Volume (Units) Analysis by Material Type, 2017 to 2032

Figure 42: North America Market Value Share (%) and BPS Analysis by Material Type, 2022 to 2032

Figure 43: North America Market Y-o-Y Growth (%) Projections by Material Type, 2022 to 2032

Figure 44: North America Market Value (US$ Million) Analysis by Product Type, 2017 to 2032

Figure 45: North America Market Volume (Units) Analysis by Product Type, 2017 to 2032

Figure 46: North America Market Value Share (%) and BPS Analysis by Product Type, 2022 to 2032

Figure 47: North America Market Y-o-Y Growth (%) Projections by Product Type, 2022 to 2032

Figure 48: North America Market Value (US$ Million) Analysis by Capacity, 2017 to 2032

Figure 49: North America Market Volume (Units) Analysis by Capacity, 2017 to 2032

Figure 50: North America Market Value Share (%) and BPS Analysis by Capacity, 2022 to 2032

Figure 51: North America Market Y-o-Y Growth (%) Projections by Capacity, 2022 to 2032

Figure 52: North America Market Value (US$ Million) Analysis by End User, 2017 to 2032

Figure 53: North America Market Volume (Units) Analysis by End User, 2017 to 2032

Figure 54: North America Market Value Share (%) and BPS Analysis by End User, 2022 to 2032

Figure 55: North America Market Y-o-Y Growth (%) Projections by End User, 2022 to 2032

Figure 56: North America Market Attractiveness by Material Type, 2022 to 2032

Figure 57: North America Market Attractiveness by Product Type, 2022 to 2032

Figure 58: North America Market Attractiveness by Capacity, 2022 to 2032

Figure 59: North America Market Attractiveness by End User, 2022 to 2032

Figure 60: North America Market Attractiveness by Country, 2022 to 2032

Figure 61: Latin America Market Value (US$ Million) by Material Type, 2022 to 2032

Figure 62: Latin America Market Value (US$ Million) by Product Type, 2022 to 2032

Figure 63: Latin America Market Value (US$ Million) by Capacity, 2022 to 2032

Figure 64: Latin America Market Value (US$ Million) by End User, 2022 to 2032

Figure 65: Latin America Market Value (US$ Million) by Country, 2022 to 2032

Figure 66: Latin America Market Value (US$ Million) Analysis by Country, 2017 to 2032

Figure 67: Latin America Market Volume (Units) Analysis by Country, 2017 to 2032

Figure 68: Latin America Market Value Share (%) and BPS Analysis by Country, 2022 to 2032

Figure 69: Latin America Market Y-o-Y Growth (%) Projections by Country, 2022 to 2032

Figure 70: Latin America Market Value (US$ Million) Analysis by Material Type, 2017 to 2032

Figure 71: Latin America Market Volume (Units) Analysis by Material Type, 2017 to 2032

Figure 72: Latin America Market Value Share (%) and BPS Analysis by Material Type, 2022 to 2032

Figure 73: Latin America Market Y-o-Y Growth (%) Projections by Material Type, 2022 to 2032

Figure 74: Latin America Market Value (US$ Million) Analysis by Product Type, 2017 to 2032

Figure 75: Latin America Market Volume (Units) Analysis by Product Type, 2017 to 2032

Figure 76: Latin America Market Value Share (%) and BPS Analysis by Product Type, 2022 to 2032

Figure 77: Latin America Market Y-o-Y Growth (%) Projections by Product Type, 2022 to 2032

Figure 78: Latin America Market Value (US$ Million) Analysis by Capacity, 2017 to 2032

Figure 79: Latin America Market Volume (Units) Analysis by Capacity, 2017 to 2032

Figure 80: Latin America Market Value Share (%) and BPS Analysis by Capacity, 2022 to 2032

Figure 81: Latin America Market Y-o-Y Growth (%) Projections by Capacity, 2022 to 2032

Figure 82: Latin America Market Value (US$ Million) Analysis by End User, 2017 to 2032

Figure 83: Latin America Market Volume (Units) Analysis by End User, 2017 to 2032

Figure 84: Latin America Market Value Share (%) and BPS Analysis by End User, 2022 to 2032

Figure 85: Latin America Market Y-o-Y Growth (%) Projections by End User, 2022 to 2032

Figure 86: Latin America Market Attractiveness by Material Type, 2022 to 2032

Figure 87: Latin America Market Attractiveness by Product Type, 2022 to 2032

Figure 88: Latin America Market Attractiveness by Capacity, 2022 to 2032

Figure 89: Latin America Market Attractiveness by End User, 2022 to 2032

Figure 90: Latin America Market Attractiveness by Country, 2022 to 2032

Figure 91: Europe Market Value (US$ Million) by Material Type, 2022 to 2032

Figure 92: Europe Market Value (US$ Million) by Product Type, 2022 to 2032

Figure 93: Europe Market Value (US$ Million) by Capacity, 2022 to 2032

Figure 94: Europe Market Value (US$ Million) by End User, 2022 to 2032

Figure 95: Europe Market Value (US$ Million) by Country, 2022 to 2032

Figure 96: Europe Market Value (US$ Million) Analysis by Country, 2017 to 2032

Figure 97: Europe Market Volume (Units) Analysis by Country, 2017 to 2032

Figure 98: Europe Market Value Share (%) and BPS Analysis by Country, 2022 to 2032

Figure 99: Europe Market Y-o-Y Growth (%) Projections by Country, 2022 to 2032

Figure 100: Europe Market Value (US$ Million) Analysis by Material Type, 2017 to 2032

Figure 101: Europe Market Volume (Units) Analysis by Material Type, 2017 to 2032

Figure 102: Europe Market Value Share (%) and BPS Analysis by Material Type, 2022 to 2032

Figure 103: Europe Market Y-o-Y Growth (%) Projections by Material Type, 2022 to 2032

Figure 104: Europe Market Value (US$ Million) Analysis by Product Type, 2017 to 2032

Figure 105: Europe Market Volume (Units) Analysis by Product Type, 2017 to 2032

Figure 106: Europe Market Value Share (%) and BPS Analysis by Product Type, 2022 to 2032

Figure 107: Europe Market Y-o-Y Growth (%) Projections by Product Type, 2022 to 2032

Figure 108: Europe Market Value (US$ Million) Analysis by Capacity, 2017 to 2032

Figure 109: Europe Market Volume (Units) Analysis by Capacity, 2017 to 2032

Figure 110: Europe Market Value Share (%) and BPS Analysis by Capacity, 2022 to 2032

Figure 111: Europe Market Y-o-Y Growth (%) Projections by Capacity, 2022 to 2032

Figure 112: Europe Market Value (US$ Million) Analysis by End User, 2017 to 2032

Figure 113: Europe Market Volume (Units) Analysis by End User, 2017 to 2032

Figure 114: Europe Market Value Share (%) and BPS Analysis by End User, 2022 to 2032

Figure 115: Europe Market Y-o-Y Growth (%) Projections by End User, 2022 to 2032

Figure 116: Europe Market Attractiveness by Material Type, 2022 to 2032

Figure 117: Europe Market Attractiveness by Product Type, 2022 to 2032

Figure 118: Europe Market Attractiveness by Capacity, 2022 to 2032

Figure 119: Europe Market Attractiveness by End User, 2022 to 2032

Figure 120: Europe Market Attractiveness by Country, 2022 to 2032

Figure 121: Asia Pacific Market Value (US$ Million) by Material Type, 2022 to 2032

Figure 122: Asia Pacific Market Value (US$ Million) by Product Type, 2022 to 2032

Figure 123: Asia Pacific Market Value (US$ Million) by Capacity, 2022 to 2032

Figure 124: Asia Pacific Market Value (US$ Million) by End User, 2022 to 2032

Figure 125: Asia Pacific Market Value (US$ Million) by Country, 2022 to 2032

Figure 126: Asia Pacific Market Value (US$ Million) Analysis by Country, 2017 to 2032

Figure 127: Asia Pacific Market Volume (Units) Analysis by Country, 2017 to 2032

Figure 128: Asia Pacific Market Value Share (%) and BPS Analysis by Country, 2022 to 2032

Figure 129: Asia Pacific Market Y-o-Y Growth (%) Projections by Country, 2022 to 2032

Figure 130: Asia Pacific Market Value (US$ Million) Analysis by Material Type, 2017 to 2032

Figure 131: Asia Pacific Market Volume (Units) Analysis by Material Type, 2017 to 2032

Figure 132: Asia Pacific Market Value Share (%) and BPS Analysis by Material Type, 2022 to 2032

Figure 133: Asia Pacific Market Y-o-Y Growth (%) Projections by Material Type, 2022 to 2032

Figure 134: Asia Pacific Market Value (US$ Million) Analysis by Product Type, 2017 to 2032

Figure 135: Asia Pacific Market Volume (Units) Analysis by Product Type, 2017 to 2032

Figure 136: Asia Pacific Market Value Share (%) and BPS Analysis by Product Type, 2022 to 2032

Figure 137: Asia Pacific Market Y-o-Y Growth (%) Projections by Product Type, 2022 to 2032

Figure 138: Asia Pacific Market Value (US$ Million) Analysis by Capacity, 2017 to 2032

Figure 139: Asia Pacific Market Volume (Units) Analysis by Capacity, 2017 to 2032

Figure 140: Asia Pacific Market Value Share (%) and BPS Analysis by Capacity, 2022 to 2032

Figure 141: Asia Pacific Market Y-o-Y Growth (%) Projections by Capacity, 2022 to 2032

Figure 142: Asia Pacific Market Value (US$ Million) Analysis by End User, 2017 to 2032

Figure 143: Asia Pacific Market Volume (Units) Analysis by End User, 2017 to 2032

Figure 144: Asia Pacific Market Value Share (%) and BPS Analysis by End User, 2022 to 2032

Figure 145: Asia Pacific Market Y-o-Y Growth (%) Projections by End User, 2022 to 2032

Figure 146: Asia Pacific Market Attractiveness by Material Type, 2022 to 2032

Figure 147: Asia Pacific Market Attractiveness by Product Type, 2022 to 2032

Figure 148: Asia Pacific Market Attractiveness by Capacity, 2022 to 2032

Figure 149: Asia Pacific Market Attractiveness by End User, 2022 to 2032

Figure 150: Asia Pacific Market Attractiveness by Country, 2022 to 2032

Figure 151: Middle East and Africa Market Value (US$ Million) by Material Type, 2022 to 2032

Figure 152: Middle East and Africa Market Value (US$ Million) by Product Type, 2022 to 2032

Figure 153: Middle East and Africa Market Value (US$ Million) by Capacity, 2022 to 2032

Figure 154: Middle East and Africa Market Value (US$ Million) by End User, 2022 to 2032

Figure 155: Middle East and Africa Market Value (US$ Million) by Country, 2022 to 2032

Figure 156: Middle East and Africa Market Value (US$ Million) Analysis by Country, 2017 to 2032

Figure 157: Middle East and Africa Market Volume (Units) Analysis by Country, 2017 to 2032

Figure 158: Middle East and Africa Market Value Share (%) and BPS Analysis by Country, 2022 to 2032

Figure 159: Middle East and Africa Market Y-o-Y Growth (%) Projections by Country, 2022 to 2032

Figure 160: Middle East and Africa Market Value (US$ Million) Analysis by Material Type, 2017 to 2032

Figure 161: Middle East and Africa Market Volume (Units) Analysis by Material Type, 2017 to 2032

Figure 162: Middle East and Africa Market Value Share (%) and BPS Analysis by Material Type, 2022 to 2032

Figure 163: Middle East and Africa Market Y-o-Y Growth (%) Projections by Material Type, 2022 to 2032

Figure 164: Middle East and Africa Market Value (US$ Million) Analysis by Product Type, 2017 to 2032

Figure 165: Middle East and Africa Market Volume (Units) Analysis by Product Type, 2017 to 2032

Figure 166: Middle East and Africa Market Value Share (%) and BPS Analysis by Product Type, 2022 to 2032

Figure 167: Middle East and Africa Market Y-o-Y Growth (%) Projections by Product Type, 2022 to 2032

Figure 168: Middle East and Africa Market Value (US$ Million) Analysis by Capacity, 2017 to 2032

Figure 169: Middle East and Africa Market Volume (Units) Analysis by Capacity, 2017 to 2032

Figure 170: Middle East and Africa Market Value Share (%) and BPS Analysis by Capacity, 2022 to 2032

Figure 171: Middle East and Africa Market Y-o-Y Growth (%) Projections by Capacity, 2022 to 2032

Figure 172: Middle East and Africa Market Value (US$ Million) Analysis by End User, 2017 to 2032

Figure 173: Middle East and Africa Market Volume (Units) Analysis by End User, 2017 to 2032

Figure 174: Middle East and Africa Market Value Share (%) and BPS Analysis by End User, 2022 to 2032

Figure 175: Middle East and Africa Market Y-o-Y Growth (%) Projections by End User, 2022 to 2032

Figure 176: Middle East and Africa Market Attractiveness by Material Type, 2022 to 2032

Figure 177: Middle East and Africa Market Attractiveness by Product Type, 2022 to 2032

Figure 178: Middle East and Africa Market Attractiveness by Capacity, 2022 to 2032

Figure 179: Middle East and Africa Market Attractiveness by End User, 2022 to 2032

Figure 180: Middle East and Africa Market Attractiveness by Country, 2022 to 2032

Recommendations

Packaging

Flexible Packaging Paper Market

Published : March 2024

Packaging

Beverage Packaging Market

Published : October 2023

Packaging

FMCG Packaging Market

Published : May 2023

Explore Packaging Insights

View Reports