The precision gearbox machinery market exhibits stable growth projections from 2025 through 2035 owing to mounting requirements for precise motion control systems in automation systems robotics packaging and aerospace applications. Applications that need precise torque control together with minimal backlash and high positional accuracy require precision gearboxes.
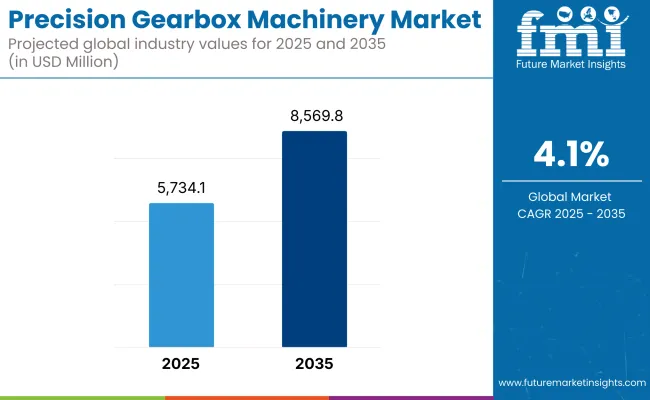
Precision gearboxes improve system performance by integrating into automated systems together with CNC machines and robotic arms under conditions of varying loads. Market analysts predict that precision gearbox sales will rise to USD 8,569.8 million by 2035 from their initial value of USD 5,734.1 million in 2025 at a projected compound annual growth rate (CAGR) of 4.1%.

| Metric | Value |
|---|---|
| Industry Size (2025E) | USD 5,734.1 million |
| Industry Value (2035F) | USD 8,569.8 million |
| CAGR (2025 to 2035) | 4.1% |
The market expands due to increasing smart factory installations while manufacturers seek compact gears for their operations and precision engineering requirements in high-value industries. Manufacturing industries continue facing cost and maintenance challenges but inventors pursue solutions using lightweight alloys together with hybrid gear materials and lubrication-free design approaches.
Modern harmonic and planetary and strain wave gear technology developments enhance both operational efficiency and product lifespan. The migration of industries toward digital production systems makes precision gearboxes essential components which enable stable operations and shortened downtime together with intelligent motion control in industrial production lines.
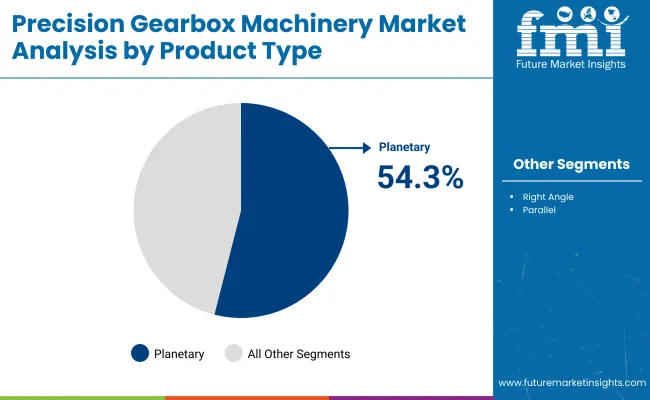
Precision gearbox machinery exists within two types of segments which determine how the system works in automation settings and provides torque power and operational flexibility. Planetary gearboxes lead the market because their small design and high torque capability and equal weight distribution suits them to operate in intensive precision applications.
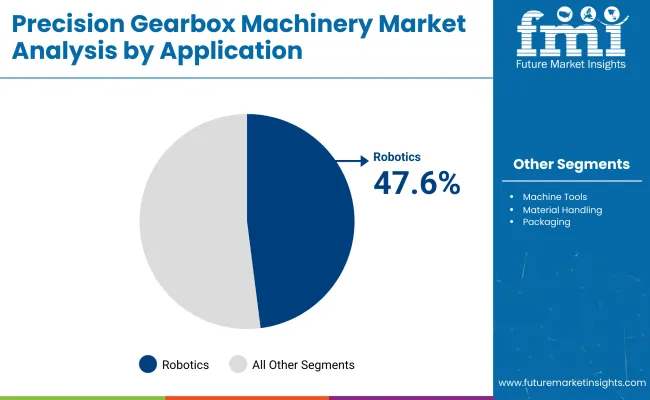
This gear system variety enables broad torque-speed capacity in complex motion control applications. Robotics applications at present represent the main driver of gearboxes because these devices let engineers create robotic systems that can position accurately and reduce mechanical backlash while delivering effective transmissions in autonomous industrial equipment and articulated robot systems. This market segment demonstrates the rising significance of precision mechanics for future industrial automation and smart robotics as well as flexible production setups.
North America accounts for high deployment of precision gearboxes in aerospace, medical robotics, and industrial automation. The USA and Canada are also focused on high-torque, low-backlash gearboxes for use in defense applications, satellite positioning, and factory robotics.
The need for operational efficiencies is driving innovation in gear design and integration with IoT-enabled equipment. They are developing local production setup and utilizing automation-oriented policies to cater to increased demand by high-end manufacturing plants and OEMs emphasizing on precision motion.
Strong adoption of automotive testing systems, packaging machinery, and renewable energy platforms can be seen in Europe. Germany, Italy, and Switzerland are investing in ultra-high-efficiency gearboxes for e-mobility factories, food processing factories and for wind turbine actuation.
Mechanical innovation is ingrained in such machinery, and since mechanical know-how is often the backbone of a clean-tech machine, EU funded, small-mechanical projects are also driving the pumping of gear systems into these machineries. European manufacturers are moving forward with 3D-printed gear components that are stronger and lighter, with fewer components than traditionally manufactured gear, and less detrimental production processes through the optimization of the design.
The demand is primarily driven by large-scale industrialization, implementation of robotics and practice of export-oriented manufacturing contributing to high demand in the Asia-Pacific region. Precision gearboxes are used in electronics assembly, automation systems and machine tools in China, Japan, South Korea and India.
Regional growth is surging thanks to investments in smart city projects, EV assembly lines, and high-speed rail systems. In the Asia-Pacific region, OEMs partner with specialized gear technology companies in developing tailored, high-precision compact gear solutions to meet evolving demands in end-use industries such as energy, packaging, industrial machine tools, and others.
High Manufacturing Complexity and Cost Sensitivity
The complexity of design and tight tolerances required for high-performance applications creates numerous hurdles for the precision gearbox machinery market. High-precision machining and material choices needed for manufacturing low-backlash, high-load capacity, and low-noise gearboxes make production costly. Moreover, high-tapeout, application-specific demand in fields such as robotics and aerospace limits economies of scale.
About half of smaller manufacturers lack access to high-precision tools, skilled labour and quality-control systems. As with all competitive industries such as packaging and material handling, price sensitivity limits adoption of premium gearboxes, creating tension between performance requirements and budgetary constraints.
Growth in Robotics, Automation, and High-Torque Applications
Soaring demand for precision gearboxes, particularly in robotics, CNC machinery, and automated production lines, despite costliness and complexity to manufacture. They are used when torque is being transmitted, when driving the movement of an object, or when precise positioning needs to be maintained for repeated movement, especially at high speeds.
In this regime, especially harmonic, planetary, and strain wave gears are becoming popular because they are small, low in energy needs, and do not necessitate a lot of maintenance. The rise of production in electric vehicles, smart manufacturing, and semiconductor fabrication are also creating new high-growth niches.
The precision gearbox market witnessed steady growth from 2020 to 2024 primarily due to shifting focus towards factory automation along with growing investments in robotics and intelligent assembly lines. Planetary and servo gearboxes were favored by industries for their balance of precision and durability. Innovation on backlash reduction and thermal resistance benefited from demand in sectors such as electronics, aerospace and machine tooling.
The second phase dominant from 2025 to 2035 will be the increasing convergence of smart gearboxes with embedded sensors capable of predictive maintenance and condition monitoring. Lightweight alloys, 3D-printed elements, and low-noise gear geometries that enable next-gen requirements in medical devices, satellite systems, and collaborative robots (cobots) is a key to ushering in a new era of precision motion systems.
Market Shifts: Comparative Analysis (2020 to 2024 vs. 2025 to 2035)
| Market Factor | 2020 to 2024 |
|---|---|
| Regulatory Landscape | Focus on mechanical safety, efficiency, and durability compliance. |
| Technological Advancements | Use of planetary and harmonic gear systems with moderate automation. |
| Sustainability Trends | Moderate attention to material efficiency and energy use. |
| Market Competition | Led by industrial automation giants and machine tool OEMs. |
| Industry Adoption | Common in automation lines, robotics, and CNC equipment. |
| Consumer Preferences | Focused on performance consistency, torque precision, and reliability. |
| Market Growth Drivers | Driven by manufacturing automation and robotics integration. |
| Market Factor | 2025 to 2035 |
|---|---|
| Regulatory Landscape | Expansion into ISO-certified smart diagnostics and carbon efficiency standards. |
| Technological Advancements | Integration of AI-based sensors, additive manufacturing, and ultra-low-backlash designs. |
| Sustainability Trends | Push for recyclable materials, low-friction designs, and lubrication-free gearboxes. |
| Market Competition | Entry of cobots innovators, micro-gearbox developers, and lightweight motion system providers. |
| Industry Adoption | Expands to medical robotics, EV assembly, aerospace drones, and micro-manufacturing. |
| Consumer Preferences | Shift toward integrated sensors, compact design, and predictive maintenance features. |
| Market Growth Drivers | Accelerated by smart factory adoption, precision healthcare, and low-noise mechatronics. |

In the United States, the precision gearbox machinery market is gaining traction due to rising adoption among robotics systems, defense systems, and automated material handling systems. Precision gearboxes are a critical component in servo systems, robotic arms, and aerospace assemblies that utilize low backlash and high torque set point control.
Producers in the USA are therefore concentrating on better performance gearboxes - high-efficiency planetary and harmonic gearboxes that have better position accuracy. Industrial retrofitting and investments in smart factories continue to bolster the domestic demand for compact, high-torque gear transmission systems.
| Country | CAGR (2025 to 2035) |
|---|---|
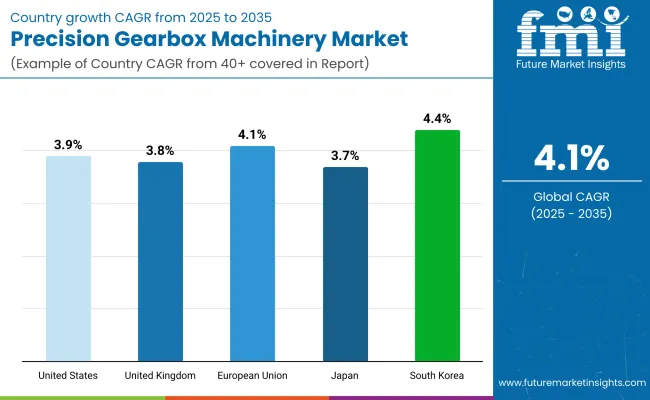
| USA | 3.9% |
The United Kingdom precision gearbox machinery market is projected to grow moderately, backed by total manufacturing automation in packaging, electric vehicles and motion control process in manufacture. Precision gearboxes are being integrated into pick-and-place units and CNC systems to increase speed and repeatability in UK industries.
Based on an increasing interest in renewable energy and robotics R&D, new opportunities for small-form-factor, high-load gearboxes are arising. Local suppliers are also answering the call for quiet, lightweight transmission solutions for high-performance automation.
| Country | CAGR (2025 to 2035) |
|---|---|
| UK | 3.8% |
Some of the largest markets for precision gearbox machinery are currently in the European Union with Germany, Italy, and France at the forefront of the advanced robotics and high-end machinery manufacturing industry. These gearboxes are essential to all accuracy-sensitive applications, including machine tools, medical devices, and smart logistics systems.
European manufacturers focus on modular design, thermal stability and high load capacity. Meanwhile, growing integration of collaborative robots (cobots) and servo motors in industrial automation is also driving innovation in gearboxes across the region.
| Region | CAGR (2025 to 2035) |
|---|---|
| European Union | 4.1% |
Steered by a robust standing in the electronics, automotive and factory automation sectors, Japan precision gearbox machinery market is evolving unfalteringly. Precision gearboxes are a critical component in robotic assembly systems, surgical robots and micro-positioning equipment used in semiconductor manufacturing.
Japanese companies favour small, high-rigidity gearboxes which can operate at high speeds with low transmission error. There is also growing interest in zero-backlash and strain wave gear systems aimed for use in tight space, high-precision applications.
| Country | CAGR (2025 to 2035) |
|---|---|
| Japan | 3.7% |
The precision gearbox machinery market in South Korea is growing healthy due to country strong robotics industry, smart factory pipeline and export ATM machinery. The market is gearing up with rising demand for precision gearboxes in AGVs, inspection robots, and servo-based production lines.
Domestic manufacturers are concentrating on the lightweight, high corrosion-resistant gearboxes with high torque density. It’s also driving growth over high-tech sectors as motion control integrates with IoT platforms and predictive maintenance systems.
| Country | CAGR (2025 to 2035) |
|---|---|
| South Korea | 4.4% |
Precision gearbox machinery is growing robustly, as automation, motion control and compact mechanical efficiency become mandatory across high-tech manufacturing and advanced machinery sectors. Precision gearboxes facilitate effective speed reduction and torque transfer, being essential in fields that depend on sophisticated mechanical operation.
Based on product types, the planetary gearbox dominates the market due to its high torque density, compactness, and good load distribution. Application-wise, robotics leads the share of demand; automated systems increasingly rely on accurately sized, compact and efficient gear mechanism to enable repeatability and stability. The two segments combined show a market now led by miniaturization, intelligent design, and an increased demand for high-performance automation.
With the push to produce energy-efficient nanotechnology, to have real-time responsiveness, and integrating sensors and with smart controllers, planetary gearboxes and robotics applications are crucial to enabling motion control in high levels in electronics, automotive and medical manufacturing

| Product Type | Market Share (2025) |
|---|---|
| Planetary Gearbox | 54.3% |
Planetary gearboxes dominate the product segment as they can achieve high levels of torque in compact design. These gearboxes consist of a center sun gear circumscribed by several planet gears that turn inside a ring gear, they distribute loads evenly, allowing for smooth motion with minimal backlash.
Because they are so powerful relative to their size they are perfect for applications that require precision where both power density and compactness are crucial. Industries often use planetary gearboxes in devices that need tight control, such as pick-and-place machines, 3D printers, and CNC routers.
Planetary gearboxes are popular amongst design engineers for their versatility and adaptability in low-speed as well as high-speed operations. This uniform torque transmission coupled with low gear wear leads to high efficiency and longer life of the gearbox.
Throughout advances in materials and lubrication technology, both support their thermal tolerance and reliability across a range of operational loads. Planetary gearboxes are likely to continue to be the most popular gearbox design in the precision machinery market as demand for miniaturization as well as powerful mechanical solutions grows.

| Application | Market Share (2025) |
|---|---|
| Robotics | 47.6% |
Driven by the demand for responsive, accurate, and lightweight mechanical systems robotics lead the application segment generating significant demand for precision gearbox machinery in the market. For smooth and controlled movements under varying loads, precision gearboxes are heavily relied upon for robotic arms, mobile robots and collaborative robots (cobots).
Planetary gearboxes, in particular, represent the foundation of robotic joints, actuators, and rotary tables in which torque precision and position repeatability are cuts in stone. So, these gearboxes enable robots to maintain its balance, agility and coordinated motion while achieving both speed and precision in the environment.
Industrial robot manufacturers scale down the servo motor and gear in to boost output torque. This allows for compact robotic designs that are a good fit for assembly lines, material handling, packaging, and surgical robotics. When such factories are being built or automated within small and medium enterprises, compact and power dense gearboxes are in demand worldwide.
Robotics based applications not just needs gearboxes to take care of high-speed operations but also needs silent operation and less backlash for repeatable accuracy. This continuous need makes robotics the largest and fastest-growing precision gearbox machinery application globally.
Precision gearbox machinery is vital to the advanced motion control of devices used across robotics, CNC machinery, packaging, aerospace, medical equipment, and semiconductor manufacturing. High precision gear reducer such as planetary, harmonic and cycloidal types provide exceptional torque density, positional accuracy and backlash minimization used for high-speed and high-load applications. Need for small, lightweight and high-efficiency gearboxes with accurate speed and torque control is in demand with the expansion of automation in diverse industries.
Manufacturers are competing on transmission smoothness, thermal efficiency, mechanical lifetime and integration with servomotors. We have global innovators in mechanical systems and suppliers of precision components that specialize in custom gear ratios, low-noise designs, and plug-and-play setups.
Market Share Analysis by Company
| Company Name | Estimated Market Share (%) |
|---|---|
| SEW-EURODRIVE GmbH & Co KG | 20-24% |
| Harmonic Drive Systems Inc. | 15-19% |
| Nabtesco Corporation | 12-16% |
| Neugart GmbH | 9-13% |
| Bonfiglioli Riduttori S.p.A. | 7-11% |
| Apex Dynamics, Inc. | 6-10% |
| Other Companies (combined) | 18-26% |
| Company Name | Key Offerings/Activities |
|---|---|
| SEW-EURODRIVE GmbH | Released modular planetary precision gear units for smart conveyor and robotics systems in 2025. |
| Harmonic Drive Systems | Introduced new compact harmonic gearboxes with zero backlash for space-constrained robotic joints in 2024. |
| Nabtesco Corporation | Launched high-torque, cycloidal precision reducers for AGVs and semiconductor positioning stages in 2025. |
| Neugart GmbH | Rolled out P-series planetary gearboxes with low-noise gearing and ISO-certified backlash ranges in 2024. |
| Bonfiglioli Riduttori | Expanded servo gearmotors for packaging and printing machinery with integrated sensors in 2025. |
| Apex Dynamics, Inc. | Debuted high-precision right-angle gearboxes with reinforced bearings for CNC and laser cutting in 2024. |
Key Company Insights
SEW-EURODRIVE GmbH & Co KG
SEW-EURODRIVE leads the global market with customizable planetary gearbox systems for high-precision automation. Its modular approach and integration with smart factory systems make it a top choice for OEMs in logistics and manufacturing.
Harmonic Drive Systems Inc.
Harmonic Drive is known for ultra-compact, zero-backlash gearboxes, ideal for robotics, aerospace, and surgical systems. Its strain-wave gearing technology provides superior repeatability and smooth motion at minimal footprint.
Nabtesco Corporation
Nabtesco specializes in high-rigidity cycloidal reducers with shock load resistance and minimal lost motion. Its gearboxes are widely used in collaborative robots, machine tools, and semiconductor handling.
Neugart GmbH
Neugart delivers precision planetary gearboxes with optimized efficiency, quiet operation, and tight backlash tolerances. Its plug-and-play configurations support a wide range of servo applications in industrial and medical automation.
Bonfiglioli Riduttori S.p.A.
Bonfiglioli offers versatile gearbox solutions tailored for dynamic applications like textile machinery, automated packaging, and food processing lines. Its servo-integrated systems emphasize energy efficiency and compact design.
Apex Dynamics, Inc.
Apex Dynamics produces high-performance gearboxes with reinforced mechanical structures and thermal stability. Its gear units are favored in CNC machining and laser-based manufacturing where precision and repeatability are critical.
Other Key Players (18-26% Combined)
Numerous regional and application-focused manufacturers contribute to the precision gearbox machinery market by offering custom-built gear solutions, niche motion control integration, and competitive cost-performance ratios:
The overall market size for the precision gearbox machinery market was USD 5,734.1 million in 2025.
The precision gearbox machinery market is expected to reach USD 8,569.8 million in 2035.
The increasing automation in industrial sectors, rising deployment of precision gear systems in robotics, and growing demand for high-efficiency planetary gearboxes fuel.
The top 5 countries driving the development of the precision gearbox machinery market are the USA, UK, European Union, Japan, and South Korea.
Planetary gearboxes and robotics applications lead market growth to command a significant share over the assessment period.


Our Research Products

The "Full Research Suite" delivers actionable market intel, deep dives on markets or technologies, so clients act faster, cut risk, and unlock growth.

The Leaderboard benchmarks and ranks top vendors, classifying them as Established Leaders, Leading Challengers, or Disruptors & Challengers.

Locates where complements amplify value and substitutes erode it, forecasting net impact by horizon

We deliver granular, decision-grade intel: market sizing, 5-year forecasts, pricing, adoption, usage, revenue, and operational KPIs—plus competitor tracking, regulation, and value chains—across 60 countries broadly.

Spot the shifts before they hit your P&L. We track inflection points, adoption curves, pricing moves, and ecosystem plays to show where demand is heading, why it is changing, and what to do next across high-growth markets and disruptive tech

Real-time reads of user behavior. We track shifting priorities, perceptions of today’s and next-gen services, and provider experience, then pace how fast tech moves from trial to adoption, blending buyer, consumer, and channel inputs with social signals (#WhySwitch, #UX).

Partner with our analyst team to build a custom report designed around your business priorities. From analysing market trends to assessing competitors or crafting bespoke datasets, we tailor insights to your needs.
Supplier Intelligence
Discovery & Profiling
Capacity & Footprint
Performance & Risk
Compliance & Governance
Commercial Readiness
Who Supplies Whom
Scorecards & Shortlists
Playbooks & Docs
Category Intelligence
Definition & Scope
Demand & Use Cases
Cost Drivers
Market Structure
Supply Chain Map
Trade & Policy
Operating Norms
Deliverables
Buyer Intelligence
Account Basics
Spend & Scope
Procurement Model
Vendor Requirements
Terms & Policies
Entry Strategy
Pain Points & Triggers
Outputs
Pricing Analysis
Benchmarks
Trends
Should-Cost
Indexation
Landed Cost
Commercial Terms
Deliverables
Brand Analysis
Positioning & Value Prop
Share & Presence
Customer Evidence
Go-to-Market
Digital & Reputation
Compliance & Trust
KPIs & Gaps
Outputs
Full Research Suite comprises of:
Market outlook & trends analysis
Interviews & case studies
Strategic recommendations
Vendor profiles & capabilities analysis
5-year forecasts
8 regions and 60+ country-level data splits
Market segment data splits
12 months of continuous data updates
DELIVERED AS:
PDF EXCEL ONLINE
Precision Livestock Farming Market Size and Share Forecast Outlook 2025 to 2035
Precision Wire Drawing Service Market Size and Share Forecast Outlook 2025 to 2035
Precision Planting Market Size and Share Forecast Outlook 2025 to 2035
Precision Bearing Market Size and Share Forecast Outlook 2025 to 2035
Precision Laser Engraving Machines Market Size and Share Forecast Outlook 2025 to 2035
Precision Analog Potentiometer Market Size and Share Forecast Outlook 2025 to 2035
Precision Blanking Dies Market Size and Share Forecast Outlook 2025 to 2035
Precision Components And Tooling Systems Market Size and Share Forecast Outlook 2025 to 2035
Precision Chemicals Market Size and Share Forecast Outlook 2025 to 2035
Precision Fermentation Ingredients Market Size and Share Forecast Outlook 2025 to 2035
Gearbox and Gear Motors Market Size and Share Forecast Outlook 2025 to 2035
Precision-Fermented Casein for QSR Pizza Cheese Market Analysis - Size, Share, and Forecast Outlook 2025 to 2035
Precision Ruminant Minerals Market Analysis - Size and Share Forecast Outlook 2025 to 2035
Precision Forestry Market Size and Share Forecast Outlook 2025 to 2035
Precision Stainless Steel Market Size and Share Forecast Outlook 2025 to 2035
Precision Machine For Polymers Market Size and Share Forecast Outlook 2025 to 2035
Precision Aquaculture Market Size and Share Forecast Outlook 2025 to 2035
Precision Fermented Functional Lipids Market Analysis Size and Share Forecast Outlook 2025 to 2035
Precision Cancer Imaging Market Growth - Industry Trends & Forecast 2025 to 2035
Precision Poultry Nutrition Market – Growth, Demand & Livestock Trends

Thank you!
You will receive an email from our Business Development Manager. Please be sure to check your SPAM/JUNK folder too.
Chat With
MaRIA