Precision Stainless Steel Market
Precision Stainless Steel Market by Material Type, End User & Region | Forecast 2023 to 2033
Sustainability Takes Center Stage in the Precision Stainless Steel Market
Precision Stainless Steel Market Outlook
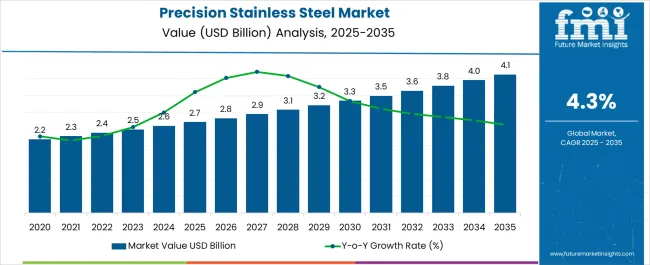
The global precision stainless steel market is expected to be valued at US$ 2,488 million in 2023 and reach a valuation of US$ 3,754.29 million by 2033. The demand for precision stainless steel is estimated to grow at a steady 4.2% CAGR.
Precision stainless steel is a highly durable and corrosion-resistant metal used in various automotive, aerospace, medical, and oil & gas industries. The demand for precision stainless steel is experiencing steady growth, owing to the increasing demand for high-quality metals with exceptional properties that can be tailored to specific applications.
One of the key trends in the precision stainless steel market is the development of new alloys. Manufacturers are investing heavily in research and development activities to create new grades of precision metal with improved properties such as higher strength, better formability, and increased corrosion resistance. The development of new alloys is driven by the growing demand for precision stainless steel in various applications and the need to cater to the specific requirements of different end-use industries.
Another trend in the precision stainless steel market is the increasing adoption of automation and robotics in manufacturing processes. Automation and robotics enhance productivity, reduce human errors, and ensure consistent quality in producing stainless steel components. This trend is driven by the need to improve manufacturing efficiency and reduce costs.
Sustainable manufacturing practices are also becoming an important trend in the precision stainless steel market. With growing environmental concerns, manufacturers are focusing on sustainable manufacturing practices such as using renewable energy sources, recycling waste materials, and reducing carbon emissions. Sustainable manufacturing practices not only help to reduce the environmental footprint of manufacturing operations but also help to create a positive brand image and meet the growing demand for sustainable products.
Asia Pacific is emerging as a key growth market for the precision stainless steel industry. The region is experiencing rapid industrialization, urbanization, and infrastructure development, driving the demand for precision stainless steel components. The growth of the precision stainless steel market in Asia Pacific is expected to continue in the coming years, driven by the increasing demand for high-quality metals in various end-use industries.
Attributes |
Details |
Precision Stainless Steel Market CAGR (2023 to 2033) |
4.2% |
Precision Stainless Steel Market Size (2023) |
US$ 2,488 million |
Precision Stainless Steel Market Size (2033) |
US$ 3,754.29 million |
Don't pay for what you don't need
Customize your report by selecting specific countries or regions and save 30%!
Precision Stainless Steel Demand Analysis (2018 to 2022) Vs Market Outlook (2023 to 2033)
The precision stainless steel market is expected to expand at a high rate of 4.2% as compared to the historical growth rate of 1.7%.
Short term (2023 to 2025): Manufacturers are increasingly offering customized solutions to their customers, based on their specific requirements. This trend is driven by the need to provide customers with products that meet their specific needs and help them achieve a competitive edge in the market.
Medium term (2025 to 2028): The precision stainless steel market is also witnessing the adoption of advanced technologies such as additive manufacturing (3D printing), which has the potential to revolutionize the manufacturing process. Additive manufacturing is being used to produce complex and intricate precision metal components with high precision and accuracy, which would be difficult to achieve through conventional manufacturing processes.
Long term (2028 to 2033): The precision stainless steel market is expected to see the adoption of Industry 4.0 technologies such as the Internet of Things (IoT), Artificial Intelligence (AI), and Big Data Analytics, which are being used to optimize manufacturing processes and improve product quality. These technologies are also being used to monitor the production process in real-time and make necessary adjustments to ensure consistent product quality.
Comparative View of Precision Stainless Steel Market
Precision Stainless Steel Market:
Attributes |
Precision Stainless Steel Market |
CAGR (2023 to 2033) |
4.2% |
Market Value (2033) |
US$ 3,754.29 million |
Growth Factor |
Growing demand from end-use industries such as automotive, aerospace, medical, and oil & gas |
Opportunity |
Increasing demand for sustainable and environmentally friendly products. |
Restraint |
High cost of production |
Aluminum Foil Containers Market:
Attributes |
Aluminum Foil Containers Market |
CAGR (2023 to 2033) |
5.5% |
Market Value (2033) |
US$ 6.5 billion |
Growth Factor |
Increasing demand from the food and beverage industry. |
Opportunity |
Growing trend towards convenience food products |
Restraint |
Growing concern over the environmental impact of disposable packaging products |
Aluminum Aerosol Cans Market:
Attributes |
Aluminum Aerosol Cans Market |
CAGR (2023 to 2033) |
4.8% |
Market Value (2033) |
US$ 7.1 billion |
Growth Factor |
The increasing consumption of aluminum aerosol cans in the food industry for storing cream toppings is flourishing the market expansion. |
Opportunity |
The end-user industries are increasingly adopting aluminum aerosol cans due to their high quality and is 100% recyclable. |
Restraint |
Rising competition from alternative packaging materials such as plastic and glass. |
Growing Demand for Stainless Steel in Automotive Industry to Trigger Growth
The global precision stainless steel industry can achieve substantial benefits from automotive manufacturing industry. Increasing demand for advanced high-strength steel (AHSS) in automotive industry owing to its high formability and strain rates is likely to fuel the precision stainless steel market revenues significantly.
Prominent steel producers across the globe have an opportunity to invest in the development of advanced materials and manufacturing technologies to introduce a wide variety of new automotive steels. Leading automotive manufacturers are constantly putting efforts to utilize advanced high-strength steel (AHSS) including stainless steel foils for manufacturing highly safe, lightweight, and economic auto parts.
In terms of value addition, the global automotive industry is expected to reach a value of US$1,343 billion by 2022. Rising demand for precision stainless steel in the automotive industry for auto parts manufacturing owing to its unique metallurgical properties is expected to escalate growth of the global precision stainless steel market during the forecast period.
What are the restraints to Precision Stainless Steel Market?
Cost of Raw Material and Energy and Overcapacity to hinder the Market Growth
The precision stainless steel industry is facing a significant challenge as the prices of raw materials such as coking coal and coke continue to rise due to their scarcity. This has created pricing challenges for manufacturers, particularly small-scale and local manufacturers, who are finding it difficult to compete in the market.
The high cost of raw materials such as iron ore and power has further exacerbated the pricing challenges, creating obstacles for precision stainless steel manufacturers. This, in turn, is restricting the market growth to a certain extent.
Moreover, the overcapacity in the industrial sector, particularly in China, is threatening the profitability levels of steel and steel products, including precision stainless steel. The influx of cheap steel in the global market is adversely affecting companies, workers, and the global trading regime, resulting in unfeasible profit levels for the global steel sector.
As China continues to expand its steel production beyond the required global demand, the overcapacity and production of steel and steel products are affecting the financial profitability of manufacturers. This, in turn, poses a threat to the growth of the precision stainless steel market. The industry must address these challenges to maintain sustainable growth and profitability.
Region-wise Insights
China and India are anticipated to offer Substantial Growth Avenues
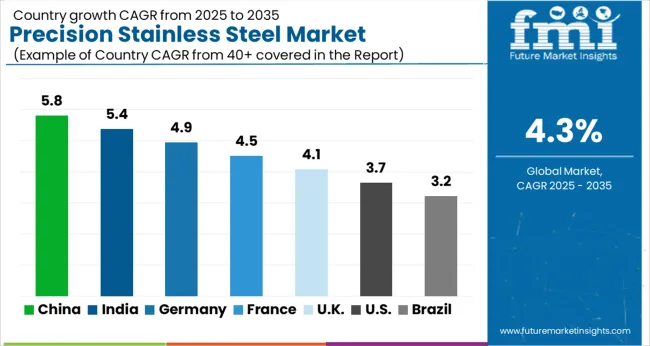
Industrial manufacturing and service sector is rapidly growing in prominent economies to fulfill the domestic demand. Leading economies such as China, India, Brazil, and others are projected to drive the demand for precision stainless steel in terms of production and consumption.
The Indian market is expected to be valued at US$ 65,247 million by the end of 2023. It is also expected to grow at rate of 4.1% throughout the forecast period.
Leading precision metal manufacturers operating in India are highly focusing on precision steel production to fulfil end-use industry requirements. Furthermore, installation of new manufacturing plants is industrial sectors is one of the vital factors triggering the demand for precision stainless steel in the region.
There are several prominent players in the precision stainless steel market in India.
- Jindal Stainless: Jindal Stainless is a leading manufacturer of stainless steel in India. They produce high-quality stainless steel products such as coils, sheets, and precision strips.
- Viraj Profiles: Viraj Profiles is one of the largest manufacturers and exporters of stainless steel long products in India. They produce a wide range of stainless steel products such as bars, wires, and fasteners.
- Salem Stainless Steel Suppliers: Salem Stainless Steel Suppliers is a renowned supplier of stainless steel products in India. They offer a wide range of stainless steel products such as sheets, coils, plates, pipes, and fittings.
- Mukund Steel: Mukund Steel is a leading manufacturer of stainless steel products in India. They specialize in producing precision stainless steel strips, coils, and sheets.
- SAIL: Steel Authority of India Limited (SAIL) is a leading public sector steel company in India. They produce a wide range of steel products including stainless steel, which is used in various applications such as construction, engineering, and manufacturing.
North American Market’s Slow Growth
The demand for precision stainless steel in the United States is expected to rise at rate of 1.6%, slowing down the growth from a historical rate of 2.3%. Canada’s market is experiencing a similar situation, with the forecasted growth rate at 2.3% from a high historical rate of 3.1%.
The economic downturn caused by the COVID-19 pandemic has had a significant impact on the precision stainless steel market in the USA and Canada. The pandemic has resulted in reduced demand for stainless steel products, particularly in the construction and automotive industries, which are major consumers of precision stainless steel products.
The growing popularity of alternative materials such as aluminum and plastic has created intense competition for the precision stainless steel industry in the USA and Canada. This has led to a decline in demand for precision stainless steel products, as more and more companies are switching to alternative materials that are more cost-effective and offer better performance in certain applications.
Lastly, the aging infrastructure in the USA and Canada has resulted in reduced demand for stainless steel products in the construction and engineering industries. The lack of investment in infrastructure projects has limited the demand for precision stainless steel products, which are widely used in these industries.
Get the data you need at a Fraction of the cost
Personalize your report by choosing insights you need
and save 40%!
Category-wise Insights
The precision stainless steel market in the 0.1 mm to 0.4 mm thickness segment is poised for impressive growth in the coming years. The 0.1 mm segment is on its way to capture an expected 80.7% market share by 2029. This is fueled by an upsurge in demand for superior quality stainless steel products across multiple industries, including automotive, aerospace, electronics, and medical devices. The surge in demand is driven by the need for lightweight and durable components in the automotive and aerospace sectors, a growing demand for electronic devices, and the need for top-notch medical devices such as surgical instruments, implants, and diagnostic tools. As a result, the market is set to experience a steady and robust growth trajectory, presenting a promising opportunity for players in the precision stainless steel market.
Competitive Landscape
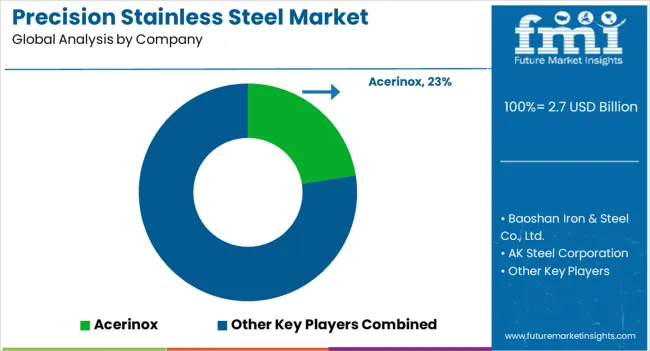
The global precision stainless steel industry is characterized by fragmentation, with the top players accounting for only 40-45% of the total production. To stay ahead in this competitive landscape, key players are adopting various strategies to expand their reach globally, diversify their product portfolio, and upgrade their supplier and distributor networks.
One of the primary strategies employed by leading players is rapid product development to gain a competitive edge in the market. With a focus on innovation, companies are leveraging advanced technologies to create new and improved products that meet the evolving demands of customers across various industries.
Top players are also investing heavily in research and development to enhance the quality of their products, improve production efficiency, and reduce costs. This approach helps companies to meet the stringent quality requirements of customers and maintain a competitive edge in the market.
Companies are exploring new market opportunities and expanding their presence in emerging markets to tap into the growing demand for precision stainless steel products. They are also diversifying their product portfolio to cater to the diverse needs of customers across various industries.
- Hitachi Metals, in July 2019, confirmed about increasing their manufacturing capacity in Thailand and Vietnam alongside Furukawa Electric.
Key Segments
Material Type:
- Below 0.1 mm
- 0.1 mm to 0.4 mm
End User:
- Food Industry
- Automotive
- Pharmacy
- Construction
- Industrial
- Aerospace
Region:
- North America
- Latin America
- Europe
- East Asia Cell
- South Asia & Pacific
- Middle East & Africa (MEA)
Frequently Asked Questions
What is the Worth of the Precision Stainless Steel Market?
The precision stainless steel market is worth US$ 2,488 million in 2023.
How Big Will be the Precision Stainless Steel Market by 2033?
The precision stainless steel market size is set to reach US$ 3,754.29 million by 2033.
At What Rate is the Precision Stainless Steel Market Expanding?
The precision stainless steel market is rising at a 4.2% CAGR through 2033.
What is India’s Projected CAGR in the Precision Stainless Steel Market?
India’s precision stainless steel market is projected to rise at a 4.1% CAGR through 2033.
What is the Outlook for North America in the Precision Stainless Steel Market?
North America is anticipated to gain slow growth in the precision stainless steel market.
Table of Content
1. Executive Summary | Precision Stainless Steel Market 1.1. Global Market Outlook 1.2. Demand-side Trends 1.3. Supply-side Trends 1.4. Technology Roadmap Analysis 1.5. Analysis and Recommendations 2. Market Overview 2.1. Market Coverage / Taxonomy 2.2. Market Definition / Scope / Limitations 3. Market Background 3.1. Market Dynamics 3.1.1. Drivers 3.1.2. Restraints 3.1.3. Opportunity 3.1.4. Trends 3.2. Scenario Forecast 3.2.1. Demand in Optimistic Scenario 3.2.2. Demand in Likely Scenario 3.2.3. Demand in Conservative Scenario 3.3. Opportunity Map Analysis 3.4. Product Life Cycle Analysis 3.5. Supply Chain Analysis 3.5.1. Supply Side Participants and their Roles 3.5.1.1. Producers 3.5.1.2. Mid-Level Participants (Traders/ Agents/ Brokers) 3.5.1.3. Wholesalers and Distributors 3.5.2. Value Added and Value Created at Node in the Supply Chain 3.5.3. List of Raw Material Suppliers 3.5.4. List of Existing and Potential Buyer’s 3.6. Investment Feasibility Matrix 3.7. Value Chain Analysis 3.7.1. Profit Margin Analysis 3.7.2. Wholesalers and Distributors 3.7.3. Retailers 3.8. PESTLE and Porter’s Analysis 3.9. Regulatory Landscape 3.9.1. By Key Regions 3.9.2. By Key Countries 3.10. Regional Parent Market Outlook 3.11. Production and Consumption Statistics 3.12. Import and Export Statistics 4. Global Market Analysis 2018 to 2022 and Forecast, 2023 to 2033 4.1. Historical Market Size Value (US$ Million) & Volume (Tonnes) Analysis, 2018 to 2022 4.2. Current and Future Market Size Value (US$ Million) & Volume (Tonnes) Projections, 2023 to 2033 4.2.1. Y-o-Y Growth Trend Analysis 4.2.2. Absolute $ Opportunity Analysis 5. Global Market Analysis 2018 to 2022 and Forecast 2023 to 2033, By Thickness 5.1. Introduction / Key Findings 5.2. Historical Market Size Value (US$ Million) & Volume (Tonnes) Analysis By Thickness, 2018 to 2022 5.3. Current and Future Market Size Value (US$ Million) & Volume (Tonnes) Analysis and Forecast By Thickness, 2023 to 2033 5.3.1. Below 0.1 mm 5.3.2. 0.1 mm 5.4. Y-o-Y Growth Trend Analysis By Thickness, 2018 to 2022 5.5. Absolute $ Opportunity Analysis By Thickness, 2023 to 2033 6. Global Market Analysis 2018 to 2022 and Forecast 2023 to 2033, By End User Industry 6.1. Introduction / Key Findings 6.2. Historical Market Size Value (US$ Million) & Volume (Tonnes) Analysis By End User Industry, 2018 to 2022 6.3. Current and Future Market Size Value (US$ Million) & Volume (Tonnes) Analysis and Forecast By End User Industry, 2023 to 2033 6.3.1. Food & Beverages 6.3.2. Automotive 6.3.3. Pharmaceuticals 6.3.4. Aerospace 6.3.5. Building & Construction 6.3.6. Other Industrial 6.4. Y-o-Y Growth Trend Analysis By End User Industry, 2018 to 2022 6.5. Absolute $ Opportunity Analysis By End User Industry, 2023 to 2033 7. Global Market Analysis 2018 to 2022 and Forecast 2023 to 2033, By Region 7.1. Introduction 7.2. Historical Market Size Value (US$ Million) & Volume (Tonnes) Analysis By Region, 2018 to 2022 7.3. Current Market Size Value (US$ Million) & Volume (Tonnes) Analysis and Forecast By Region, 2023 to 2033 7.3.1. North America 7.3.2. Latin America 7.3.3. Europe 7.3.4. East Asia 7.3.5. South Asia 7.3.6. Oceania 7.3.7. Middle East and Africa 7.4. Market Attractiveness Analysis By Region 8. North America Market Analysis 2018 to 2022 and Forecast 2023 to 2033, By Country 8.1. Historical Market Size Value (US$ Million) & Volume (Tonnes) Trend Analysis By Market Taxonomy, 2018 to 2022 8.2. Market Size Value (US$ Million) & Volume (Tonnes) Forecast By Market Taxonomy, 2023 to 2033 8.2.1. By Country 8.2.1.1. The USA 8.2.1.2. Canada 8.2.2. By Thickness 8.2.3. By End User Industry 8.3. Market Attractiveness Analysis 8.3.1. By Country 8.3.2. By Thickness 8.3.3. By End User Industry 8.4. Key Takeaways 9. Latin America Market Analysis 2018 to 2022 and Forecast 2023 to 2033, By Country 9.1. Historical Market Size Value (US$ Million) & Volume (Tonnes) Trend Analysis By Market Taxonomy, 2018 to 2022 9.2. Market Size Value (US$ Million) & Volume (Tonnes) Forecast By Market Taxonomy, 2023 to 2033 9.2.1. By Country 9.2.1.1. Brazil 9.2.1.2. Mexico 9.2.1.3. Rest of Latin America 9.2.2. By Thickness 9.2.3. By End User Industry 9.3. Market Attractiveness Analysis 9.3.1. By Country 9.3.2. By Thickness 9.3.3. By End User Industry 9.4. Key Takeaways 10. Europe Market Analysis 2018 to 2022 and Forecast 2023 to 2033, By Country 10.1. Historical Market Size Value (US$ Million) & Volume (Tonnes) Trend Analysis By Market Taxonomy, 2018 to 2022 10.2. Market Size Value (US$ Million) & Volume (Tonnes) Forecast By Market Taxonomy, 2023 to 2033 10.2.1. By Country 10.2.1.1. Germany 10.2.1.2. Italy 10.2.1.3. France 10.2.1.4. United Kingdom 10.2.1.5. Spain 10.2.1.6. BENELUX 10.2.1.7. Russia 10.2.1.8. Rest of Europe 10.2.2. By Thickness 10.2.3. By End User Industry 10.3. Market Attractiveness Analysis 10.3.1. By Country 10.3.2. By Thickness 10.3.3. By End User Industry 10.4. Key Takeaways 11. East Asia Market Analysis 2018 to 2022 and Forecast 2023 to 2033, By Country 11.1. Historical Market Size Value (US$ Million) & Volume (Tonnes) Trend Analysis By Market Taxonomy, 2018 to 2022 11.2. Market Size Value (US$ Million) & Volume (Tonnes) Forecast By Market Taxonomy, 2023 to 2033 11.2.1. By Country 11.2.1.1. China 11.2.1.2. Japan 11.2.1.3. South Korea 11.2.2. By Thickness 11.2.3. By End User Industry 11.3. Market Attractiveness Analysis 11.3.1. By Country 11.3.2. By Thickness 11.3.3. By End User Industry 11.4. Key Takeaways 12. South Asia Market Analysis 2018 to 2022 and Forecast 2023 to 2033, By Country 12.1. Historical Market Size Value (US$ Million) & Volume (Tonnes) Trend Analysis By Market Taxonomy, 2018 to 2022 12.2. Market Size Value (US$ Million) & Volume (Tonnes) Forecast By Market Taxonomy, 2023 to 2033 12.2.1. By Country 12.2.1.1. Malaysia 12.2.1.2. Thailand 12.2.1.3. India 12.2.1.4. Rest of South Asia 12.2.2. By Thickness 12.2.3. By End User Industry 12.3. Market Attractiveness Analysis 12.3.1. By Country 12.3.2. By Thickness 12.3.3. By End User Industry 12.4. Key Takeaways 13. Oceania Market Analysis 2018 to 2022 and Forecast 2023 to 2033, By Country 13.1. Historical Market Size Value (US$ Million) & Volume (Tonnes) Trend Analysis By Market Taxonomy, 2018 to 2022 13.2. Market Size Value (US$ Million) & Volume (Tonnes) Forecast By Market Taxonomy, 2023 to 2033 13.2.1. By Country 13.2.1.1. Australia 13.2.1.2. New Zealand 13.2.2. By Thickness 13.2.3. By End User Industry 13.3. Market Attractiveness Analysis 13.3.1. By Country 13.3.2. By Thickness 13.3.3. By End User Industry 13.4. Key Takeaways 14. Middle East and Africa Market Analysis 2018 to 2022 and Forecast 2023 to 2033, By Country 14.1. Historical Market Size Value (US$ Million) & Volume (Tonnes) Trend Analysis By Market Taxonomy, 2018 to 2022 14.2. Market Size Value (US$ Million) & Volume (Tonnes) Forecast By Market Taxonomy, 2023 to 2033 14.2.1. By Country 14.2.1.1. GCC Countries 14.2.1.2. South Africa 14.2.1.3. Türkiye 14.2.1.4. Rest of Middle East and Africa 14.2.2. By Thickness 14.2.3. By End User Industry 14.3. Market Attractiveness Analysis 14.3.1. By Country 14.3.2. By Thickness 14.3.3. By End User Industry 14.4. Key Takeaways 15. Key Countries Market Analysis 15.1. USA 15.1.1. Pricing Analysis 15.1.2. Market Share Analysis, 2022 15.1.2.1. By Thickness 15.1.2.2. By End User Industry 15.2. Canada 15.2.1. Pricing Analysis 15.2.2. Market Share Analysis, 2022 15.2.2.1. By Thickness 15.2.2.2. By End User Industry 15.3. Brazil 15.3.1. Pricing Analysis 15.3.2. Market Share Analysis, 2022 15.3.2.1. By Thickness 15.3.2.2. By End User Industry 15.4. Mexico 15.4.1. Pricing Analysis 15.4.2. Market Share Analysis, 2022 15.4.2.1. By Thickness 15.4.2.2. By End User Industry 15.5. Germany 15.5.1. Pricing Analysis 15.5.2. Market Share Analysis, 2022 15.5.2.1. By Thickness 15.5.2.2. By End User Industry 15.6. Italy 15.6.1. Pricing Analysis 15.6.2. Market Share Analysis, 2022 15.6.2.1. By Thickness 15.6.2.2. By End User Industry 15.7. France 15.7.1. Pricing Analysis 15.7.2. Market Share Analysis, 2022 15.7.2.1. By Thickness 15.7.2.2. By End User Industry 15.8. United Kingdom 15.8.1. Pricing Analysis 15.8.2. Market Share Analysis, 2022 15.8.2.1. By Thickness 15.8.2.2. By End User Industry 15.9. Spain 15.9.1. Pricing Analysis 15.9.2. Market Share Analysis, 2022 15.9.2.1. By Thickness 15.9.2.2. By End User Industry 15.10. BENELUX 15.10.1. Pricing Analysis 15.10.2. Market Share Analysis, 2022 15.10.2.1. By Thickness 15.10.2.2. By End User Industry 15.11. Russia 15.11.1. Pricing Analysis 15.11.2. Market Share Analysis, 2022 15.11.2.1. By Thickness 15.11.2.2. By End User Industry 15.12. China 15.12.1. Pricing Analysis 15.12.2. Market Share Analysis, 2022 15.12.2.1. By Thickness 15.12.2.2. By End User Industry 15.13. Japan 15.13.1. Pricing Analysis 15.13.2. Market Share Analysis, 2022 15.13.2.1. By Thickness 15.13.2.2. By End User Industry 15.14. South Korea 15.14.1. Pricing Analysis 15.14.2. Market Share Analysis, 2022 15.14.2.1. By Thickness 15.14.2.2. By End User Industry 15.15. Malaysia 15.15.1. Pricing Analysis 15.15.2. Market Share Analysis, 2022 15.15.2.1. By Thickness 15.15.2.2. By End User Industry 15.16. Thailand 15.16.1. Pricing Analysis 15.16.2. Market Share Analysis, 2022 15.16.2.1. By Thickness 15.16.2.2. By End User Industry 15.17. India 15.17.1. Pricing Analysis 15.17.2. Market Share Analysis, 2022 15.17.2.1. By Thickness 15.17.2.2. By End User Industry 15.18. Australia 15.18.1. Pricing Analysis 15.18.2. Market Share Analysis, 2022 15.18.2.1. By Thickness 15.18.2.2. By End User Industry 15.19. New Zealand 15.19.1. Pricing Analysis 15.19.2. Market Share Analysis, 2022 15.19.2.1. By Thickness 15.19.2.2. By End User Industry 15.20. GCC Countries 15.20.1. Pricing Analysis 15.20.2. Market Share Analysis, 2022 15.20.2.1. By Thickness 15.20.2.2. By End User Industry 15.21. South Africa 15.21.1. Pricing Analysis 15.21.2. Market Share Analysis, 2022 15.21.2.1. By Thickness 15.21.2.2. By End User Industry 15.22. Türkiye 15.22.1. Pricing Analysis 15.22.2. Market Share Analysis, 2022 15.22.2.1. By Thickness 15.22.2.2. By End User Industry 16. Market Structure Analysis 16.1. Competition Dashboard 16.2. Competition Benchmarking 16.3. Market Share Analysis of Top Players 16.3.1. By Regional 16.3.2. By Thickness 16.3.3. By End User Industry 17. Competition Analysis 17.1. Competition Deep Dive 17.1.1. Acerinox 17.1.1.1. Overview 17.1.1.2. Product Portfolio 17.1.1.3. Profitability by Market Segments 17.1.1.4. Sales Footprint 17.1.1.5. Strategy Overview 17.1.1.5.1. Marketing Strategy 17.1.1.5.2. Product Strategy 17.1.1.5.3. Channel Strategy 17.1.2. Baoshan Iron & Steel Co., Ltd. 17.1.2.1. Overview 17.1.2.2. Product Portfolio 17.1.2.3. Profitability by Market Segments 17.1.2.4. Sales Footprint 17.1.2.5. Strategy Overview 17.1.2.5.1. Marketing Strategy 17.1.2.5.2. Product Strategy 17.1.2.5.3. Channel Strategy 17.1.3. AK Steel Corporation 17.1.3.1. Overview 17.1.3.2. Product Portfolio 17.1.3.3. Profitability by Market Segments 17.1.3.4. Sales Footprint 17.1.3.5. Strategy Overview 17.1.3.5.1. Marketing Strategy 17.1.3.5.2. Product Strategy 17.1.3.5.3. Channel Strategy 17.1.4. Jindal Stainless Group 17.1.4.1. Overview 17.1.4.2. Product Portfolio 17.1.4.3. Profitability by Market Segments 17.1.4.4. Sales Footprint 17.1.4.5. Strategy Overview 17.1.4.5.1. Marketing Strategy 17.1.4.5.2. Product Strategy 17.1.4.5.3. Channel Strategy 17.1.5. Outokumpu Oyj 17.1.5.1. Overview 17.1.5.2. Product Portfolio 17.1.5.3. Profitability by Market Segments 17.1.5.4. Sales Footprint 17.1.5.5. Strategy Overview 17.1.5.5.1. Marketing Strategy 17.1.5.5.2. Product Strategy 17.1.5.5.3. Channel Strategy 17.1.6. Aperam 17.1.6.1. Overview 17.1.6.2. Product Portfolio 17.1.6.3. Profitability by Market Segments 17.1.6.4. Sales Footprint 17.1.6.5. Strategy Overview 17.1.6.5.1. Marketing Strategy 17.1.6.5.2. Product Strategy 17.1.6.5.3. Channel Strategy 17.1.7. Nippon Steel 17.1.7.1. Overview 17.1.7.2. Product Portfolio 17.1.7.3. Profitability by Market Segments 17.1.7.4. Sales Footprint 17.1.7.5. Strategy Overview 17.1.7.5.1. Marketing Strategy 17.1.7.5.2. Product Strategy 17.1.7.5.3. Channel Strategy 17.1.8. ArcelorMittal SA 17.1.8.1. Overview 17.1.8.2. Product Portfolio 17.1.8.3. Profitability by Market Segments 17.1.8.4. Sales Footprint 17.1.8.5. Strategy Overview 17.1.8.5.1. Marketing Strategy 17.1.8.5.2. Product Strategy 17.1.8.5.3. Channel Strategy 17.1.9. Hitachi Metals Neomaterial, Ltd 17.1.9.1. Overview 17.1.9.2. Product Portfolio 17.1.9.3. Profitability by Market Segments 17.1.9.4. Sales Footprint 17.1.9.5. Strategy Overview 17.1.9.5.1. Marketing Strategy 17.1.9.5.2. Product Strategy 17.1.9.5.3. Channel Strategy 17.1.10. Toho International Inc. 17.1.10.1. Overview 17.1.10.2. Product Portfolio 17.1.10.3. Profitability by Market Segments 17.1.10.4. Sales Footprint 17.1.10.5. Strategy Overview 17.1.10.5.1. Marketing Strategy 17.1.10.5.2. Product Strategy 17.1.10.5.3. Channel Strategy 18. Assumptions & Acronyms Used 19. Research Methodology
Don't pay for what you don't need
Customize your report by selecting specific countries or regions and save 30%!
List of Tables
Table 1: Global Market Value (US$ Million) Forecast by Region, 2018 to 2033 Table 2: Global Market Volume (Tonnes) Forecast by Region, 2018 to 2033 Table 3: Global Market Value (US$ Million) Forecast by Thickness, 2018 to 2033 Table 4: Global Market Volume (Tonnes) Forecast by Thickness, 2018 to 2033 Table 5: Global Market Value (US$ Million) Forecast by End User Industry, 2018 to 2033 Table 6: Global Market Volume (Tonnes) Forecast by End User Industry, 2018 to 2033 Table 7: North America Market Value (US$ Million) Forecast by Country, 2018 to 2033 Table 8: North America Market Volume (Tonnes) Forecast by Country, 2018 to 2033 Table 9: North America Market Value (US$ Million) Forecast by Thickness, 2018 to 2033 Table 10: North America Market Volume (Tonnes) Forecast by Thickness, 2018 to 2033 Table 11: North America Market Value (US$ Million) Forecast by End User Industry, 2018 to 2033 Table 12: North America Market Volume (Tonnes) Forecast by End User Industry, 2018 to 2033 Table 13: Latin America Market Value (US$ Million) Forecast by Country, 2018 to 2033 Table 14: Latin America Market Volume (Tonnes) Forecast by Country, 2018 to 2033 Table 15: Latin America Market Value (US$ Million) Forecast by Thickness, 2018 to 2033 Table 16: Latin America Market Volume (Tonnes) Forecast by Thickness, 2018 to 2033 Table 17: Latin America Market Value (US$ Million) Forecast by End User Industry, 2018 to 2033 Table 18: Latin America Market Volume (Tonnes) Forecast by End User Industry, 2018 to 2033 Table 19: Europe Market Value (US$ Million) Forecast by Country, 2018 to 2033 Table 20: Europe Market Volume (Tonnes) Forecast by Country, 2018 to 2033 Table 21: Europe Market Value (US$ Million) Forecast by Thickness, 2018 to 2033 Table 22: Europe Market Volume (Tonnes) Forecast by Thickness, 2018 to 2033 Table 23: Europe Market Value (US$ Million) Forecast by End User Industry, 2018 to 2033 Table 24: Europe Market Volume (Tonnes) Forecast by End User Industry, 2018 to 2033 Table 25: East Asia Market Value (US$ Million) Forecast by Country, 2018 to 2033 Table 26: East Asia Market Volume (Tonnes) Forecast by Country, 2018 to 2033 Table 27: East Asia Market Value (US$ Million) Forecast by Thickness, 2018 to 2033 Table 28: East Asia Market Volume (Tonnes) Forecast by Thickness, 2018 to 2033 Table 29: East Asia Market Value (US$ Million) Forecast by End User Industry, 2018 to 2033 Table 30: East Asia Market Volume (Tonnes) Forecast by End User Industry, 2018 to 2033 Table 31: South Asia Market Value (US$ Million) Forecast by Country, 2018 to 2033 Table 32: South Asia Market Volume (Tonnes) Forecast by Country, 2018 to 2033 Table 33: South Asia Market Value (US$ Million) Forecast by Thickness, 2018 to 2033 Table 34: South Asia Market Volume (Tonnes) Forecast by Thickness, 2018 to 2033 Table 35: South Asia Market Value (US$ Million) Forecast by End User Industry, 2018 to 2033 Table 36: South Asia Market Volume (Tonnes) Forecast by End User Industry, 2018 to 2033 Table 37: Oceania Market Value (US$ Million) Forecast by Country, 2018 to 2033 Table 38: Oceania Market Volume (Tonnes) Forecast by Country, 2018 to 2033 Table 39: Oceania Market Value (US$ Million) Forecast by Thickness, 2018 to 2033 Table 40: Oceania Market Volume (Tonnes) Forecast by Thickness, 2018 to 2033 Table 41: Oceania Market Value (US$ Million) Forecast by End User Industry, 2018 to 2033 Table 42: Oceania Market Volume (Tonnes) Forecast by End User Industry, 2018 to 2033 Table 43: Middle East and Africa Market Value (US$ Million) Forecast by Country, 2018 to 2033 Table 44: Middle East and Africa Market Volume (Tonnes) Forecast by Country, 2018 to 2033 Table 45: Middle East and Africa Market Value (US$ Million) Forecast by Thickness, 2018 to 2033 Table 46: Middle East and Africa Market Volume (Tonnes) Forecast by Thickness, 2018 to 2033 Table 47: Middle East and Africa Market Value (US$ Million) Forecast by End User Industry, 2018 to 2033 Table 48: Middle East and Africa Market Volume (Tonnes) Forecast by End User Industry, 2018 to 2033
List of Charts
Figure 1: Global Market Value (US$ Million) by Thickness, 2023 to 2033 Figure 2: Global Market Value (US$ Million) by End User Industry, 2023 to 2033 Figure 3: Global Market Value (US$ Million) by Region, 2023 to 2033 Figure 4: Global Market Value (US$ Million) Analysis by Region, 2018 to 2033 Figure 5: Global Market Volume (Tonnes) Analysis by Region, 2018 to 2033 Figure 6: Global Market Value Share (%) and BPS Analysis by Region, 2023 to 2033 Figure 7: Global Market Y-o-Y Growth (%) Projections by Region, 2023 to 2033 Figure 8: Global Market Value (US$ Million) Analysis by Thickness, 2018 to 2033 Figure 9: Global Market Volume (Tonnes) Analysis by Thickness, 2018 to 2033 Figure 10: Global Market Value Share (%) and BPS Analysis by Thickness, 2023 to 2033 Figure 11: Global Market Y-o-Y Growth (%) Projections by Thickness, 2023 to 2033 Figure 12: Global Market Value (US$ Million) Analysis by End User Industry, 2018 to 2033 Figure 13: Global Market Volume (Tonnes) Analysis by End User Industry, 2018 to 2033 Figure 14: Global Market Value Share (%) and BPS Analysis by End User Industry, 2023 to 2033 Figure 15: Global Market Y-o-Y Growth (%) Projections by End User Industry, 2023 to 2033 Figure 16: Global Market Attractiveness by Thickness, 2023 to 2033 Figure 17: Global Market Attractiveness by End User Industry, 2023 to 2033 Figure 18: Global Market Attractiveness by Region, 2023 to 2033 Figure 19: North America Market Value (US$ Million) by Thickness, 2023 to 2033 Figure 20: North America Market Value (US$ Million) by End User Industry, 2023 to 2033 Figure 21: North America Market Value (US$ Million) by Country, 2023 to 2033 Figure 22: North America Market Value (US$ Million) Analysis by Country, 2018 to 2033 Figure 23: North America Market Volume (Tonnes) Analysis by Country, 2018 to 2033 Figure 24: North America Market Value Share (%) and BPS Analysis by Country, 2023 to 2033 Figure 25: North America Market Y-o-Y Growth (%) Projections by Country, 2023 to 2033 Figure 26: North America Market Value (US$ Million) Analysis by Thickness, 2018 to 2033 Figure 27: North America Market Volume (Tonnes) Analysis by Thickness, 2018 to 2033 Figure 28: North America Market Value Share (%) and BPS Analysis by Thickness, 2023 to 2033 Figure 29: North America Market Y-o-Y Growth (%) Projections by Thickness, 2023 to 2033 Figure 30: North America Market Value (US$ Million) Analysis by End User Industry, 2018 to 2033 Figure 31: North America Market Volume (Tonnes) Analysis by End User Industry, 2018 to 2033 Figure 32: North America Market Value Share (%) and BPS Analysis by End User Industry, 2023 to 2033 Figure 33: North America Market Y-o-Y Growth (%) Projections by End User Industry, 2023 to 2033 Figure 34: North America Market Attractiveness by Thickness, 2023 to 2033 Figure 35: North America Market Attractiveness by End User Industry, 2023 to 2033 Figure 36: North America Market Attractiveness by Country, 2023 to 2033 Figure 37: Latin America Market Value (US$ Million) by Thickness, 2023 to 2033 Figure 38: Latin America Market Value (US$ Million) by End User Industry, 2023 to 2033 Figure 39: Latin America Market Value (US$ Million) by Country, 2023 to 2033 Figure 40: Latin America Market Value (US$ Million) Analysis by Country, 2018 to 2033 Figure 41: Latin America Market Volume (Tonnes) Analysis by Country, 2018 to 2033 Figure 42: Latin America Market Value Share (%) and BPS Analysis by Country, 2023 to 2033 Figure 43: Latin America Market Y-o-Y Growth (%) Projections by Country, 2023 to 2033 Figure 44: Latin America Market Value (US$ Million) Analysis by Thickness, 2018 to 2033 Figure 45: Latin America Market Volume (Tonnes) Analysis by Thickness, 2018 to 2033 Figure 46: Latin America Market Value Share (%) and BPS Analysis by Thickness, 2023 to 2033 Figure 47: Latin America Market Y-o-Y Growth (%) Projections by Thickness, 2023 to 2033 Figure 48: Latin America Market Value (US$ Million) Analysis by End User Industry, 2018 to 2033 Figure 49: Latin America Market Volume (Tonnes) Analysis by End User Industry, 2018 to 2033 Figure 50: Latin America Market Value Share (%) and BPS Analysis by End User Industry, 2023 to 2033 Figure 51: Latin America Market Y-o-Y Growth (%) Projections by End User Industry, 2023 to 2033 Figure 52: Latin America Market Attractiveness by Thickness, 2023 to 2033 Figure 53: Latin America Market Attractiveness by End User Industry, 2023 to 2033 Figure 54: Latin America Market Attractiveness by Country, 2023 to 2033 Figure 55: Europe Market Value (US$ Million) by Thickness, 2023 to 2033 Figure 56: Europe Market Value (US$ Million) by End User Industry, 2023 to 2033 Figure 57: Europe Market Value (US$ Million) by Country, 2023 to 2033 Figure 58: Europe Market Value (US$ Million) Analysis by Country, 2018 to 2033 Figure 59: Europe Market Volume (Tonnes) Analysis by Country, 2018 to 2033 Figure 60: Europe Market Value Share (%) and BPS Analysis by Country, 2023 to 2033 Figure 61: Europe Market Y-o-Y Growth (%) Projections by Country, 2023 to 2033 Figure 62: Europe Market Value (US$ Million) Analysis by Thickness, 2018 to 2033 Figure 63: Europe Market Volume (Tonnes) Analysis by Thickness, 2018 to 2033 Figure 64: Europe Market Value Share (%) and BPS Analysis by Thickness, 2023 to 2033 Figure 65: Europe Market Y-o-Y Growth (%) Projections by Thickness, 2023 to 2033 Figure 66: Europe Market Value (US$ Million) Analysis by End User Industry, 2018 to 2033 Figure 67: Europe Market Volume (Tonnes) Analysis by End User Industry, 2018 to 2033 Figure 68: Europe Market Value Share (%) and BPS Analysis by End User Industry, 2023 to 2033 Figure 69: Europe Market Y-o-Y Growth (%) Projections by End User Industry, 2023 to 2033 Figure 70: Europe Market Attractiveness by Thickness, 2023 to 2033 Figure 71: Europe Market Attractiveness by End User Industry, 2023 to 2033 Figure 72: Europe Market Attractiveness by Country, 2023 to 2033 Figure 73: East Asia Market Value (US$ Million) by Thickness, 2023 to 2033 Figure 74: East Asia Market Value (US$ Million) by End User Industry, 2023 to 2033 Figure 75: East Asia Market Value (US$ Million) by Country, 2023 to 2033 Figure 76: East Asia Market Value (US$ Million) Analysis by Country, 2018 to 2033 Figure 77: East Asia Market Volume (Tonnes) Analysis by Country, 2018 to 2033 Figure 78: East Asia Market Value Share (%) and BPS Analysis by Country, 2023 to 2033 Figure 79: East Asia Market Y-o-Y Growth (%) Projections by Country, 2023 to 2033 Figure 80: East Asia Market Value (US$ Million) Analysis by Thickness, 2018 to 2033 Figure 81: East Asia Market Volume (Tonnes) Analysis by Thickness, 2018 to 2033 Figure 82: East Asia Market Value Share (%) and BPS Analysis by Thickness, 2023 to 2033 Figure 83: East Asia Market Y-o-Y Growth (%) Projections by Thickness, 2023 to 2033 Figure 84: East Asia Market Value (US$ Million) Analysis by End User Industry, 2018 to 2033 Figure 85: East Asia Market Volume (Tonnes) Analysis by End User Industry, 2018 to 2033 Figure 86: East Asia Market Value Share (%) and BPS Analysis by End User Industry, 2023 to 2033 Figure 87: East Asia Market Y-o-Y Growth (%) Projections by End User Industry, 2023 to 2033 Figure 88: East Asia Market Attractiveness by Thickness, 2023 to 2033 Figure 89: East Asia Market Attractiveness by End User Industry, 2023 to 2033 Figure 90: East Asia Market Attractiveness by Country, 2023 to 2033 Figure 91: South Asia Market Value (US$ Million) by Thickness, 2023 to 2033 Figure 92: South Asia Market Value (US$ Million) by End User Industry, 2023 to 2033 Figure 93: South Asia Market Value (US$ Million) by Country, 2023 to 2033 Figure 94: South Asia Market Value (US$ Million) Analysis by Country, 2018 to 2033 Figure 95: South Asia Market Volume (Tonnes) Analysis by Country, 2018 to 2033 Figure 96: South Asia Market Value Share (%) and BPS Analysis by Country, 2023 to 2033 Figure 97: South Asia Market Y-o-Y Growth (%) Projections by Country, 2023 to 2033 Figure 98: South Asia Market Value (US$ Million) Analysis by Thickness, 2018 to 2033 Figure 99: South Asia Market Volume (Tonnes) Analysis by Thickness, 2018 to 2033 Figure 100: South Asia Market Value Share (%) and BPS Analysis by Thickness, 2023 to 2033 Figure 101: South Asia Market Y-o-Y Growth (%) Projections by Thickness, 2023 to 2033 Figure 102: South Asia Market Value (US$ Million) Analysis by End User Industry, 2018 to 2033 Figure 103: South Asia Market Volume (Tonnes) Analysis by End User Industry, 2018 to 2033 Figure 104: South Asia Market Value Share (%) and BPS Analysis by End User Industry, 2023 to 2033 Figure 105: South Asia Market Y-o-Y Growth (%) Projections by End User Industry, 2023 to 2033 Figure 106: South Asia Market Attractiveness by Thickness, 2023 to 2033 Figure 107: South Asia Market Attractiveness by End User Industry, 2023 to 2033 Figure 108: South Asia Market Attractiveness by Country, 2023 to 2033 Figure 109: Oceania Market Value (US$ Million) by Thickness, 2023 to 2033 Figure 110: Oceania Market Value (US$ Million) by End User Industry, 2023 to 2033 Figure 111: Oceania Market Value (US$ Million) by Country, 2023 to 2033 Figure 112: Oceania Market Value (US$ Million) Analysis by Country, 2018 to 2033 Figure 113: Oceania Market Volume (Tonnes) Analysis by Country, 2018 to 2033 Figure 114: Oceania Market Value Share (%) and BPS Analysis by Country, 2023 to 2033 Figure 115: Oceania Market Y-o-Y Growth (%) Projections by Country, 2023 to 2033 Figure 116: Oceania Market Value (US$ Million) Analysis by Thickness, 2018 to 2033 Figure 117: Oceania Market Volume (Tonnes) Analysis by Thickness, 2018 to 2033 Figure 118: Oceania Market Value Share (%) and BPS Analysis by Thickness, 2023 to 2033 Figure 119: Oceania Market Y-o-Y Growth (%) Projections by Thickness, 2023 to 2033 Figure 120: Oceania Market Value (US$ Million) Analysis by End User Industry, 2018 to 2033 Figure 121: Oceania Market Volume (Tonnes) Analysis by End User Industry, 2018 to 2033 Figure 122: Oceania Market Value Share (%) and BPS Analysis by End User Industry, 2023 to 2033 Figure 123: Oceania Market Y-o-Y Growth (%) Projections by End User Industry, 2023 to 2033 Figure 124: Oceania Market Attractiveness by Thickness, 2023 to 2033 Figure 125: Oceania Market Attractiveness by End User Industry, 2023 to 2033 Figure 126: Oceania Market Attractiveness by Country, 2023 to 2033 Figure 127: Middle East and Africa Market Value (US$ Million) by Thickness, 2023 to 2033 Figure 128: Middle East and Africa Market Value (US$ Million) by End User Industry, 2023 to 2033 Figure 129: Middle East and Africa Market Value (US$ Million) by Country, 2023 to 2033 Figure 130: Middle East and Africa Market Value (US$ Million) Analysis by Country, 2018 to 2033 Figure 131: Middle East and Africa Market Volume (Tonnes) Analysis by Country, 2018 to 2033 Figure 132: Middle East and Africa Market Value Share (%) and BPS Analysis by Country, 2023 to 2033 Figure 133: Middle East and Africa Market Y-o-Y Growth (%) Projections by Country, 2023 to 2033 Figure 134: Middle East and Africa Market Value (US$ Million) Analysis by Thickness, 2018 to 2033 Figure 135: Middle East and Africa Market Volume (Tonnes) Analysis by Thickness, 2018 to 2033 Figure 136: Middle East and Africa Market Value Share (%) and BPS Analysis by Thickness, 2023 to 2033 Figure 137: Middle East and Africa Market Y-o-Y Growth (%) Projections by Thickness, 2023 to 2033 Figure 138: Middle East and Africa Market Value (US$ Million) Analysis by End User Industry, 2018 to 2033 Figure 139: Middle East and Africa Market Volume (Tonnes) Analysis by End User Industry, 2018 to 2033 Figure 140: Middle East and Africa Market Value Share (%) and BPS Analysis by End User Industry, 2023 to 2033 Figure 141: Middle East and Africa Market Y-o-Y Growth (%) Projections by End User Industry, 2023 to 2033 Figure 142: Middle East and Africa Market Attractiveness by Thickness, 2023 to 2033 Figure 143: Middle East and Africa Market Attractiveness by End User Industry, 2023 to 2033 Figure 144: Middle East and Africa Market Attractiveness by Country, 2023 to 2033
Recommendations
Explore Packaging Insights
View Reports