Decision Intelligence Market Size and Share Forecast Outlook 2025 to 2035

The decision intelligence market is expanding rapidly, driven by the convergence of artificial intelligence, analytics, and business intelligence technologies aimed at enhancing strategic decision-making. Organizations are leveraging decision intelligence solutions to convert large data volumes into actionable insights that improve operational efficiency and competitiveness.

The growing emphasis on real-time analytics and data-driven strategies across industries such as finance, healthcare, and retail has accelerated adoption. Cloud-based deployment models and AI-enabled decision platforms are providing scalability, integration, and predictive accuracy, supporting digital transformation initiatives.

As enterprises focus on reducing uncertainty and optimizing resource allocation, the market is expected to achieve strong growth momentum, reinforced by advancements in machine learning and automation.
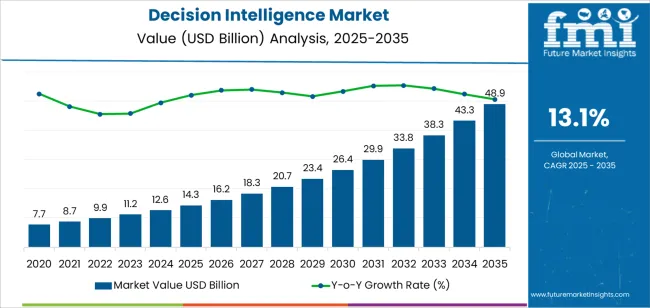
Quick Stats for Decision Intelligence Market

  • Decision Intelligence Market Industry Value (2025): USD 14.3 billion
  • Decision Intelligence Market Forecast Value (2035): USD 48.9 billion
  • Decision Intelligence Market Forecast CAGR: 13.1%
  • Leading Segment in Decision Intelligence Market in 2025: Solutions (73.4%)
  • Key Growth Region in Decision Intelligence Market: North America, Asia-Pacific, Europe
  • Top Key Players in Decision Intelligence Market: Google LLC, Metaphacts GmbH, Intel Corporation, Board International, International Business Machines Corporation, Microsoft Corporation, SAS Institute Inc., Oracle Corporation, SAP SE, Salesforce.com, Inc., Adobe Inc., Teradata Corporation, TIBCO Software Inc.

Decision Intelligence Market Market Value Analysis

Metric Value
Decision Intelligence Market Estimated Value in (2025 E) USD 14.3 billion
Decision Intelligence Market Forecast Value in (2035 F) USD 48.9 billion
Forecast CAGR (2025 to 2035) 13.1%

Segmental Analysis

The market is segmented by Component, Deployment Mode, Enterprise Size, and Industry Vertical and region. By Component, the market is divided into Solutions, Platform, and Services. In terms of Deployment Mode, the market is classified into Cloud and On-Premise. Based on Enterprise Size, the market is segmented into Large Enterprise and Small And Medium-Sized Enterprises (SMEs). By Industry Vertical, the market is divided into IT And Telecom, BFSI, Government, Healthcare, Manufacturing, Retail And Consumer Goods, and Others. Regionally, the market is classified into North America, Latin America, Western Europe, Eastern Europe, Balkan & Baltic Countries, Russia & Belarus, Central Asia, East Asia, South Asia & Pacific, and the Middle East & Africa.
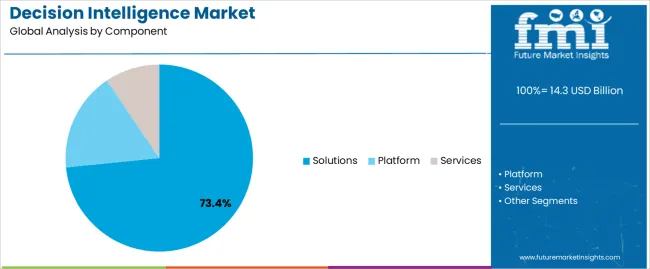
Insights into the Solutions Segment

Decision Intelligence Market Analysis By Component

The solutions segment leads the component category with approximately 73.4% share, driven by the growing need for integrated platforms that combine data modeling, visualization, and predictive analytics. Businesses are increasingly adopting comprehensive decision intelligence systems to streamline workflows and enhance situational awareness.

The segment benefits from the shift toward customized, domain-specific applications capable of supporting both strategic and operational decision-making. Continuous advancements in AI algorithms and cognitive analytics have improved the accuracy and adaptability of solutions.

With organizations prioritizing automation and intelligent forecasting, solution-based offerings are expected to dominate as the foundation of decision intelligence frameworks.
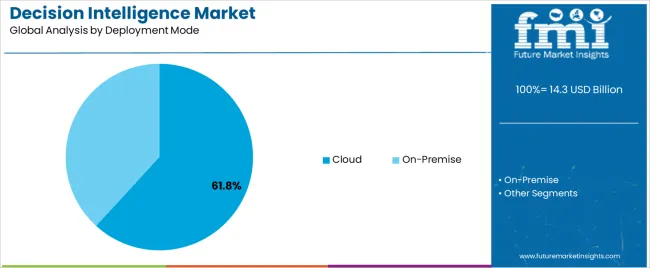
Insights into the Cloud Segment

Decision Intelligence Market Analysis By Deployment Mode

The cloud segment accounts for approximately 61.8% share of the deployment mode category, reflecting the industry’s shift toward scalable and cost-efficient data infrastructure. Cloud-based deployment offers real-time data access, reduced infrastructure costs, and improved collaboration across distributed teams.

The segment’s expansion is further supported by enterprises adopting hybrid and multi-cloud strategies to ensure flexibility and data security. Vendors are enhancing cloud-native platforms with AI-driven decision layers to support rapid deployment and continuous model optimization.

As data volumes continue to grow exponentially, cloud deployment will remain the preferred mode for decision intelligence systems, enabling agile and responsive business environments.
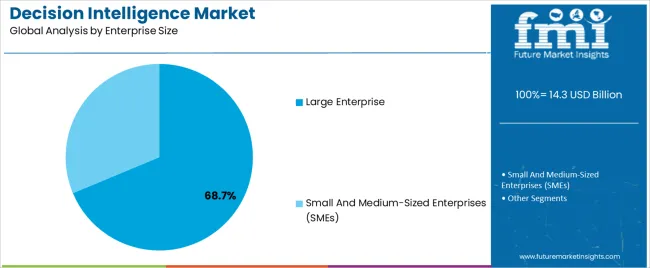
Insights into the Large Enterprise Segment

Decision Intelligence Market Analysis By Enterprise Size

The large enterprise segment holds approximately 68.7% share within the enterprise size category, owing to the significant data complexity and decision-making requirements of large organizations. These enterprises are prioritizing decision intelligence systems to manage cross-functional processes, forecast trends, and optimize strategic initiatives.

The segment benefits from substantial budgets for digital transformation and advanced analytics deployment. Adoption is particularly strong in sectors such as banking, telecommunications, and manufacturing, where predictive insights deliver measurable performance advantages.

With increasing emphasis on data-driven corporate governance and risk management, large enterprises are expected to remain the primary users of decision intelligence technologies.

Comparison of Historical vs Future Outlook on Changing Consumer Trends for the Decision Intelligence Industry

This section highlights the expected developments in the market while providing a detailed analysis of the sector over the last five years. The market grew at a 22.8% CAGR during the historical period. The market is predicted to develop at a constant rate of 18.1% CAGR until 2035.

Historical CAGR 22.8%
Forecasted CAGR 18.1%

The field of decision intelligence is restricted by low data quality, improper integration, and privacy concerns, which hinder its adoption. Crucial factors that are anticipated to restrict the demand for decision intelligence over the forecast period are:

  • The decision intelligence solutions can become obsolete due to the rapidly growing technological improvements.
  • Data privacy and security problems impede the implementation of decision intelligence in various industries.
  • The need for decision intelligence is predicted to be hampered by the challenges associated with integrating various data sources and platforms.
  • The market’s growth is negatively affected by regulatory developments in data governance and analytics techniques.

Top Market Dynamics and Trends Influencing the Decision Intelligence Sector

Convergence of AI and BI Hit the Roof in the Decision Intelligence Sector

The convergence of artificial intelligence (AI) with business intelligence (BI) tools is anticipated to gain considerable traction and is being increasingly adopted by organizations of all sizes.

This amalgamation has bestowed many advantages on businesses, as the integration of AI with BI tools provides more profound insights and analyses, empowering decision-makers to make well-informed and precise decisions.

This, in turn, results in increased efficiency, profitability, and a competitive advantage for the business. The global decision intelligence market is anticipated to witness significant growth in the forthcoming decade as more companies embrace AI-powered BI solutions to stay ahead of the curve.

Expansion of Predictive Analytics Drives the Demand for Decision Intelligence

Predictive analytics models are being used by organizations progressively for scenario planning and forecasting to keep ahead of the fast-paced commercial landscape.

These predictive models help firms foresee risks, take advantage of opportunities, and make well-informed decisions through data analysis and machine learning algorithms.

Predictive analytics model sensation depends on creating a strict structure for the decision intelligence industry. This framework should include promising practices and procedures for gathering, processing, and analyzing data and plans to incorporate the knowledge from predictive analytics into regular business operations.

By putting the proper framework in place, organizations may use predictive analytics to enhance their decision-making skills and obtain a competitive advantage in the decision intelligence sector.

Rise of AI-driven Decision Making

Explainability is becoming increasingly necessary as AI-driven decision-making processes proliferate to maintain transparency and build consumer confidence. This has prompted the creation of decision intelligence, which offers more thorough justifications of AI-generated conclusions by fusing various artificial intelligence technologies with human analysis.

Because of the increased vulnerability, users are now able to assess and challenge the system's outputs and comprehend the reasoning behind the decisions. Decision intelligence is rising in importance because global marketplaces require more reliable and trustworthy decision-making procedures.

Decision Intelligence Industry Analysis by Top Investment Segments

Comprehensive evaluations of certain decision intelligence market areas are provided in this section. The platform component segment and the on-premise deployment segment are the two primary foci of the research.

Through a thorough analysis, this section aims to offer readers a deeper understanding of these areas and their significance within the broader market.

Global Decision Intelligence Market Shelters on Platform Component

Attributes Details
Top Component Platform
CAGR from 2025 to 2035 17.8%

The platform component segment is expected to dominate the decision intelligence market, exhibiting a significant CAGR of 17.8% from 2025 to 2035. However, it is noteworthy that the CAGR for the platform segment was 22.6% during the historical period. The development of platforms for decision intelligence can be attributed to several factors:

  • The rise in the popularity of integrated decision intelligence platforms, particularly cloud-based ones, is largely driven by their scalability, flexibility, and cost-effectiveness in the modern business landscape.
  • Integrating advanced analytics, AI, and machine learning capabilities into decision intelligence platforms is another significant development that has transformed decision-making processes.
  • Decision intelligence platforms now offer customizable options to meet diverse industry needs, enabling businesses to streamline operations, optimize processes, and enhance productivity and efficiency.
  • The focus on user-friendly interfaces and intuitive dashboards is gaining popularity. These enable businesses to make informed decisions quickly and efficiently, giving them a competitive edge.

On-Premise Deployment Bolsters Decision Intelligence Industry

Attributes Details
Top Deployment Mode On-premise
CAGR from 2025 to 2035 17.6%

The on-premise deployment segment is expected to rise at a CAGR of 17.6% from 2025 to 2035. The following factors drive the development of the on-premise segment:

  • Regulations, security constraints, and the desire for more control and protection over data have led businesses to adopt on-premises decision intelligence systems.
  • On-premises solutions are more suited for particular company requirements, while cloud-based choices may provide varying degrees of control.
  • The flexibility provided by on-premises solutions is another factor in decisions made by many businesses. One major benefit is that the program may be configured and customized to meet certain corporate demands.
  • For enterprises, pricing is important because cloud-based solutions can be expensive despite scalability. Businesses choose on-premises solutions because they are a more affordable option.

Analysis of Top Countries, Developing, Deploying, and Adopting Decision Intelligence Solutions

The United States, China, Japan, South Korea, and the United Kingdom are some of the most predominant nations flourishing in the decision intelligence sector.

Countries CAGR (2025 to 2035)
United States 18.4%
United Kingdom 19.3%
China 19.1%
Japan 18.9%
South Korea 19.6%

United States Drives the Demand for Decision Intelligence Platforms

The decision intelligence sector in the United States is predicted to develop gradually at a CAGR of 18.4% until 2035. The sector is expected to achieve a value of USD 48.9 billion by 2035. The need for decision intelligence is being driven by the following factors, which drive the industry's growth:

  • The United States' strong technology environment encourages innovation and adoption across businesses, which drives demand for decision intelligence platforms.
  • The business climate in the United States is fast-paced, and firms compete fiercely.
  • To remain ahead of the competition, businesses use AI-powered platforms and sophisticated analytics to make defensible decisions based on data-driven insights.
  • Utilizing cutting-edge technology, organizations in the United States have obtained a competitive edge to prosper in a rapidly changing market.

Soaring Decision Management Systems in the United Kingdom Market

The decision management systems sector in the United Kingdom is expected to grow substantially over the coming years at a CAGR of 19.3% until 2035. The market is projected to be valued at USD 2.6 billion, indicating a vast potential for growth and investment in this sector. Here are a few of the major trends:

  • The market for decision management systems is expanding due to the United Kingdom's emphasis on data-driven initiatives and digital transformation.
  • Organizations in the United Kingdom are utilizing decision management systems to improve customer experiences, streamline operations, and spur innovation, thanks to a booming business climate and growing acceptance of AI and analytics technology.
  • The United Kingdom's sectors are experiencing a sharp increase in demand for decision-management systems due to the emphasis on competitiveness, efficiency, and agility.

Chinese Decision Intelligence Industry Supports Cognitive Computing

The need for decision intelligence in China is expected to grow at a CAGR of 19.1% through 2035. The industry is likely to be valued at USD 10.6 billion by 2035. The primary trends are:

  • Through investments in artificial intelligence research and development, the Chinese decision-intelligence business supports cognitive computing.
  • Chinese enterprises utilize large datasets and machine learning algorithm developments to include cognitive computing capabilities in decision intelligence systems.
  • More advanced analysis, pattern recognition, and predictive modeling are made possible, enabling businesses to get practical insights and make wise decisions in quickly changing business contexts.
  • Cognitive computing is critical in fostering innovation and competition in the Chinese decision intelligence sector.

Advancements in the Japanese Data-Driven Decision-Making Sector

The demand for decision intelligence in Japan is soaring dramatically; the data-driven decision making industry is anticipated to grow at a CAGR of 18.9% through 2035. Among the main motivators are:

  • Japan's data-driven decision-making industry is expected to grow significantly in the following decade.
  • Japanese businesses highly value innovation and technology. To improve decision-making, they invest in automation, analytics, and artificial intelligence (AI).
  • Personalized suggestions, predictive analytics, and real-time insights are made possible by integrating cutting-edge technology, which boosts productivity and competitiveness.
  • Furthermore, industry-academia partnerships promote research and development, accelerating the advancement of data-driven decision-making in Japan.

Demand for Decision Intelligence for Marketing in South Korea

Decision intelligence is expected to expand rapidly in South Korea, with a potential CAGR of 19.6% through 2035. This market is likely to reach a valuation of USD 4.4 billion by 2035. The following are some of the main trends:

  • Decision intelligence for marketing is in high demand in South Korea as companies want to use data-driven tactics to gain a competitive edge.
  • Decision intelligence helps businesses optimize marketing efforts and improve customer engagement by focusing on precision targeting, tailored messaging, and customer segmentation.
  • Implementing artificial intelligence and advanced analytics technology enables marketers to glean meaningful insights from various datasets, spurring creativity and efficacy in advertising campaigns in South Korea.

Leading Stakeholders Shaping the Decision Intelligence Industry Outlook

As organizations employ innovations and strategic efforts to reshape the way activities appear in the future, the global decision intelligence sector is undergoing an unprecedented shift.

Technological firms' research and development centers are at the forefront of developing innovative platforms, operational procedures, and technological improvements.

Technological advancements are expedited when industry participants, academic institutions, and governmental bodies collaborate to create a dynamic ecosystem.

With their respective competence areas, Google, IBM Corp., and Intel drive the cognitive computing business. Google aggressively develops artificial intelligence (AI) for decision-making technologies, emphasizing scalability and efficiency gains.

Leading enterprise-wide business intelligence efforts, IBM specializes in creating intelligent technology for rapidly expanding business goals. Intel's expertise in decision management systems technology impacts software management advances, which is closely related to decision intelligence.

Their combined influence promotes creativity, effectiveness, and scalability in decision intelligence products. It is essential to developing the decision intelligence sector toward broad acceptance and the assembly of intelligent technology platforms.

These industry participants help to form the global decision intelligence market's general outlook for the upcoming ten years by encouraging innovation, market expansion, and technological advancements.

Recent Developments in the Decision Intelligence Industry
  • In February 2025, Mastercard announced Decision Intelligence Pro, which uses generative artificial intelligence to analyze transaction risks and prevent fraudulent activity, ensuring consumers have a safe payment experience.
  • In November 2025, SAS integrated its cloud-based decision-making solution, SAS Decision Builder, into Microsoft Fabric, aiming to improve user experience by offering a flexible and scalable solution.
  • In June 2025, Microsoft and P&G partnered to improve the efficiency of edge computing, artificial intelligence, and machine learning services in P&G's production facilities, aiming to boost productivity and reduce costs.
  • In June 2025, IBM acquired Databand.ai, providing businesses greater control over the software, which can be used as a SaaS or self-hosted solution, offering flexibility and customization options.

Key Players and Market Concentration in the Decision Intelligence Market

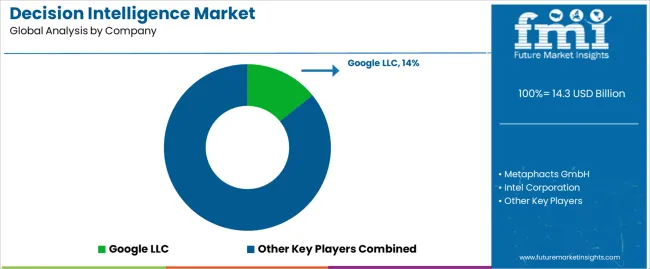
Decision Intelligence Market Analysis By Company

  • Google LLC
  • Metaphacts GmbH
  • Intel Corporation
  • Board International
  • International Business Machines Corporation
  • Microsoft Corporation
  • SAS Institute Inc.
  • Oracle Corporation
  • SAP SE
  • Salesforce.com, Inc.
  • Adobe Inc.
  • Teradata Corporation
  • TIBCO Software Inc.

Top Segments Studied in the Decision Intelligence Market

By Component:

  • Platform
  • Solutions
  • Services

By Deployment Mode:

  • On-premise
  • Cloud

By Enterprise Size:

  • Large Enterprise
  • Small and Medium-sized Enterprises (SMEs)

By Industry Vertical:

  • Energy and Utilities
  • BFSI
  • IT and Telecom
  • Government
  • Healthcare
  • Manufacturing
  • Retail and Consumer Goods
  • Others

By Region:

  • North America
  • Latin America
  • Europe
  • East Asia
  • South Asia
  • Oceania
  • Middle East and Africa

Frequently Asked Questions

How big is the decision intelligence market in 2025?

The global decision intelligence market is estimated to be valued at USD 14.3 billion in 2025.

What will be the size of decision intelligence market in 2035?

The market size for the decision intelligence market is projected to reach USD 48.9 billion by 2035.

How much will be the decision intelligence market growth between 2025 and 2035?

The decision intelligence market is expected to grow at a 13.1% CAGR between 2025 and 2035.

What are the key product types in the decision intelligence market?

The key product types in decision intelligence market are solutions, platform and services.

Which deployment mode segment to contribute significant share in the decision intelligence market in 2025?

In terms of deployment mode, cloud segment to command 61.8% share in the decision intelligence market in 2025.

Table of Content

  1. Executive Summary
    • Global Market Outlook
    • Demand to side Trends
    • Supply to side Trends
    • Technology Roadmap Analysis
    • Analysis and Recommendations
  2. Market Overview
    • Market Coverage / Taxonomy
    • Market Definition / Scope / Limitations
  3. Market Background
    • Market Dynamics
      • Drivers
      • Restraints
      • Opportunity
      • Trends
    • Scenario Forecast
      • Demand in Optimistic Scenario
      • Demand in Likely Scenario
      • Demand in Conservative Scenario
    • Opportunity Map Analysis
    • Product Life Cycle Analysis
    • Supply Chain Analysis
    • Investment Feasibility Matrix
    • Value Chain Analysis
    • PESTLE and Porter’s Analysis
    • Regulatory Landscape
    • Regional Parent Market Outlook
    • Production and Consumption Statistics
    • Import and Export Statistics
  4. Global Market Analysis 2020 to 2024 and Forecast, 2025 to 2035
    • Historical Market Size Value (USD Million) Analysis, 2020 to 2024
    • Current and Future Market Size Value (USD Million) Projections, 2025 to 2035
      • Y to o to Y Growth Trend Analysis
      • Absolute $ Opportunity Analysis
  5. Global Market Pricing Analysis 2020 to 2024 and Forecast 2025 to 2035
  6. Global Market Analysis 2020 to 2024 and Forecast 2025 to 2035, By Component
    • Introduction / Key Findings
    • Historical Market Size Value (USD Million) Analysis By Component , 2020 to 2024
    • Current and Future Market Size Value (USD Million) Analysis and Forecast By Component , 2025 to 2035
      • Solutions
      • Platform
      • Services
    • Y to o to Y Growth Trend Analysis By Component , 2020 to 2024
    • Absolute $ Opportunity Analysis By Component , 2025 to 2035
  7. Global Market Analysis 2020 to 2024 and Forecast 2025 to 2035, By Deployment Mode
    • Introduction / Key Findings
    • Historical Market Size Value (USD Million) Analysis By Deployment Mode, 2020 to 2024
    • Current and Future Market Size Value (USD Million) Analysis and Forecast By Deployment Mode, 2025 to 2035
      • Cloud
      • On-Premise
    • Y to o to Y Growth Trend Analysis By Deployment Mode, 2020 to 2024
    • Absolute $ Opportunity Analysis By Deployment Mode, 2025 to 2035
  8. Global Market Analysis 2020 to 2024 and Forecast 2025 to 2035, By Enterprise Size
    • Introduction / Key Findings
    • Historical Market Size Value (USD Million) Analysis By Enterprise Size, 2020 to 2024
    • Current and Future Market Size Value (USD Million) Analysis and Forecast By Enterprise Size, 2025 to 2035
      • Large Enterprise
      • Small And Medium-Sized Enterprises (SMEs)
    • Y to o to Y Growth Trend Analysis By Enterprise Size, 2020 to 2024
    • Absolute $ Opportunity Analysis By Enterprise Size, 2025 to 2035
  9. Global Market Analysis 2020 to 2024 and Forecast 2025 to 2035, By Industry Vertical
    • Introduction / Key Findings
    • Historical Market Size Value (USD Million) Analysis By Industry Vertical, 2020 to 2024
    • Current and Future Market Size Value (USD Million) Analysis and Forecast By Industry Vertical, 2025 to 2035
      • IT And Telecom
      • BFSI
      • Government
      • Healthcare
      • Manufacturing
      • Retail And Consumer Goods
      • Others
    • Y to o to Y Growth Trend Analysis By Industry Vertical, 2020 to 2024
    • Absolute $ Opportunity Analysis By Industry Vertical, 2025 to 2035
  10. Global Market Analysis 2020 to 2024 and Forecast 2025 to 2035, By Region
    • Introduction
    • Historical Market Size Value (USD Million) Analysis By Region, 2020 to 2024
    • Current Market Size Value (USD Million) Analysis and Forecast By Region, 2025 to 2035
      • North America
      • Latin America
      • Western Europe
      • Eastern Europe
      • East Asia
      • South Asia and Pacific
      • Middle East & Africa
    • Market Attractiveness Analysis By Region
  11. North America Market Analysis 2020 to 2024 and Forecast 2025 to 2035, By Country
    • Historical Market Size Value (USD Million) Trend Analysis By Market Taxonomy, 2020 to 2024
    • Market Size Value (USD Million) Forecast By Market Taxonomy, 2025 to 2035
      • By Country
        • USA
        • Canada
        • Mexico
      • By Component
      • By Deployment Mode
      • By Enterprise Size
      • By Industry Vertical
    • Market Attractiveness Analysis
      • By Country
      • By Component
      • By Deployment Mode
      • By Enterprise Size
      • By Industry Vertical
    • Key Takeaways
  12. Latin America Market Analysis 2020 to 2024 and Forecast 2025 to 2035, By Country
    • Historical Market Size Value (USD Million) Trend Analysis By Market Taxonomy, 2020 to 2024
    • Market Size Value (USD Million) Forecast By Market Taxonomy, 2025 to 2035
      • By Country
        • Brazil
        • Chile
        • Rest of Latin America
      • By Component
      • By Deployment Mode
      • By Enterprise Size
      • By Industry Vertical
    • Market Attractiveness Analysis
      • By Country
      • By Component
      • By Deployment Mode
      • By Enterprise Size
      • By Industry Vertical
    • Key Takeaways
  13. Western Europe Market Analysis 2020 to 2024 and Forecast 2025 to 2035, By Country
    • Historical Market Size Value (USD Million) Trend Analysis By Market Taxonomy, 2020 to 2024
    • Market Size Value (USD Million) Forecast By Market Taxonomy, 2025 to 2035
      • By Country
        • Germany
        • UK
        • Italy
        • Spain
        • France
        • Nordic
        • BENELUX
        • Rest of Western Europe
      • By Component
      • By Deployment Mode
      • By Enterprise Size
      • By Industry Vertical
    • Market Attractiveness Analysis
      • By Country
      • By Component
      • By Deployment Mode
      • By Enterprise Size
      • By Industry Vertical
    • Key Takeaways
  14. Eastern Europe Market Analysis 2020 to 2024 and Forecast 2025 to 2035, By Country
    • Historical Market Size Value (USD Million) Trend Analysis By Market Taxonomy, 2020 to 2024
    • Market Size Value (USD Million) Forecast By Market Taxonomy, 2025 to 2035
      • By Country
        • Russia
        • Poland
        • Hungary
        • Balkan & Baltic
        • Rest of Eastern Europe
      • By Component
      • By Deployment Mode
      • By Enterprise Size
      • By Industry Vertical
    • Market Attractiveness Analysis
      • By Country
      • By Component
      • By Deployment Mode
      • By Enterprise Size
      • By Industry Vertical
    • Key Takeaways
  15. East Asia Market Analysis 2020 to 2024 and Forecast 2025 to 2035, By Country
    • Historical Market Size Value (USD Million) Trend Analysis By Market Taxonomy, 2020 to 2024
    • Market Size Value (USD Million) Forecast By Market Taxonomy, 2025 to 2035
      • By Country
        • China
        • Japan
        • South Korea
      • By Component
      • By Deployment Mode
      • By Enterprise Size
      • By Industry Vertical
    • Market Attractiveness Analysis
      • By Country
      • By Component
      • By Deployment Mode
      • By Enterprise Size
      • By Industry Vertical
    • Key Takeaways
  16. South Asia and Pacific Market Analysis 2020 to 2024 and Forecast 2025 to 2035, By Country
    • Historical Market Size Value (USD Million) Trend Analysis By Market Taxonomy, 2020 to 2024
    • Market Size Value (USD Million) Forecast By Market Taxonomy, 2025 to 2035
      • By Country
        • India
        • ASEAN
        • Australia & New Zealand
        • Rest of South Asia and Pacific
      • By Component
      • By Deployment Mode
      • By Enterprise Size
      • By Industry Vertical
    • Market Attractiveness Analysis
      • By Country
      • By Component
      • By Deployment Mode
      • By Enterprise Size
      • By Industry Vertical
    • Key Takeaways
  17. Middle East & Africa Market Analysis 2020 to 2024 and Forecast 2025 to 2035, By Country
    • Historical Market Size Value (USD Million) Trend Analysis By Market Taxonomy, 2020 to 2024
    • Market Size Value (USD Million) Forecast By Market Taxonomy, 2025 to 2035
      • By Country
        • Kingdom of Saudi Arabia
        • Other GCC Countries
        • Turkiye
        • South Africa
        • Other African Union
        • Rest of Middle East & Africa
      • By Component
      • By Deployment Mode
      • By Enterprise Size
      • By Industry Vertical
    • Market Attractiveness Analysis
      • By Country
      • By Component
      • By Deployment Mode
      • By Enterprise Size
      • By Industry Vertical
    • Key Takeaways
  18. Key Countries Market Analysis
    • USA
      • Pricing Analysis
      • Market Share Analysis, 2024
        • By Component
        • By Deployment Mode
        • By Enterprise Size
        • By Industry Vertical
    • Canada
      • Pricing Analysis
      • Market Share Analysis, 2024
        • By Component
        • By Deployment Mode
        • By Enterprise Size
        • By Industry Vertical
    • Mexico
      • Pricing Analysis
      • Market Share Analysis, 2024
        • By Component
        • By Deployment Mode
        • By Enterprise Size
        • By Industry Vertical
    • Brazil
      • Pricing Analysis
      • Market Share Analysis, 2024
        • By Component
        • By Deployment Mode
        • By Enterprise Size
        • By Industry Vertical
    • Chile
      • Pricing Analysis
      • Market Share Analysis, 2024
        • By Component
        • By Deployment Mode
        • By Enterprise Size
        • By Industry Vertical
    • Germany
      • Pricing Analysis
      • Market Share Analysis, 2024
        • By Component
        • By Deployment Mode
        • By Enterprise Size
        • By Industry Vertical
    • UK
      • Pricing Analysis
      • Market Share Analysis, 2024
        • By Component
        • By Deployment Mode
        • By Enterprise Size
        • By Industry Vertical
    • Italy
      • Pricing Analysis
      • Market Share Analysis, 2024
        • By Component
        • By Deployment Mode
        • By Enterprise Size
        • By Industry Vertical
    • Spain
      • Pricing Analysis
      • Market Share Analysis, 2024
        • By Component
        • By Deployment Mode
        • By Enterprise Size
        • By Industry Vertical
    • France
      • Pricing Analysis
      • Market Share Analysis, 2024
        • By Component
        • By Deployment Mode
        • By Enterprise Size
        • By Industry Vertical
    • India
      • Pricing Analysis
      • Market Share Analysis, 2024
        • By Component
        • By Deployment Mode
        • By Enterprise Size
        • By Industry Vertical
    • ASEAN
      • Pricing Analysis
      • Market Share Analysis, 2024
        • By Component
        • By Deployment Mode
        • By Enterprise Size
        • By Industry Vertical
    • Australia & New Zealand
      • Pricing Analysis
      • Market Share Analysis, 2024
        • By Component
        • By Deployment Mode
        • By Enterprise Size
        • By Industry Vertical
    • China
      • Pricing Analysis
      • Market Share Analysis, 2024
        • By Component
        • By Deployment Mode
        • By Enterprise Size
        • By Industry Vertical
    • Japan
      • Pricing Analysis
      • Market Share Analysis, 2024
        • By Component
        • By Deployment Mode
        • By Enterprise Size
        • By Industry Vertical
    • South Korea
      • Pricing Analysis
      • Market Share Analysis, 2024
        • By Component
        • By Deployment Mode
        • By Enterprise Size
        • By Industry Vertical
    • Russia
      • Pricing Analysis
      • Market Share Analysis, 2024
        • By Component
        • By Deployment Mode
        • By Enterprise Size
        • By Industry Vertical
    • Poland
      • Pricing Analysis
      • Market Share Analysis, 2024
        • By Component
        • By Deployment Mode
        • By Enterprise Size
        • By Industry Vertical
    • Hungary
      • Pricing Analysis
      • Market Share Analysis, 2024
        • By Component
        • By Deployment Mode
        • By Enterprise Size
        • By Industry Vertical
    • Kingdom of Saudi Arabia
      • Pricing Analysis
      • Market Share Analysis, 2024
        • By Component
        • By Deployment Mode
        • By Enterprise Size
        • By Industry Vertical
    • Turkiye
      • Pricing Analysis
      • Market Share Analysis, 2024
        • By Component
        • By Deployment Mode
        • By Enterprise Size
        • By Industry Vertical
    • South Africa
      • Pricing Analysis
      • Market Share Analysis, 2024
        • By Component
        • By Deployment Mode
        • By Enterprise Size
        • By Industry Vertical
  19. Market Structure Analysis
    • Competition Dashboard
    • Competition Benchmarking
    • Market Share Analysis of Top Players
      • By Regional
      • By Component
      • By Deployment Mode
      • By Enterprise Size
      • By Industry Vertical
  20. Competition Analysis
    • Competition Deep Dive
      • Google LLC
        • Overview
        • Product Portfolio
        • Profitability by Market Segments (Product/Age /Sales Channel/Region)
        • Sales Footprint
        • Strategy Overview
          • Marketing Strategy
          • Product Strategy
          • Channel Strategy
      • Metaphacts GmbH
      • Intel Corporation
      • Board International
      • International Business Machines Corporation
      • Microsoft Corporation
      • SAS Institute Inc.
      • Oracle Corporation
      • SAP SE
      • Salesforce.com, Inc.
      • Adobe Inc.
      • Teradata Corporation
      • TIBCO Software Inc.
  21. Assumptions & Acronyms Used
  22. Research Methodology

List of Tables

  • Table 1: Global Market Value (USD Million) Forecast by Region, 2020 to 2035
  • Table 2: Global Market Value (USD Million) Forecast by Component , 2020 to 2035
  • Table 3: Global Market Value (USD Million) Forecast by Deployment Mode, 2020 to 2035
  • Table 4: Global Market Value (USD Million) Forecast by Enterprise Size, 2020 to 2035
  • Table 5: Global Market Value (USD Million) Forecast by Industry Vertical, 2020 to 2035
  • Table 6: North America Market Value (USD Million) Forecast by Country, 2020 to 2035
  • Table 7: North America Market Value (USD Million) Forecast by Component , 2020 to 2035
  • Table 8: North America Market Value (USD Million) Forecast by Deployment Mode, 2020 to 2035
  • Table 9: North America Market Value (USD Million) Forecast by Enterprise Size, 2020 to 2035
  • Table 10: North America Market Value (USD Million) Forecast by Industry Vertical, 2020 to 2035
  • Table 11: Latin America Market Value (USD Million) Forecast by Country, 2020 to 2035
  • Table 12: Latin America Market Value (USD Million) Forecast by Component , 2020 to 2035
  • Table 13: Latin America Market Value (USD Million) Forecast by Deployment Mode, 2020 to 2035
  • Table 14: Latin America Market Value (USD Million) Forecast by Enterprise Size, 2020 to 2035
  • Table 15: Latin America Market Value (USD Million) Forecast by Industry Vertical, 2020 to 2035
  • Table 16: Western Europe Market Value (USD Million) Forecast by Country, 2020 to 2035
  • Table 17: Western Europe Market Value (USD Million) Forecast by Component , 2020 to 2035
  • Table 18: Western Europe Market Value (USD Million) Forecast by Deployment Mode, 2020 to 2035
  • Table 19: Western Europe Market Value (USD Million) Forecast by Enterprise Size, 2020 to 2035
  • Table 20: Western Europe Market Value (USD Million) Forecast by Industry Vertical, 2020 to 2035
  • Table 21: Eastern Europe Market Value (USD Million) Forecast by Country, 2020 to 2035
  • Table 22: Eastern Europe Market Value (USD Million) Forecast by Component , 2020 to 2035
  • Table 23: Eastern Europe Market Value (USD Million) Forecast by Deployment Mode, 2020 to 2035
  • Table 24: Eastern Europe Market Value (USD Million) Forecast by Enterprise Size, 2020 to 2035
  • Table 25: Eastern Europe Market Value (USD Million) Forecast by Industry Vertical, 2020 to 2035
  • Table 26: East Asia Market Value (USD Million) Forecast by Country, 2020 to 2035
  • Table 27: East Asia Market Value (USD Million) Forecast by Component , 2020 to 2035
  • Table 28: East Asia Market Value (USD Million) Forecast by Deployment Mode, 2020 to 2035
  • Table 29: East Asia Market Value (USD Million) Forecast by Enterprise Size, 2020 to 2035
  • Table 30: East Asia Market Value (USD Million) Forecast by Industry Vertical, 2020 to 2035
  • Table 31: South Asia and Pacific Market Value (USD Million) Forecast by Country, 2020 to 2035
  • Table 32: South Asia and Pacific Market Value (USD Million) Forecast by Component , 2020 to 2035
  • Table 33: South Asia and Pacific Market Value (USD Million) Forecast by Deployment Mode, 2020 to 2035
  • Table 34: South Asia and Pacific Market Value (USD Million) Forecast by Enterprise Size, 2020 to 2035
  • Table 35: South Asia and Pacific Market Value (USD Million) Forecast by Industry Vertical, 2020 to 2035
  • Table 36: Middle East & Africa Market Value (USD Million) Forecast by Country, 2020 to 2035
  • Table 37: Middle East & Africa Market Value (USD Million) Forecast by Component , 2020 to 2035
  • Table 38: Middle East & Africa Market Value (USD Million) Forecast by Deployment Mode, 2020 to 2035
  • Table 39: Middle East & Africa Market Value (USD Million) Forecast by Enterprise Size, 2020 to 2035
  • Table 40: Middle East & Africa Market Value (USD Million) Forecast by Industry Vertical, 2020 to 2035

List of Figures

  • Figure 1: Global Market Pricing Analysis
  • Figure 2: Global Market Value (USD Million) Forecast 2020-2035
  • Figure 3: Global Market Value Share and BPS Analysis by Component , 2025 and 2035
  • Figure 4: Global Market Y to o to Y Growth Comparison by Component , 2025-2035
  • Figure 5: Global Market Attractiveness Analysis by Component
  • Figure 6: Global Market Value Share and BPS Analysis by Deployment Mode, 2025 and 2035
  • Figure 7: Global Market Y to o to Y Growth Comparison by Deployment Mode, 2025-2035
  • Figure 8: Global Market Attractiveness Analysis by Deployment Mode
  • Figure 9: Global Market Value Share and BPS Analysis by Enterprise Size, 2025 and 2035
  • Figure 10: Global Market Y to o to Y Growth Comparison by Enterprise Size, 2025-2035
  • Figure 11: Global Market Attractiveness Analysis by Enterprise Size
  • Figure 12: Global Market Value Share and BPS Analysis by Industry Vertical, 2025 and 2035
  • Figure 13: Global Market Y to o to Y Growth Comparison by Industry Vertical, 2025-2035
  • Figure 14: Global Market Attractiveness Analysis by Industry Vertical
  • Figure 15: Global Market Value (USD Million) Share and BPS Analysis by Region, 2025 and 2035
  • Figure 16: Global Market Y to o to Y Growth Comparison by Region, 2025-2035
  • Figure 17: Global Market Attractiveness Analysis by Region
  • Figure 18: North America Market Incremental Dollar Opportunity, 2025-2035
  • Figure 19: Latin America Market Incremental Dollar Opportunity, 2025-2035
  • Figure 20: Western Europe Market Incremental Dollar Opportunity, 2025-2035
  • Figure 21: Eastern Europe Market Incremental Dollar Opportunity, 2025-2035
  • Figure 22: East Asia Market Incremental Dollar Opportunity, 2025-2035
  • Figure 23: South Asia and Pacific Market Incremental Dollar Opportunity, 2025-2035
  • Figure 24: Middle East & Africa Market Incremental Dollar Opportunity, 2025-2035
  • Figure 25: North America Market Value Share and BPS Analysis by Country, 2025 and 2035
  • Figure 26: North America Market Value Share and BPS Analysis by Component , 2025 and 2035
  • Figure 27: North America Market Y to o to Y Growth Comparison by Component , 2025-2035
  • Figure 28: North America Market Attractiveness Analysis by Component
  • Figure 29: North America Market Value Share and BPS Analysis by Deployment Mode, 2025 and 2035
  • Figure 30: North America Market Y to o to Y Growth Comparison by Deployment Mode, 2025-2035
  • Figure 31: North America Market Attractiveness Analysis by Deployment Mode
  • Figure 32: North America Market Value Share and BPS Analysis by Enterprise Size, 2025 and 2035
  • Figure 33: North America Market Y to o to Y Growth Comparison by Enterprise Size, 2025-2035
  • Figure 34: North America Market Attractiveness Analysis by Enterprise Size
  • Figure 35: North America Market Value Share and BPS Analysis by Industry Vertical, 2025 and 2035
  • Figure 36: North America Market Y to o to Y Growth Comparison by Industry Vertical, 2025-2035
  • Figure 37: North America Market Attractiveness Analysis by Industry Vertical
  • Figure 38: Latin America Market Value Share and BPS Analysis by Country, 2025 and 2035
  • Figure 39: Latin America Market Value Share and BPS Analysis by Component , 2025 and 2035
  • Figure 40: Latin America Market Y to o to Y Growth Comparison by Component , 2025-2035
  • Figure 41: Latin America Market Attractiveness Analysis by Component
  • Figure 42: Latin America Market Value Share and BPS Analysis by Deployment Mode, 2025 and 2035
  • Figure 43: Latin America Market Y to o to Y Growth Comparison by Deployment Mode, 2025-2035
  • Figure 44: Latin America Market Attractiveness Analysis by Deployment Mode
  • Figure 45: Latin America Market Value Share and BPS Analysis by Enterprise Size, 2025 and 2035
  • Figure 46: Latin America Market Y to o to Y Growth Comparison by Enterprise Size, 2025-2035
  • Figure 47: Latin America Market Attractiveness Analysis by Enterprise Size
  • Figure 48: Latin America Market Value Share and BPS Analysis by Industry Vertical, 2025 and 2035
  • Figure 49: Latin America Market Y to o to Y Growth Comparison by Industry Vertical, 2025-2035
  • Figure 50: Latin America Market Attractiveness Analysis by Industry Vertical
  • Figure 51: Western Europe Market Value Share and BPS Analysis by Country, 2025 and 2035
  • Figure 52: Western Europe Market Value Share and BPS Analysis by Component , 2025 and 2035
  • Figure 53: Western Europe Market Y to o to Y Growth Comparison by Component , 2025-2035
  • Figure 54: Western Europe Market Attractiveness Analysis by Component
  • Figure 55: Western Europe Market Value Share and BPS Analysis by Deployment Mode, 2025 and 2035
  • Figure 56: Western Europe Market Y to o to Y Growth Comparison by Deployment Mode, 2025-2035
  • Figure 57: Western Europe Market Attractiveness Analysis by Deployment Mode
  • Figure 58: Western Europe Market Value Share and BPS Analysis by Enterprise Size, 2025 and 2035
  • Figure 59: Western Europe Market Y to o to Y Growth Comparison by Enterprise Size, 2025-2035
  • Figure 60: Western Europe Market Attractiveness Analysis by Enterprise Size
  • Figure 61: Western Europe Market Value Share and BPS Analysis by Industry Vertical, 2025 and 2035
  • Figure 62: Western Europe Market Y to o to Y Growth Comparison by Industry Vertical, 2025-2035
  • Figure 63: Western Europe Market Attractiveness Analysis by Industry Vertical
  • Figure 64: Eastern Europe Market Value Share and BPS Analysis by Country, 2025 and 2035
  • Figure 65: Eastern Europe Market Value Share and BPS Analysis by Component , 2025 and 2035
  • Figure 66: Eastern Europe Market Y to o to Y Growth Comparison by Component , 2025-2035
  • Figure 67: Eastern Europe Market Attractiveness Analysis by Component
  • Figure 68: Eastern Europe Market Value Share and BPS Analysis by Deployment Mode, 2025 and 2035
  • Figure 69: Eastern Europe Market Y to o to Y Growth Comparison by Deployment Mode, 2025-2035
  • Figure 70: Eastern Europe Market Attractiveness Analysis by Deployment Mode
  • Figure 71: Eastern Europe Market Value Share and BPS Analysis by Enterprise Size, 2025 and 2035
  • Figure 72: Eastern Europe Market Y to o to Y Growth Comparison by Enterprise Size, 2025-2035
  • Figure 73: Eastern Europe Market Attractiveness Analysis by Enterprise Size
  • Figure 74: Eastern Europe Market Value Share and BPS Analysis by Industry Vertical, 2025 and 2035
  • Figure 75: Eastern Europe Market Y to o to Y Growth Comparison by Industry Vertical, 2025-2035
  • Figure 76: Eastern Europe Market Attractiveness Analysis by Industry Vertical
  • Figure 77: East Asia Market Value Share and BPS Analysis by Country, 2025 and 2035
  • Figure 78: East Asia Market Value Share and BPS Analysis by Component , 2025 and 2035
  • Figure 79: East Asia Market Y to o to Y Growth Comparison by Component , 2025-2035
  • Figure 80: East Asia Market Attractiveness Analysis by Component
  • Figure 81: East Asia Market Value Share and BPS Analysis by Deployment Mode, 2025 and 2035
  • Figure 82: East Asia Market Y to o to Y Growth Comparison by Deployment Mode, 2025-2035
  • Figure 83: East Asia Market Attractiveness Analysis by Deployment Mode
  • Figure 84: East Asia Market Value Share and BPS Analysis by Enterprise Size, 2025 and 2035
  • Figure 85: East Asia Market Y to o to Y Growth Comparison by Enterprise Size, 2025-2035
  • Figure 86: East Asia Market Attractiveness Analysis by Enterprise Size
  • Figure 87: East Asia Market Value Share and BPS Analysis by Industry Vertical, 2025 and 2035
  • Figure 88: East Asia Market Y to o to Y Growth Comparison by Industry Vertical, 2025-2035
  • Figure 89: East Asia Market Attractiveness Analysis by Industry Vertical
  • Figure 90: South Asia and Pacific Market Value Share and BPS Analysis by Country, 2025 and 2035
  • Figure 91: South Asia and Pacific Market Value Share and BPS Analysis by Component , 2025 and 2035
  • Figure 92: South Asia and Pacific Market Y to o to Y Growth Comparison by Component , 2025-2035
  • Figure 93: South Asia and Pacific Market Attractiveness Analysis by Component
  • Figure 94: South Asia and Pacific Market Value Share and BPS Analysis by Deployment Mode, 2025 and 2035
  • Figure 95: South Asia and Pacific Market Y to o to Y Growth Comparison by Deployment Mode, 2025-2035
  • Figure 96: South Asia and Pacific Market Attractiveness Analysis by Deployment Mode
  • Figure 97: South Asia and Pacific Market Value Share and BPS Analysis by Enterprise Size, 2025 and 2035
  • Figure 98: South Asia and Pacific Market Y to o to Y Growth Comparison by Enterprise Size, 2025-2035
  • Figure 99: South Asia and Pacific Market Attractiveness Analysis by Enterprise Size
  • Figure 100: South Asia and Pacific Market Value Share and BPS Analysis by Industry Vertical, 2025 and 2035
  • Figure 101: South Asia and Pacific Market Y to o to Y Growth Comparison by Industry Vertical, 2025-2035
  • Figure 102: South Asia and Pacific Market Attractiveness Analysis by Industry Vertical
  • Figure 103: Middle East & Africa Market Value Share and BPS Analysis by Country, 2025 and 2035
  • Figure 104: Middle East & Africa Market Value Share and BPS Analysis by Component , 2025 and 2035
  • Figure 105: Middle East & Africa Market Y to o to Y Growth Comparison by Component , 2025-2035
  • Figure 106: Middle East & Africa Market Attractiveness Analysis by Component
  • Figure 107: Middle East & Africa Market Value Share and BPS Analysis by Deployment Mode, 2025 and 2035
  • Figure 108: Middle East & Africa Market Y to o to Y Growth Comparison by Deployment Mode, 2025-2035
  • Figure 109: Middle East & Africa Market Attractiveness Analysis by Deployment Mode
  • Figure 110: Middle East & Africa Market Value Share and BPS Analysis by Enterprise Size, 2025 and 2035
  • Figure 111: Middle East & Africa Market Y to o to Y Growth Comparison by Enterprise Size, 2025-2035
  • Figure 112: Middle East & Africa Market Attractiveness Analysis by Enterprise Size
  • Figure 113: Middle East & Africa Market Value Share and BPS Analysis by Industry Vertical, 2025 and 2035
  • Figure 114: Middle East & Africa Market Y to o to Y Growth Comparison by Industry Vertical, 2025-2035
  • Figure 115: Middle East & Africa Market Attractiveness Analysis by Industry Vertical
  • Figure 116: Global Market - Tier Structure Analysis
  • Figure 117: Global Market - Company Share Analysis
Dashboard
Dashboard
Dashboard
Dashboard
Dashboard
Dashboard

Full Research Suite comprises of:

Market outlook & trends analysis

Market outlook & trends analysis

Interviews & case studies

Interviews & case studies

Strategic recommendations

Strategic recommendations

Vendor profiles & capabilities analysis

Vendor profiles & capabilities analysis

5-year forecasts

5-year forecasts

8 regions and 60+ country-level data splits

8 regions and 60+ country-level data splits

Market segment data splits

Market segment data splits

12 months of continuous data updates

12 months of continuous data updates

DELIVERED AS:

PDF EXCEL ONLINE

Full Research Suite


$5000

$7500

$10000

Buy Report Now
Similar Industry Reports

Similar Industry Reports

Decision Management Applications Market

Decision Management Applications Market Size and Share Forecast Outlook 2025 to 2035

Clinical Decision Support Systems Market

Clinical Decision Support Systems Market Size and Share Forecast Outlook 2025 to 2035

Clinical Decision Support App Market

Clinical Decision Support App Market – AI-Powered Insights 2034

General Intelligent Decision-Making Service Market

General Intelligent Decision-Making Service Market Size and Share Forecast Outlook 2025 to 2035

Intelligence Surveillance Reconnaissance (ISR) Market

Intelligence Surveillance Reconnaissance (ISR) Market Size and Share Forecast Outlook 2025 to 2035

Lead Intelligence Software Market

Lead Intelligence Software Market Size and Share Forecast Outlook 2025 to 2035

Sales Intelligence Software Market

Sales Intelligence Software Market Size and Share Forecast Outlook 2025 to 2035

Sales Intelligence Market

Sales Intelligence Market Size and Share Forecast Outlook 2025 to 2035

Energy Intelligence Solution Market

Energy Intelligence Solution Market - Growth & Forecast 2025 to 2035

Threat Intelligence Market

Threat Intelligence Market Trends – Growth & Forecast 2024-2034

Signals Intelligence (SIGINT) Market

Signals Intelligence (SIGINT) Market Size and Share Forecast Outlook 2025 to 2035

Content Intelligence Market

Content Intelligence – AI-Powered Insights for Marketers

Business Intelligence Market

Business Intelligence Market Size and Share Forecast Outlook 2025 to 2035

Location Intelligence Market

Location Intelligence Market Size and Share Forecast Outlook 2025 to 2035

Audience Intelligence Platform Market

Audience Intelligence Platform Market – Insights & Trends 2034

Embedded Intelligence Market

Embedded Intelligence Market Growth – Trends & Industry Forecast 2023-2033

Artificial Intelligence (chipset) Market

Artificial Intelligence (chipset) Market Forecast and Outlook 2025 to 2035

Artificial Intelligence in Construction Market

Artificial Intelligence in Construction Market Size and Share Forecast Outlook 2025 to 2035

Artificial Intelligence in Telecommunication Market

Artificial Intelligence in Telecommunication Market Size and Share Forecast Outlook 2025 to 2035

Artificial Intelligence in Retail Market

Artificial Intelligence in Retail Market Size and Share Forecast Outlook 2025 to 2035

Future Market Insights

Decision Intelligence Market

Chat With MaRIA

Chat With

MaRIA

Hi There, I am MaRIA, Your Market Research Intelligence Assistant. How may I help you?