The threat intelligence market is experiencing strong expansion due to the growing frequency of cyberattacks, increasing sophistication of digital threats, and rising awareness among enterprises regarding proactive security measures. The current market landscape is characterized by widespread adoption of advanced analytics, artificial intelligence, and machine learning tools that enhance threat detection and response capabilities. Organizations are increasingly prioritizing threat intelligence integration within their cybersecurity ecosystems to minimize vulnerabilities and ensure regulatory compliance.
The future outlook is defined by continued digital transformation across industries, expansion of connected devices, and growing investments in cloud-based security frameworks. Market growth is being reinforced by the need for real-time intelligence sharing, incident prediction, and automated response mechanisms.
Demand is also being fueled by geopolitical tensions and the emergence of state-sponsored cyber threats Collectively, these factors are expected to sustain market momentum and drive consistent revenue growth across global enterprise security infrastructures.

| Metric | Value |
|---|---|
| Threat Intelligence Market Estimated Value in (2025 E) | USD 13.3 billion |
| Threat Intelligence Market Forecast Value in (2035 F) | USD 53.9 billion |
| Forecast CAGR (2025 to 2035) | 15.0% |
The market is segmented by Component, Deployment Mode, and Industry and region. By Component, the market is divided into Solution and Services. In terms of Deployment Mode, the market is classified into Cloud-Based and On-Premises. Based on Industry, the market is segmented into BFSI, Government And Defense, IT And Telecom, Healthcare, Retail, Manufacturing, Education, and Others. Regionally, the market is classified into North America, Latin America, Western Europe, Eastern Europe, Balkan & Baltic Countries, Russia & Belarus, Central Asia, East Asia, South Asia & Pacific, and the Middle East & Africa.

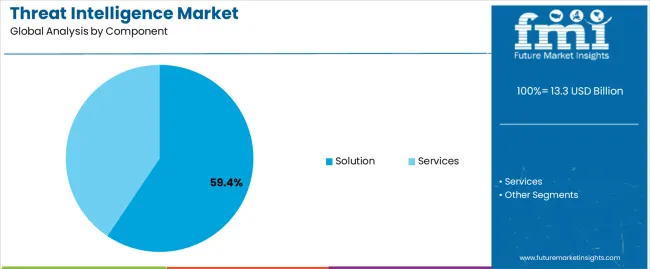
The solution segment, holding 59.4% of the component category, has been leading the market owing to its pivotal role in enabling organizations to analyze, interpret, and act on threat data effectively. Its dominance is driven by the increasing need for integrated platforms that consolidate multiple security feeds into actionable insights.
Solutions offering behavioral analytics, malware detection, and anomaly identification are gaining traction across enterprises of all sizes. The segment’s growth is supported by advancements in automation and predictive modeling, which reduce manual intervention and improve incident response time.
Continuous innovation and modular design have allowed vendors to tailor solutions to specific enterprise needs, further enhancing adoption rates As cybersecurity threats evolve in complexity, the demand for scalable and adaptive threat intelligence solutions is expected to remain robust, ensuring this segment retains its market leadership.

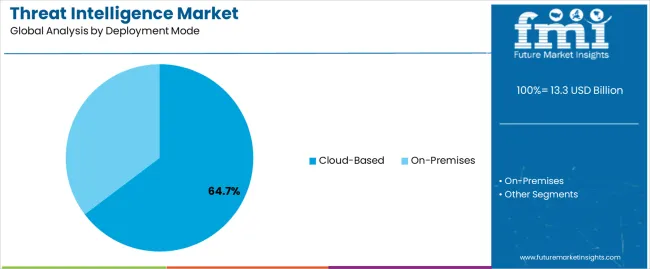
The cloud-based segment, accounting for 64.7% of the deployment mode category, has established dominance due to its scalability, cost efficiency, and rapid deployment capabilities. Enterprises are increasingly migrating to cloud environments to centralize threat data management and streamline cross-platform security operations.
Cloud-based solutions enable continuous updates and global threat intelligence sharing, providing organizations with enhanced situational awareness. The segment’s leadership is supported by growing adoption of remote work models and distributed IT infrastructures that require flexible and accessible security frameworks.
Vendors are investing in improving encryption, compliance, and multi-tenant architectures to address data security concerns associated with cloud adoption With enterprises prioritizing agility and lower total cost of ownership, cloud deployment is expected to sustain its position as the preferred mode for threat intelligence delivery.

The BFSI segment, representing 28.6% of the industry category, has emerged as the leading end-user due to the sector’s high exposure to financial fraud, phishing, and data breach attempts. Financial institutions are increasingly adopting advanced threat intelligence to monitor network anomalies, detect fraudulent transactions, and comply with stringent regulatory standards.
The segment’s growth is underpinned by rising digital banking adoption, expansion of online payment platforms, and the integration of fintech services, all of which necessitate heightened cybersecurity resilience. Continuous monitoring and predictive analytics capabilities are being deployed to mitigate operational risks and ensure customer trust.
Investment in specialized threat intelligence platforms is being prioritized to secure sensitive data and maintain compliance with evolving cybersecurity mandates The BFSI sector’s commitment to proactive defense strategies and regulatory-driven adoption is expected to maintain its leadership within the overall threat intelligence market.
AI and ML Integration Surges in the Market
Businesses are adopting AI and ML technology to improve threat intelligence skills in the highly competitive cybersecurity industry. Threat intelligence platforms are now more capable of swiftly analyzing massive data volumes using these advanced technologies, allowing businesses to promptly address new threats.
Businesses automating threat analysis and detection procedures can improve their cybersecurity operations, lower risks of data breaches and ensure business continuity. This can ultimately help businesses protect their brand image and boost consumer confidence in the growing digital era.
In February 2025, the new threat Intelligence platform from ServiceNow, Threat Intelligence Security Center (TISC), was successfully introduced in cGTM (Controlled Go-To-Market) mode. This is a big step forward for SOC teams in efficiently addressing threats.
Rising Geopolitical and Nation-state Threats Boost Investments in the Market
Businesses are becoming more vulnerable to challenges from nation-state and geopolitical opponents in the increasingly connected and geopolitically turbulent world. These innovative adversaries target government organizations, companies in various industries, and vital infrastructure using cutting-edge cyber tactics.
Organizations are adopting threat intelligence systems that offer actionable insights into potential geopolitical hazards, adversarial behavior, and new cyber threats to counter these nation-state and geopolitical concerns. Businesses can gain insight into the geopolitical factors influencing the threat landscape, foresee possible cyberattacks, and take proactive steps to fight against them by utilizing geopolitical threat information.
Capitalizing on this trend, in June 2025, Silobreaker, a security and threat intelligence startup, introduced new global threat intelligence capabilities called RANE (Risk Assistance Network + Exchange).
Silobreaker will include global risk intelligence provider RANE's enterprise geopolitical intelligence into its own platform, offering cyber threat intelligence teams with real-time knowledge of world events that may increase the danger of cyberattacks.
Development of Deepfake Detection Solutions Gains Traction in the Market
Companies and common individuals are becoming more aware of the operational and reputational threats associated deepfake technology. Businesses are therefore investing in advanced threat intelligence programs developed especially to discover and minimize the effects of distorted multimedia material.
These solutions offer businesses a proactive security and defense against deepfake threats using artificial intelligence and advanced algorithms. They also preserve customer trust and protect brand reputation. Furthermore, they prevent the possibility of reputational and financial harm caused by the spread of fake audio and video content.
| Attributes | Details |
|---|---|
| Trends |
|
| Opportunities |
|
| Challenges |
|
| Segment | Cloud-based (Deployment Mode) |
|---|---|
| Value Share (2025) | 62.80% |
Based on deployment mode, the cloud-based segment holds 62.80% of threat intelligence market shares in 2025.
| Segment | BFSI (Industry) |
|---|---|
| Value Share (2025) | 25.40% |
Based on industry, the BFSI segment captured 25.40% of threat intelligence market shares in 2025.
| Countries | Value CAGR (2025 to 2035) |
|---|---|
| United States | 11.90% |
| Germany | 10.50% |
| Japan | 9.80% |
| China | 15.60% |
| Australia | 18.60% |
The demand for threat intelligence in the United States is projected to rise at an 11.90% CAGR through 2035.
The threat intelligence market growth in Germany is estimated at a 10.50% CAGR through 2035.
The sales of threat intelligence in Japan are expected to rise at a 9.80% CAGR through 2035.
The demand for threat intelligence in China is predicted to surge at a 15.60% CAGR through 2035.
Threat intelligence sales in Australia are expected to rise at an 18.60% CAGR through 2035.

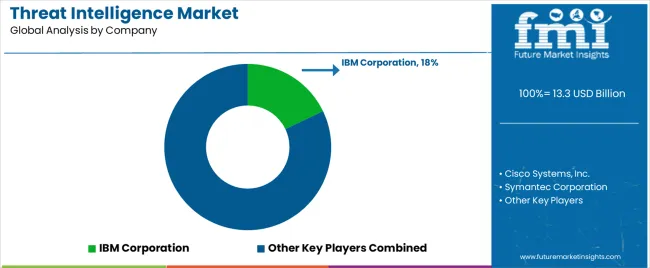
The threat intelligence market is highly competitive, driven by the increasing cybersecurity issues that enterprises confront worldwide. Established businesses like IBM Corporation, Cisco Systems, and Symantec Corporation contend for market dominance, thriving on their considerable industry expertise, robust technology solutions, and established client associations.
These firms focus on end-to-end threat intelligence solutions, including advanced threat identification, incident handling, and vulnerability management. This helps them to establish themselves as holistic cybersecurity partners.
Recent Developments
The global threat intelligence market is estimated to be valued at USD 13.3 billion in 2025.
The market size for the threat intelligence market is projected to reach USD 53.9 billion by 2035.
The threat intelligence market is expected to grow at a 15.0% CAGR between 2025 and 2035.
The key product types in threat intelligence market are solution, threat intelligence platforms, security information and event management, log management, security and vulnerability management, identity and access management, risk and compliance management, incident forensics, user and entity behavior analytics, services, advanced threat management managed service, professional managed services, professional training and support services and security intelligence feeds managed service.
In terms of deployment mode, cloud-based segment to command 64.7% share in the threat intelligence market in 2025.


Our Research Products

The "Full Research Suite" delivers actionable market intel, deep dives on markets or technologies, so clients act faster, cut risk, and unlock growth.

The Leaderboard benchmarks and ranks top vendors, classifying them as Established Leaders, Leading Challengers, or Disruptors & Challengers.

Locates where complements amplify value and substitutes erode it, forecasting net impact by horizon

We deliver granular, decision-grade intel: market sizing, 5-year forecasts, pricing, adoption, usage, revenue, and operational KPIs—plus competitor tracking, regulation, and value chains—across 60 countries broadly.

Spot the shifts before they hit your P&L. We track inflection points, adoption curves, pricing moves, and ecosystem plays to show where demand is heading, why it is changing, and what to do next across high-growth markets and disruptive tech

Real-time reads of user behavior. We track shifting priorities, perceptions of today’s and next-gen services, and provider experience, then pace how fast tech moves from trial to adoption, blending buyer, consumer, and channel inputs with social signals (#WhySwitch, #UX).

Partner with our analyst team to build a custom report designed around your business priorities. From analysing market trends to assessing competitors or crafting bespoke datasets, we tailor insights to your needs.
Supplier Intelligence
Discovery & Profiling
Capacity & Footprint
Performance & Risk
Compliance & Governance
Commercial Readiness
Who Supplies Whom
Scorecards & Shortlists
Playbooks & Docs
Category Intelligence
Definition & Scope
Demand & Use Cases
Cost Drivers
Market Structure
Supply Chain Map
Trade & Policy
Operating Norms
Deliverables
Buyer Intelligence
Account Basics
Spend & Scope
Procurement Model
Vendor Requirements
Terms & Policies
Entry Strategy
Pain Points & Triggers
Outputs
Pricing Analysis
Benchmarks
Trends
Should-Cost
Indexation
Landed Cost
Commercial Terms
Deliverables
Brand Analysis
Positioning & Value Prop
Share & Presence
Customer Evidence
Go-to-Market
Digital & Reputation
Compliance & Trust
KPIs & Gaps
Outputs
Full Research Suite comprises of:
Market outlook & trends analysis
Interviews & case studies
Strategic recommendations
Vendor profiles & capabilities analysis
5-year forecasts
8 regions and 60+ country-level data splits
Market segment data splits
12 months of continuous data updates
DELIVERED AS:
PDF EXCEL ONLINE
Threat Hunting Market Size and Share Forecast Outlook 2025 to 2035
Threat Detection Systems Market
Mobile Threat Management Security Software Market Size and Share Forecast Outlook 2025 to 2035
Insider Threat Protection Market Analysis Size and Share Forecast Outlook 2025 to 2035
Specialized Threat Analysis And Protection Market
Advanced Persistent Threat Protection Market
Intelligence Surveillance Reconnaissance (ISR) Market Size and Share Forecast Outlook 2025 to 2035
Lead Intelligence Software Market Size and Share Forecast Outlook 2025 to 2035
Sales Intelligence Software Market Size and Share Forecast Outlook 2025 to 2035
Sales Intelligence Market Size and Share Forecast Outlook 2025 to 2035
Energy Intelligence Solution Market - Growth & Forecast 2025 to 2035
Signals Intelligence (SIGINT) Market Size and Share Forecast Outlook 2025 to 2035
Content Intelligence – AI-Powered Insights for Marketers
Audience Intelligence Platform Market Size and Share Forecast Outlook 2025 to 2035
Decision Intelligence Market Forecast and Outlook 2025 to 2035
Business Intelligence Market Size and Share Forecast Outlook 2025 to 2035
Location Intelligence Market Size and Share Forecast Outlook 2025 to 2035
Embedded Intelligence Market Growth – Trends & Industry Forecast 2023-2033
Artificial Intelligence (chipset) Market Forecast and Outlook 2025 to 2035
Artificial Intelligence in Construction Market Size and Share Forecast Outlook 2025 to 2035

Thank you!
You will receive an email from our Business Development Manager. Please be sure to check your SPAM/JUNK folder too.
Chat With
MaRIA