Reports

- Global Locations -

Headquarters

Future Market Insights, Inc.

Christiana Corporate, 200
Continental Drive, Suite 401,
Newark, Delaware - 19713,
United States

T: +1-845-579-5705

Americas

Future Market Insights, Inc.

616 Corporate Way, Suite 2-9018,
Valley Cottage, NY 10989, United States

T: +1-347-918-3531

MEA

Future Market Insights

1602-6 Jumeirah Bay X2 Tower, Plot No: JLT-PH2-X2A,
Jumeirah Lakes Towers, Dubai,
United Arab Emirates

Europe

Future Market Insights

3rd Floor, 207 Regent Street,
W1B 3HH London
United Kingdom

T: + 44 (0) 20 8123 9659
D: +44 (0) 20 3287 4268

Asia Pacific

Future Market Insights

IndiaLand Global Tech Park, Unit UG-1, Behind Grand HighStreet, Phase 1, Hinjawadi, MH, Pune – 411057, India

Threat Hunting Market Outlook (2023 to 2033)

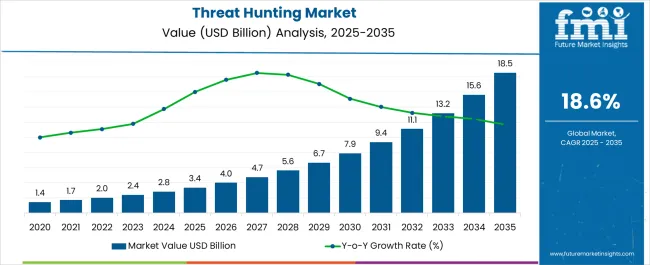
The global threat-hunting market revenue totalled US$ 2,395.0 million in 2023. However, with the rising adoption of advanced cyber-security software and services across various industries, the overall market is expected to grow at a staggering CAGR of 18.6% between 2023 and 2033, reaching a valuation of around US$ 13,224.2 million by 2033.

Currently, the threat-hunting market accounts for around 15.0% of the global threat intelligence market. Rising focus on improving safety across industries like BFSI, telecom & IT, healthcare, and manufacturing is a key factor driving demand for threat-hunting solutions in the market.

Cyber threat hunting is exactly opposite to traditional threat management measures like intrusion detection systems (IDS), firewalls, security information, and event management (SIEM) systems, and malware sandbox (computer security) which specifically involve an assessment of evidence-based data after a warning of a potential threat to organizations.

Threat-hunting software such as endpoint detection & response (EDR), network threat analytics, and others help enterprises protect their systems from misuse or unauthorized access.

The adoption of this advanced security tool enables businesses to proactively search through networks for detecting and isolating advanced threats that evade existing security solutions.

MSPs (Managed Service Providers) have unique advantages in threat hunting. Managed security services and managed detection and response (MDR) offer a wide range of security services, including vulnerability scanning, security monitoring, investigation, digital forensics, and incident response (DFIR). However, as the customers of these organizations become more security savvy, they are consistently demanding more advanced security services to ensure they are as protected as possible.

Threat hunting is one of these critical advanced security services. While MSSP and MDR organizations may encounter certain specific threat-hunting issues, their business model provides them with distinct benefits that can enable more effective and efficient threat-hunting.

Attribute Key Statistics
Threat Hunting Market Estimated Size (2023) US$ 2,047.0 Million
Projected Market Valuation (2033) US$ 13,224.2 million
Value-based CAGR (2023 to 2033) 18.6%

Don't pay for what you don't need

Customize your report by selecting specific countries or regions and save 30%!

2018 to 2022 Threat Hunting Demand Outlook Compared to 2023 to 2033 Forecast

The threat-hunting market is anticipated to grow at 18.6% CAGR between 2023 and 2033 in comparison to the 13.4% CAGR registered between 2018 and 2022. This is attributable to the rising adoption of threat-hunting solutions as well as services among small and mid-sized enterprises (SMEs) as well as large enterprises across the globe.

Cyber hunting is an approach to internet security in which threat hunters look for security risks hidden within a concealed company’s network. The global market is anticipated to witness an increase in revenue from US$ 2,047.0 Million in 2023 to US$ 13,224.2 million by 2033.

By enterprise size, the SME segment is expected to grow at the highest CAGR of 20.7% during the forecasted period. Moreover, by solution segment, the services segment is expected to grow at the highest CAGR of 19.8% from 2023 to 2033.

Regionally, North America is expected to dominate the global threat-hunting market, reaching a market valuation of around US$ 2,969.2 Million by 2033. South Asia & Pacific market on the other hand is anticipated to grow at the highest CAGR of 22.5% from 2023 to 2033.

What are the Key Trends Driving the Global Threat Hunting Market?

The proliferation of Work from Home Push Demand for Threat-Hunting Solutions

In recent years, the traditional work from the office has shifted towards always-on remote or hybrid working. This has made organizations susceptible to cyber-attacks. As per Verizon Mobile Security Index (MSI) 2023, the new world of hybrid work that has resulted from the widespread shift to remote work has seen security teams facing an uphill struggle as the number of devices and remote employees grows.

According to the report around 79% of organizations agreed that remote working had adversely affected their cybersecurity and increased the burden on security teams. Furthermore, almost nine out of ten retail organizations (88%) were concerned that a mobile security compromise may harm their brand or client loyalty.

The report also stated that more than nine out of ten (93%) executives in financial services said cyber thieves considered their industry as a more valuable target than other businesses.

Increasing cyber threats to such industries are expected to drive the demand for threat-hunting solutions, during the forecast period.
Sudip Saha
Sudip Saha

Principal Consultant

Talk to Analyst

Find your sweet spots for generating winning opportunities in this market.

Country-wise Insights

How Will Growth Unfold in the United States Threat Hunting Market?

Strong Presence of Leading Threat-Hunting Providers Driving Growth

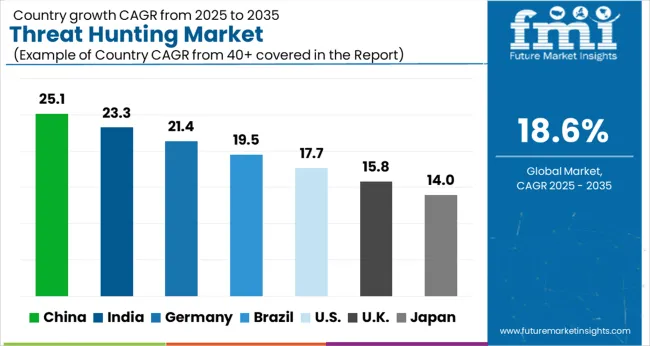
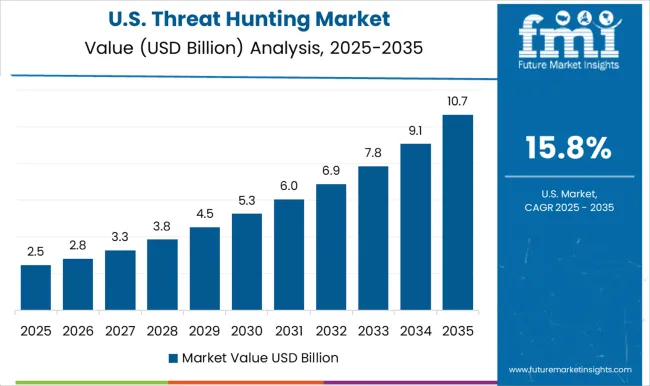
The USA threat-hunting market is projected to exhibit a prolific CAGR of over 15.2% during the forecast period of 2023 and 2033, totalling a valuation of around US$ 574.3 Million in 2023.

Rising adoption of advanced cybersecurity solutions across industries, the surge in cyber-attack rates, favourable government support, and the presence of some of the leading cybersecurity giants are driving growth in the United States market.

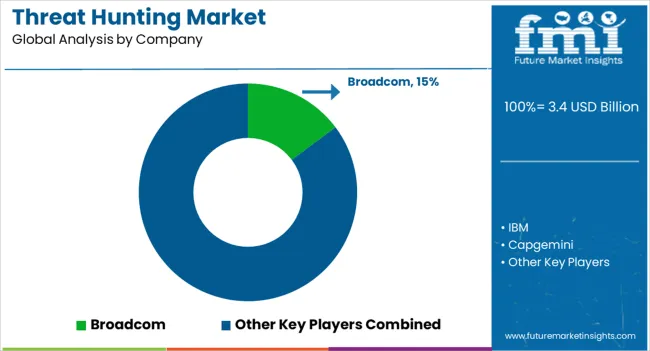
The United States has many key cyber hunting solutions or service providers such as Broadcom, IBM, Symantec, CrowdStrike, and others. The presence of such key cyber-hunting solution providers will continue to boost the market growth in the country during the forecast period.

What is the Demand Outlook for Threat Hunting Market in Germany?

Increasing Government Efforts to Reduce Cyber-Attacks Pushing Demand for Cyber Hunting Solutions

As per FMI, the threat-hunting market in Germany is expected to grow at a stupendous CAGR of 21.4% during the forecast period from 2023 and 2033, creating an absolute dollar opportunity of US$ 372.4 Million by 2033.

According to Germany's banking regulator, the federal financial supervisory authority (BaFin) issued a new cyber security warning to the country's financial industry. Thus, government stringent rules and regulation toward cyber threat in Germany is expected to drive the demand for cyber hunting solutions in the country during the forecast period.

Why is the Demand for Threat Hunting Increasing in India?

Rapid Rise in Cyber-Attacks Prompting Organizations to Use Advanced Cyber Hunting Solutions

As per FMI, the threat-hunting market in India is set to grow at the highest CAGR of 24.7% between 2023 and 2033, creating an absolute dollar opportunity of US$ 533.0 million by the end of 2033.

The rapid expansion of end-use industries such as BFSI and telecom & IT, the surge in cyber-attacks, and the rising penetration of both local and regional threat-hunting service providers are driving demand for cyber-hunting solutions across India.

As per Lok Sabha, there have been around 674,021 cyber-attacks in the country in 2022, making India the third most impacted by network attacks in the world. The Indian government has taken different steps to improve cyber security and prevent cyber-attacks, including regularly publishing alerts and advisories on the newest vulnerabilities and cyber threats, as well as remedies to safeguard computers and networks.

Category-wise Insights

Which Solution Will Generate the Most Revenues in the Global Market?

Demand to Remain High for Threat Hunting Services in the Market

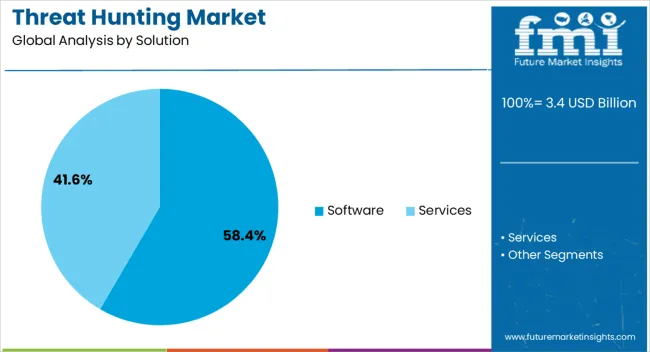
Based on the solution, the software segment will continue to dominate the global market during the forecast period. FMI predicts the software segment to grow by 5.0X through 2033.

However, the services segment is set to register the highest growth at the rate of 19.8% CAGR from 2023 to 2033. This can be attributed to the rising adoption of cyber-hunting services by small, medium, and large enterprises.

Cyber hunting services offer benefits of cyber hunting including uncovering security incidents, improving the speed of threat response, and reducing the investigation time. Besides this, they support cybersecurity analysts in understanding the company and help to achieve appropriate mitigation of cyber threats to improve defence systems and many more. Thus, the adoption of cyber hunting services is expected to grow in the upcoming period.

Which Enterprise Segment Leads the Global Threat Hunting Market?

Most of the Cyber Hunting Demand emerges from SMEs

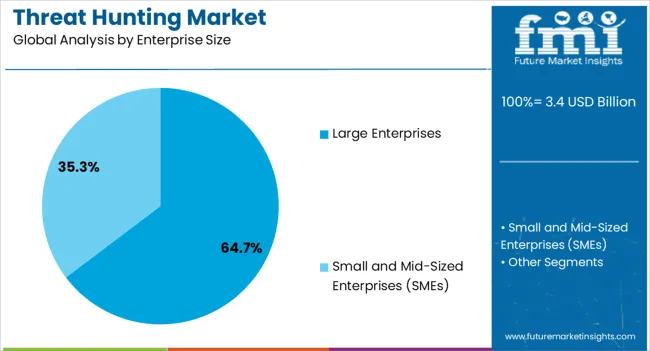
Based on enterprise size, the large enterprise segment is anticipated to expand up to 4.8X during the forecast period of 2023 to 2033. However, the SME segment is set to register the highest growth rate of 20.7% from 2023 to 2033.

Cyber-attacks on SMEs are becoming more targeted, frequent, and complex. As per the annual cost of cybercrime study by Accenture, 43% of cyber-attacks are aimed at SMEs, but hardly 14% of them can defend themselves. Thus, the demand for the threat-hunting solution is expected to increase in SMEs in the forthcoming period.

Why does BFSI Segment Exhibit High Demand for Threat Hunting Solutions?

BFSI to Remain Lucrative End-Use Industry for Threat Hunting Solutions

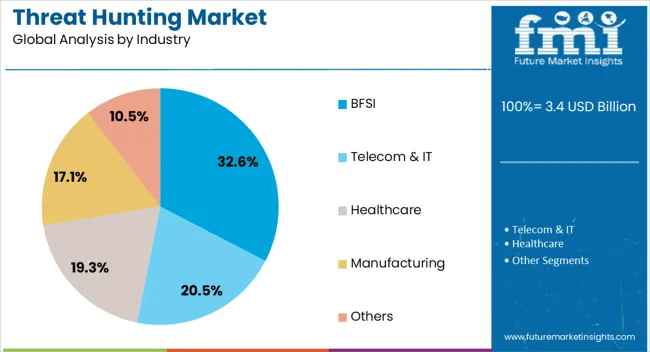
Based on the industry, the BFSI segment will be a dominating segment. The market size of the BFSI segment is anticipated to expand up to 5.1X from 2023 to 2033. This can be attributed to the rising adoption of advanced security solutions by banks and financial companies.

Financial institutions and banks all around the world have been quick to adopt advanced technology. Rapid bank digitization encourages cyber risks and has resulted in a variety of cyber threats/risks. According to VMware Carbon Black, cyberattacks on financial institutions and banks have surged globally. As a result, it is likely to drive demand for cyber threat hunting in the BFSI business over time.
Get the data you need at a Fraction of the cost

Personalize your report by choosing insights you need
and save 40%!

Competitive Landscape

Many key players in the global market are focusing heavily on innovation, research, and development practices to provide a variety of solutions for various industry applications. They are pursuing various strategies such as partnerships, collaborations, and acquisitions to increase their presence, customer base, and solution offering. For instance,

  • In July 2022, IBM provided a threat-hunting tool (Kestrel) to Open Cybersecurity Alliance. IBM Security and IBM Research jointly develop Kestrel which enables threat hunters to express hunts in an open, composable threat-hunting language
  • In January 2019, Symantec launched advanced EDR tools and a fully managed service to counter the most dangerous cyber threats. Symantec's MEDR solution leverages EDR 4.0's capabilities to improve threat hunting, incident response, and forensics, arming teams with investigative knowledge and threat information from a world-class team of Symantec SOC analysts.

Capgemini, Kaspersky Lab, and Cybereason - Helping Organizations to Improve Cybersecurity

Capgemini, Kaspersky Lab, and Cybereason are the top three pioneers in the field of threat hunting. Capgemini has been a top strategic partner to businesses throughout the world for more than 50 years. The Ethisphere Institute has recognized Capgemini as one of the World's Most Ethical Companies for ten years in a row.

The company leverages cloud, data, AI, connectivity, software, digital engineering, and platforms to address the entire breadth of business needs. To defend today's digital organization, cybersecurity tools are insufficient on their own. Because of this, Capgemini's cyber hunting solution combines automated collecting and in-depth human analysis in a novel way.

Kaspersky Lab has emerged as a leading provider of cyber hunting services. The Kaspersky Managed Protection service provides complete managed services for users of the Kaspersky Endpoint Security and Kaspersky Anti-Targeted Attack Platform, using a distinctive set of cutting-edge technical methods to identify and stop targeted assaults on your business. The service comprises round-the-clock professional monitoring by Kaspersky researchers and ongoing threat data analysis, guaranteeing the real-time identification of both well-known and emerging cyberespionage and cybercriminal campaigns aimed at key information systems.

To assure the genuine protection of the company's assets, Kaspersky specialists provide a proactive solution called Targeted Attack Discovery. The findings of a targeted attack discovery will enable it to locate current cybercrime and cyberespionage activity within a company’s network, comprehend the causes and potential origins of these occurrences, and successfully design mitigation measures to help prevent similar assaults in the future.

The latest stats released by the company revealed that around 687 Million cyber-attacks were stopped during the last year. The company is focused on developing advanced cybersecurity solutions to help organizations to improve their security. For instance, in March 2022, Kaspersky launched a new threat-hunting service (known as Kaspersky Threat Hunting) that enables the timely detection of adversarial activities.

Similarly, in August 2023, Kaspersky and Microsoft partnered to deliver threat intelligence to Microsoft Sentinel users.

Another key player is Cybereason, developer of the world’s first and only end-to-end threat-hunting solution. The Cybereason Defense Platform allows defenders to actively seek out the enemy and find even the most cunning threats. The Cybereason Defense Platform is the hub for contextual correlations, threat information, and in-depth threat hunting needed to uncover the most complex threats and guarantee a proactive security posture.

The company recently (December 2018) launched the newest version of its award-winning threat-hunting solution which includes Attack Tree, Custom Detection Rules, Mitre ATT&CK Matrix, and Remote Shell Utility.

Scope of Report

Attribute Details
Market Value in 2023 US$ 2,047.0 Million
Projected Market Valuation (2033) US$ 13,224.2 million
Market CAGR 2023 to 2033 18.6%
Share of top 5 players Around 35%
Forecast Period 2023 to 2033
Historical Data Available for 2018 to 2022
Market Analysis US$ Million for Value
Key Regions Covered North America, Latin America, Europe, East Asia, South Asia & Pacific, and the Middle East & Africa
Key Countries Covered USA, Canada, Germany, United Kingdom, France, Italy, Spain, BENELUX, Russia, China, Japan, South Korea, India, Malaysia, Indonesia, Singapore, Australia & New Zealand, GCC Countries, Turkey, and South Africa
Key Segments Covered The solution, Enterprise Size, Industry, and Region
Key Companies Profiled
  • Broadcom
  • IBM
  • Capgemini
  • Kaspersky Lab
  • Symantec
  • Carbon Black
  • Clear network
  • CyberDefenses
  • Cybereason
  • Delta Risk
  • Ingalls Information Security
  • IronNet Cybersecurity
  • Paladion
  • Redscan
Report Coverage Market Forecast, Company Share Analysis, Competition Intelligence, Drivers, Restraints, Opportunities and Threats Analysis, Market Dynamics and Challenges, and Strategic Growth Initiatives

Threat Hunting Outlook by Category

By Solution:

  • Software
    • Endpoint Detection & Response (EDR)
    • Security Information and Event Management (SIEM)
    • Network Threat Analytics
    • Others
  • Services
    • Threat Hunting Services
    • Security Consulting
    • Integration & Implementation
    • Support Services

By Enterprise Size:

  • Small and Mid-Sized Enterprises (SMEs)
  • Large Enterprises

By Industry:

  • BFSI
  • Telecom & IT
  • Healthcare
  • Manufacturing
  • Others

By Region:

  • North America
  • Latin America
  • Europe
  • East Asia
  • South Asia & Pacific
  • Middle East and Africa (MEA)

Frequently Asked Questions

What is the current size of the global threat-hunting market?

As of 2023, the global threat-hunting market has a market size of US$ 2,395.0 million.

What will be the demand outlook for the threat-hunting market through 2033?

The demand outlook for the threat-hunting market through 2033 is US$ 13,224.2 million.

Who are the leading companies offering threat-hunting solutions?

Some leading companies offering threat-hunting solutions are: • Broadcom • IBM • Capgemini • Kaspersky Lab • Symantec

What is the current Market Value?

The market is expected to reach US$ 2,047 million in 2023.

What is the projected market size for Threat Hunting by 2033?

Demand is set to reach US$ 13,224.2 million by 2033.

Which are the top Companies expanding their Markets?

IBM, Capgemini, Kaspersky Lab, and Symantec are the top companies in the market.

Which End-use Segment will Exhibit High demand?

BFSI is expected to grow 5.1x by 2033.

What is the Projected CAGR for the South Asia & Pacific Market?

By 2033, the South Asia & Pacific market is likely to exhibit a 22.5% CAGR.

Table of Content

1. Executive Summary

    1.1. Global Market Outlook

    1.2. Demand-side Trends

    1.3. Supply-side Trends

    1.4. Technology Roadmap Analysis

    1.5. Analysis and Recommendations

2. Market Overview

    2.1. Market Coverage / Taxonomy

    2.2. Market Definition / Scope / Limitations

3. Market Background

    3.1. Market Dynamics

        3.1.1. Drivers

        3.1.2. Restraints

        3.1.3. Opportunity

        3.1.4. Trends

    3.2. Scenario Forecast

        3.2.1. Demand in Optimistic Scenario

        3.2.2. Demand in Likely Scenario

        3.2.3. Demand in Conservative Scenario

    3.3. Opportunity Map Analysis

    3.4. Investment Feasibility Matrix

    3.5. PESTLE and Porter’s Analysis

    3.6. Regulatory Landscape

        3.6.1. By Key Regions

        3.6.2. By Key Countries

    3.7. Regional Parent Market Outlook

4. Global Market Analysis 2018 to 2022 and Forecast, 2023 to 2033

    4.1. Historical Market Size Value (US$ Million) Analysis, 2018 to 2022

    4.2. Current and Future Market Size Value (US$ Million) Projections, 2023 to 2033

        4.2.1. Y-o-Y Growth Trend Analysis

        4.2.2. Absolute $ Opportunity Analysis

5. Global Market Analysis 2018 to 2022 and Forecast 2023 to 2033, By Solution

    5.1. Introduction / Key Findings

    5.2. Historical Market Size Value (US$ Million) Analysis By Solution, 2018 to 2022

    5.3. Current and Future Market Size Value (US$ Million) Analysis and Forecast By Solution, 2023 to 2033

        5.3.1. Software

            5.3.1.1. Endpoint Detection & Response (EDR)

            5.3.1.2. Security Information and Event Management (SIEM)

            5.3.1.3. Network Threat Analytics

            5.3.1.4. Others

        5.3.2. Services

            5.3.2.1. Services

            5.3.2.2. Security Consulting

            5.3.2.3. Integration & Implementation

            5.3.2.4. Support Services

    5.4. Y-o-Y Growth Trend Analysis By Solution, 2018 to 2022

    5.5. Absolute $ Opportunity Analysis By Solution, 2023 to 2033

6. Global Market Analysis 2018 to 2022 and Forecast 2023 to 2033, By Enterprise Size

    6.1. Introduction / Key Findings

    6.2. Historical Market Size Value (US$ Million) Analysis By Enterprise Size, 2018 to 2022

    6.3. Current and Future Market Size Value (US$ Million) Analysis and Forecast By Enterprise Size, 2023 to 2033

        6.3.1. Small and Mid-Sized Enterprises (SMEs)

        6.3.2. Large Enterprises

    6.4. Y-o-Y Growth Trend Analysis By Enterprise Size, 2018 to 2022

    6.5. Absolute $ Opportunity Analysis By Enterprise Size, 2023 to 2033

7. Global Market Analysis 2018 to 2022 and Forecast 2023 to 2033, By Industry

    7.1. Introduction / Key Findings

    7.2. Historical Market Size Value (US$ Million) Analysis By Industry , 2018 to 2022

    7.3. Current and Future Market Size Value (US$ Million) Analysis and Forecast By Industry , 2023 to 2033

        7.3.1. BFSI

        7.3.2. Telecom & IT

        7.3.3. Healthcare

        7.3.4. Manufacturing

        7.3.5. Others

    7.4. Y-o-Y Growth Trend Analysis By Industry , 2018 to 2022

    7.5. Absolute $ Opportunity Analysis By Industry , 2023 to 2033

8. Global Market Analysis 2018 to 2022 and Forecast 2023 to 2033, By Region

    8.1. Introduction

    8.2. Historical Market Size Value (US$ Million) Analysis By Region, 2018 to 2022

    8.3. Current Market Size Value (US$ Million) Analysis and Forecast By Region, 2023 to 2033

        8.3.1. North America

        8.3.2. Latin America

        8.3.3. Western Europe

        8.3.4. Eastern Europe

        8.3.5. South Asia and Pacific

        8.3.6. East Asia

        8.3.7. Middle East and Africa

    8.4. Market Attractiveness Analysis By Region

9. North America Market Analysis 2018 to 2022 and Forecast 2023 to 2033, By Country

    9.1. Historical Market Size Value (US$ Million) Trend Analysis By Market Taxonomy, 2018 to 2022

    9.2. Market Size Value (US$ Million) Forecast By Market Taxonomy, 2023 to 2033

        9.2.1. By Country

            9.2.1.1. USA

            9.2.1.2. Canada

        9.2.2. By Solution

        9.2.3. By Enterprise Size

        9.2.4. By Industry

    9.3. Market Attractiveness Analysis

        9.3.1. By Country

        9.3.2. By Solution

        9.3.3. By Enterprise Size

        9.3.4. By Industry

    9.4. Key Takeaways

10. Latin America Market Analysis 2018 to 2022 and Forecast 2023 to 2033, By Country

    10.1. Historical Market Size Value (US$ Million) Trend Analysis By Market Taxonomy, 2018 to 2022

    10.2. Market Size Value (US$ Million) Forecast By Market Taxonomy, 2023 to 2033

        10.2.1. By Country

            10.2.1.1. Brazil

            10.2.1.2. Mexico

            10.2.1.3. Rest of Latin America

        10.2.2. By Solution

        10.2.3. By Enterprise Size

        10.2.4. By Industry

    10.3. Market Attractiveness Analysis

        10.3.1. By Country

        10.3.2. By Solution

        10.3.3. By Enterprise Size

        10.3.4. By Industry

    10.4. Key Takeaways

11. Western Europe Market Analysis 2018 to 2022 and Forecast 2023 to 2033, By Country

    11.1. Historical Market Size Value (US$ Million) Trend Analysis By Market Taxonomy, 2018 to 2022

    11.2. Market Size Value (US$ Million) Forecast By Market Taxonomy, 2023 to 2033

        11.2.1. By Country

            11.2.1.1. Germany

            11.2.1.2. UK

            11.2.1.3. France

            11.2.1.4. Spain

            11.2.1.5. Italy

            11.2.1.6. Rest of Western Europe

        11.2.2. By Solution

        11.2.3. By Enterprise Size

        11.2.4. By Industry

    11.3. Market Attractiveness Analysis

        11.3.1. By Country

        11.3.2. By Solution

        11.3.3. By Enterprise Size

        11.3.4. By Industry

    11.4. Key Takeaways

12. Eastern Europe Market Analysis 2018 to 2022 and Forecast 2023 to 2033, By Country

    12.1. Historical Market Size Value (US$ Million) Trend Analysis By Market Taxonomy, 2018 to 2022

    12.2. Market Size Value (US$ Million) Forecast By Market Taxonomy, 2023 to 2033

        12.2.1. By Country

            12.2.1.1. Poland

            12.2.1.2. Russia

            12.2.1.3. Czech Republic

            12.2.1.4. Romania

            12.2.1.5. Rest of Eastern Europe

        12.2.2. By Solution

        12.2.3. By Enterprise Size

        12.2.4. By Industry

    12.3. Market Attractiveness Analysis

        12.3.1. By Country

        12.3.2. By Solution

        12.3.3. By Enterprise Size

        12.3.4. By Industry

    12.4. Key Takeaways

13. South Asia and Pacific Market Analysis 2018 to 2022 and Forecast 2023 to 2033, By Country

    13.1. Historical Market Size Value (US$ Million) Trend Analysis By Market Taxonomy, 2018 to 2022

    13.2. Market Size Value (US$ Million) Forecast By Market Taxonomy, 2023 to 2033

        13.2.1. By Country

            13.2.1.1. India

            13.2.1.2. Bangladesh

            13.2.1.3. Australia

            13.2.1.4. New Zealand

            13.2.1.5. Rest of South Asia and Pacific

        13.2.2. By Solution

        13.2.3. By Enterprise Size

        13.2.4. By Industry

    13.3. Market Attractiveness Analysis

        13.3.1. By Country

        13.3.2. By Solution

        13.3.3. By Enterprise Size

        13.3.4. By Industry

    13.4. Key Takeaways

14. East Asia Market Analysis 2018 to 2022 and Forecast 2023 to 2033, By Country

    14.1. Historical Market Size Value (US$ Million) Trend Analysis By Market Taxonomy, 2018 to 2022

    14.2. Market Size Value (US$ Million) Forecast By Market Taxonomy, 2023 to 2033

        14.2.1. By Country

            14.2.1.1. China

            14.2.1.2. Japan

            14.2.1.3. South Korea

        14.2.2. By Solution

        14.2.3. By Enterprise Size

        14.2.4. By Industry

    14.3. Market Attractiveness Analysis

        14.3.1. By Country

        14.3.2. By Solution

        14.3.3. By Enterprise Size

        14.3.4. By Industry

    14.4. Key Takeaways

15. Middle East and Africa Market Analysis 2018 to 2022 and Forecast 2023 to 2033, By Country

    15.1. Historical Market Size Value (US$ Million) Trend Analysis By Market Taxonomy, 2018 to 2022

    15.2. Market Size Value (US$ Million) Forecast By Market Taxonomy, 2023 to 2033

        15.2.1. By Country

            15.2.1.1. GCC Countries

            15.2.1.2. South Africa

            15.2.1.3. Israel

            15.2.1.4. Rest of MEA

        15.2.2. By Solution

        15.2.3. By Enterprise Size

        15.2.4. By Industry

    15.3. Market Attractiveness Analysis

        15.3.1. By Country

        15.3.2. By Solution

        15.3.3. By Enterprise Size

        15.3.4. By Industry

    15.4. Key Takeaways

16. Key Countries Market Analysis

    16.1. USA

        16.1.1. Pricing Analysis

        16.1.2. Market Share Analysis, 2022

            16.1.2.1. By Solution

            16.1.2.2. By Enterprise Size

            16.1.2.3. By Industry

    16.2. Canada

        16.2.1. Pricing Analysis

        16.2.2. Market Share Analysis, 2022

            16.2.2.1. By Solution

            16.2.2.2. By Enterprise Size

            16.2.2.3. By Industry

    16.3. Brazil

        16.3.1. Pricing Analysis

        16.3.2. Market Share Analysis, 2022

            16.3.2.1. By Solution

            16.3.2.2. By Enterprise Size

            16.3.2.3. By Industry

    16.4. Mexico

        16.4.1. Pricing Analysis

        16.4.2. Market Share Analysis, 2022

            16.4.2.1. By Solution

            16.4.2.2. By Enterprise Size

            16.4.2.3. By Industry

    16.5. Germany

        16.5.1. Pricing Analysis

        16.5.2. Market Share Analysis, 2022

            16.5.2.1. By Solution

            16.5.2.2. By Enterprise Size

            16.5.2.3. By Industry

    16.6. UK

        16.6.1. Pricing Analysis

        16.6.2. Market Share Analysis, 2022

            16.6.2.1. By Solution

            16.6.2.2. By Enterprise Size

            16.6.2.3. By Industry

    16.7. France

        16.7.1. Pricing Analysis

        16.7.2. Market Share Analysis, 2022

            16.7.2.1. By Solution

            16.7.2.2. By Enterprise Size

            16.7.2.3. By Industry

    16.8. Spain

        16.8.1. Pricing Analysis

        16.8.2. Market Share Analysis, 2022

            16.8.2.1. By Solution

            16.8.2.2. By Enterprise Size

            16.8.2.3. By Industry

    16.9. Italy

        16.9.1. Pricing Analysis

        16.9.2. Market Share Analysis, 2022

            16.9.2.1. By Solution

            16.9.2.2. By Enterprise Size

            16.9.2.3. By Industry

    16.10. Poland

        16.10.1. Pricing Analysis

        16.10.2. Market Share Analysis, 2022

            16.10.2.1. By Solution

            16.10.2.2. By Enterprise Size

            16.10.2.3. By Industry

    16.11. Russia

        16.11.1. Pricing Analysis

        16.11.2. Market Share Analysis, 2022

            16.11.2.1. By Solution

            16.11.2.2. By Enterprise Size

            16.11.2.3. By Industry

    16.12. Czech Republic

        16.12.1. Pricing Analysis

        16.12.2. Market Share Analysis, 2022

            16.12.2.1. By Solution

            16.12.2.2. By Enterprise Size

            16.12.2.3. By Industry

    16.13. Romania

        16.13.1. Pricing Analysis

        16.13.2. Market Share Analysis, 2022

            16.13.2.1. By Solution

            16.13.2.2. By Enterprise Size

            16.13.2.3. By Industry

    16.14. India

        16.14.1. Pricing Analysis

        16.14.2. Market Share Analysis, 2022

            16.14.2.1. By Solution

            16.14.2.2. By Enterprise Size

            16.14.2.3. By Industry

    16.15. Bangladesh

        16.15.1. Pricing Analysis

        16.15.2. Market Share Analysis, 2022

            16.15.2.1. By Solution

            16.15.2.2. By Enterprise Size

            16.15.2.3. By Industry

    16.16. Australia

        16.16.1. Pricing Analysis

        16.16.2. Market Share Analysis, 2022

            16.16.2.1. By Solution

            16.16.2.2. By Enterprise Size

            16.16.2.3. By Industry

    16.17. New Zealand

        16.17.1. Pricing Analysis

        16.17.2. Market Share Analysis, 2022

            16.17.2.1. By Solution

            16.17.2.2. By Enterprise Size

            16.17.2.3. By Industry

    16.18. China

        16.18.1. Pricing Analysis

        16.18.2. Market Share Analysis, 2022

            16.18.2.1. By Solution

            16.18.2.2. By Enterprise Size

            16.18.2.3. By Industry

    16.19. Japan

        16.19.1. Pricing Analysis

        16.19.2. Market Share Analysis, 2022

            16.19.2.1. By Solution

            16.19.2.2. By Enterprise Size

            16.19.2.3. By Industry

    16.20. South Korea

        16.20.1. Pricing Analysis

        16.20.2. Market Share Analysis, 2022

            16.20.2.1. By Solution

            16.20.2.2. By Enterprise Size

            16.20.2.3. By Industry

    16.21. GCC Countries

        16.21.1. Pricing Analysis

        16.21.2. Market Share Analysis, 2022

            16.21.2.1. By Solution

            16.21.2.2. By Enterprise Size

            16.21.2.3. By Industry

    16.22. South Africa

        16.22.1. Pricing Analysis

        16.22.2. Market Share Analysis, 2022

            16.22.2.1. By Solution

            16.22.2.2. By Enterprise Size

            16.22.2.3. By Industry

    16.23. Israel

        16.23.1. Pricing Analysis

        16.23.2. Market Share Analysis, 2022

            16.23.2.1. By Solution

            16.23.2.2. By Enterprise Size

            16.23.2.3. By Industry

17. Market Structure Analysis

    17.1. Competition Dashboard

    17.2. Competition Benchmarking

    17.3. Market Share Analysis of Top Players

        17.3.1. By Regional

        17.3.2. By Solution

        17.3.3. By Enterprise Size

        17.3.4. By Industry

18. Competition Analysis

    18.1. Competition Deep Dive

        18.1.1. Broadcom

            18.1.1.1. Overview

            18.1.1.2. Product Portfolio

            18.1.1.3. Profitability by Market Segments

            18.1.1.4. Sales Footprint

            18.1.1.5. Strategy Overview

                18.1.1.5.1. Marketing Strategy

        18.1.2. IBM

            18.1.2.1. Overview

            18.1.2.2. Product Portfolio

            18.1.2.3. Profitability by Market Segments

            18.1.2.4. Sales Footprint

            18.1.2.5. Strategy Overview

                18.1.2.5.1. Marketing Strategy

        18.1.3. Capgemini

            18.1.3.1. Overview

            18.1.3.2. Product Portfolio

            18.1.3.3. Profitability by Market Segments

            18.1.3.4. Sales Footprint

            18.1.3.5. Strategy Overview

                18.1.3.5.1. Marketing Strategy

        18.1.4. Kaspersky Lab

            18.1.4.1. Overview

            18.1.4.2. Product Portfolio

            18.1.4.3. Profitability by Market Segments

            18.1.4.4. Sales Footprint

            18.1.4.5. Strategy Overview

                18.1.4.5.1. Marketing Strategy

        18.1.5. Symantec

            18.1.5.1. Overview

            18.1.5.2. Product Portfolio

            18.1.5.3. Profitability by Market Segments

            18.1.5.4. Sales Footprint

            18.1.5.5. Strategy Overview

                18.1.5.5.1. Marketing Strategy

        18.1.6. Carbon Black

            18.1.6.1. Overview

            18.1.6.2. Product Portfolio

            18.1.6.3. Profitability by Market Segments

            18.1.6.4. Sales Footprint

            18.1.6.5. Strategy Overview

                18.1.6.5.1. Marketing Strategy

        18.1.7. Clear network

            18.1.7.1. Overview

            18.1.7.2. Product Portfolio

            18.1.7.3. Profitability by Market Segments

            18.1.7.4. Sales Footprint

            18.1.7.5. Strategy Overview

                18.1.7.5.1. Marketing Strategy

        18.1.8. CyberDefenses

            18.1.8.1. Overview

            18.1.8.2. Product Portfolio

            18.1.8.3. Profitability by Market Segments

            18.1.8.4. Sales Footprint

            18.1.8.5. Strategy Overview

                18.1.8.5.1. Marketing Strategy

        18.1.9. Cybereason

            18.1.9.1. Overview

            18.1.9.2. Product Portfolio

            18.1.9.3. Profitability by Market Segments

            18.1.9.4. Sales Footprint

            18.1.9.5. Strategy Overview

                18.1.9.5.1. Marketing Strategy

        18.1.10. Delta Risk

            18.1.10.1. Overview

            18.1.10.2. Product Portfolio

            18.1.10.3. Profitability by Market Segments

            18.1.10.4. Sales Footprint

            18.1.10.5. Strategy Overview

                18.1.10.5.1. Marketing Strategy

        18.1.11. Ingalls Information Security

            18.1.11.1. Overview

            18.1.11.2. Product Portfolio

            18.1.11.3. Profitability by Market Segments

            18.1.11.4. Sales Footprint

            18.1.11.5. Strategy Overview

                18.1.11.5.1. Marketing Strategy

        18.1.12. IronNet Cybersecurity

            18.1.12.1. Overview

            18.1.12.2. Product Portfolio

            18.1.12.3. Profitability by Market Segments

            18.1.12.4. Sales Footprint

            18.1.12.5. Strategy Overview

                18.1.12.5.1. Marketing Strategy

        18.1.13. Paladion

            18.1.13.1. Overview

            18.1.13.2. Product Portfolio

            18.1.13.3. Profitability by Market Segments

            18.1.13.4. Sales Footprint

            18.1.13.5. Strategy Overview

                18.1.13.5.1. Marketing Strategy

        18.1.14. Redscan

            18.1.14.1. Overview

            18.1.14.2. Product Portfolio

            18.1.14.3. Profitability by Market Segments

            18.1.14.4. Sales Footprint

            18.1.14.5. Strategy Overview

                18.1.14.5.1. Marketing Strategy

19. Assumptions & Acronyms Used

20. Research Methodology

List of Tables

Table 1: Global Market Value (US$ Million) Forecast by Region, 2018 to 2033

Table 2: Global Market Value (US$ Million) Forecast by Solution, 2018 to 2033

Table 3: Global Market Value (US$ Million) Forecast by Enterprise Size, 2018 to 2033

Table 4: Global Market Value (US$ Million) Forecast by Industry , 2018 to 2033

Table 5: North America Market Value (US$ Million) Forecast by Country, 2018 to 2033

Table 6: North America Market Value (US$ Million) Forecast by Solution, 2018 to 2033

Table 7: North America Market Value (US$ Million) Forecast by Enterprise Size, 2018 to 2033

Table 8: North America Market Value (US$ Million) Forecast by Industry , 2018 to 2033

Table 9: Latin America Market Value (US$ Million) Forecast by Country, 2018 to 2033

Table 10: Latin America Market Value (US$ Million) Forecast by Solution, 2018 to 2033

Table 11: Latin America Market Value (US$ Million) Forecast by Enterprise Size, 2018 to 2033

Table 12: Latin America Market Value (US$ Million) Forecast by Industry , 2018 to 2033

Table 13: Western Europe Market Value (US$ Million) Forecast by Country, 2018 to 2033

Table 14: Western Europe Market Value (US$ Million) Forecast by Solution, 2018 to 2033

Table 15: Western Europe Market Value (US$ Million) Forecast by Enterprise Size, 2018 to 2033

Table 16: Western Europe Market Value (US$ Million) Forecast by Industry , 2018 to 2033

Table 17: Eastern Europe Market Value (US$ Million) Forecast by Country, 2018 to 2033

Table 18: Eastern Europe Market Value (US$ Million) Forecast by Solution, 2018 to 2033

Table 19: Eastern Europe Market Value (US$ Million) Forecast by Enterprise Size, 2018 to 2033

Table 20: Eastern Europe Market Value (US$ Million) Forecast by Industry , 2018 to 2033

Table 21: South Asia and Pacific Market Value (US$ Million) Forecast by Country, 2018 to 2033

Table 22: South Asia and Pacific Market Value (US$ Million) Forecast by Solution, 2018 to 2033

Table 23: South Asia and Pacific Market Value (US$ Million) Forecast by Enterprise Size, 2018 to 2033

Table 24: South Asia and Pacific Market Value (US$ Million) Forecast by Industry , 2018 to 2033

Table 25: East Asia Market Value (US$ Million) Forecast by Country, 2018 to 2033

Table 26: East Asia Market Value (US$ Million) Forecast by Solution, 2018 to 2033

Table 27: East Asia Market Value (US$ Million) Forecast by Enterprise Size, 2018 to 2033

Table 28: East Asia Market Value (US$ Million) Forecast by Industry , 2018 to 2033

Table 29: Middle East and Africa Market Value (US$ Million) Forecast by Country, 2018 to 2033

Table 30: Middle East and Africa Market Value (US$ Million) Forecast by Solution, 2018 to 2033

Table 31: Middle East and Africa Market Value (US$ Million) Forecast by Enterprise Size, 2018 to 2033

Table 32: Middle East and Africa Market Value (US$ Million) Forecast by Industry , 2018 to 2033

List of Charts

Figure 1: Global Market Value (US$ Million) by Solution, 2023 to 2033

Figure 2: Global Market Value (US$ Million) by Enterprise Size, 2023 to 2033

Figure 3: Global Market Value (US$ Million) by Industry , 2023 to 2033

Figure 4: Global Market Value (US$ Million) by Region, 2023 to 2033

Figure 5: Global Market Value (US$ Million) Analysis by Region, 2018 to 2033

Figure 6: Global Market Value Share (%) and BPS Analysis by Region, 2023 to 2033

Figure 7: Global Market Y-o-Y Growth (%) Projections by Region, 2023 to 2033

Figure 8: Global Market Value (US$ Million) Analysis by Solution, 2018 to 2033

Figure 9: Global Market Value Share (%) and BPS Analysis by Solution, 2023 to 2033

Figure 10: Global Market Y-o-Y Growth (%) Projections by Solution, 2023 to 2033

Figure 11: Global Market Value (US$ Million) Analysis by Enterprise Size, 2018 to 2033

Figure 12: Global Market Value Share (%) and BPS Analysis by Enterprise Size, 2023 to 2033

Figure 13: Global Market Y-o-Y Growth (%) Projections by Enterprise Size, 2023 to 2033

Figure 14: Global Market Value (US$ Million) Analysis by Industry , 2018 to 2033

Figure 15: Global Market Value Share (%) and BPS Analysis by Industry , 2023 to 2033

Figure 16: Global Market Y-o-Y Growth (%) Projections by Industry , 2023 to 2033

Figure 17: Global Market Attractiveness by Solution, 2023 to 2033

Figure 18: Global Market Attractiveness by Enterprise Size, 2023 to 2033

Figure 19: Global Market Attractiveness by Industry , 2023 to 2033

Figure 20: Global Market Attractiveness by Region, 2023 to 2033

Figure 21: North America Market Value (US$ Million) by Solution, 2023 to 2033

Figure 22: North America Market Value (US$ Million) by Enterprise Size, 2023 to 2033

Figure 23: North America Market Value (US$ Million) by Industry , 2023 to 2033

Figure 24: North America Market Value (US$ Million) by Country, 2023 to 2033

Figure 25: North America Market Value (US$ Million) Analysis by Country, 2018 to 2033

Figure 26: North America Market Value Share (%) and BPS Analysis by Country, 2023 to 2033

Figure 27: North America Market Y-o-Y Growth (%) Projections by Country, 2023 to 2033

Figure 28: North America Market Value (US$ Million) Analysis by Solution, 2018 to 2033

Figure 29: North America Market Value Share (%) and BPS Analysis by Solution, 2023 to 2033

Figure 30: North America Market Y-o-Y Growth (%) Projections by Solution, 2023 to 2033

Figure 31: North America Market Value (US$ Million) Analysis by Enterprise Size, 2018 to 2033

Figure 32: North America Market Value Share (%) and BPS Analysis by Enterprise Size, 2023 to 2033

Figure 33: North America Market Y-o-Y Growth (%) Projections by Enterprise Size, 2023 to 2033

Figure 34: North America Market Value (US$ Million) Analysis by Industry , 2018 to 2033

Figure 35: North America Market Value Share (%) and BPS Analysis by Industry , 2023 to 2033

Figure 36: North America Market Y-o-Y Growth (%) Projections by Industry , 2023 to 2033

Figure 37: North America Market Attractiveness by Solution, 2023 to 2033

Figure 38: North America Market Attractiveness by Enterprise Size, 2023 to 2033

Figure 39: North America Market Attractiveness by Industry , 2023 to 2033

Figure 40: North America Market Attractiveness by Country, 2023 to 2033

Figure 41: Latin America Market Value (US$ Million) by Solution, 2023 to 2033

Figure 42: Latin America Market Value (US$ Million) by Enterprise Size, 2023 to 2033

Figure 43: Latin America Market Value (US$ Million) by Industry , 2023 to 2033

Figure 44: Latin America Market Value (US$ Million) by Country, 2023 to 2033

Figure 45: Latin America Market Value (US$ Million) Analysis by Country, 2018 to 2033

Figure 46: Latin America Market Value Share (%) and BPS Analysis by Country, 2023 to 2033

Figure 47: Latin America Market Y-o-Y Growth (%) Projections by Country, 2023 to 2033

Figure 48: Latin America Market Value (US$ Million) Analysis by Solution, 2018 to 2033

Figure 49: Latin America Market Value Share (%) and BPS Analysis by Solution, 2023 to 2033

Figure 50: Latin America Market Y-o-Y Growth (%) Projections by Solution, 2023 to 2033

Figure 51: Latin America Market Value (US$ Million) Analysis by Enterprise Size, 2018 to 2033

Figure 52: Latin America Market Value Share (%) and BPS Analysis by Enterprise Size, 2023 to 2033

Figure 53: Latin America Market Y-o-Y Growth (%) Projections by Enterprise Size, 2023 to 2033

Figure 54: Latin America Market Value (US$ Million) Analysis by Industry , 2018 to 2033

Figure 55: Latin America Market Value Share (%) and BPS Analysis by Industry , 2023 to 2033

Figure 56: Latin America Market Y-o-Y Growth (%) Projections by Industry , 2023 to 2033

Figure 57: Latin America Market Attractiveness by Solution, 2023 to 2033

Figure 58: Latin America Market Attractiveness by Enterprise Size, 2023 to 2033

Figure 59: Latin America Market Attractiveness by Industry , 2023 to 2033

Figure 60: Latin America Market Attractiveness by Country, 2023 to 2033

Figure 61: Western Europe Market Value (US$ Million) by Solution, 2023 to 2033

Figure 62: Western Europe Market Value (US$ Million) by Enterprise Size, 2023 to 2033

Figure 63: Western Europe Market Value (US$ Million) by Industry , 2023 to 2033

Figure 64: Western Europe Market Value (US$ Million) by Country, 2023 to 2033

Figure 65: Western Europe Market Value (US$ Million) Analysis by Country, 2018 to 2033

Figure 66: Western Europe Market Value Share (%) and BPS Analysis by Country, 2023 to 2033

Figure 67: Western Europe Market Y-o-Y Growth (%) Projections by Country, 2023 to 2033

Figure 68: Western Europe Market Value (US$ Million) Analysis by Solution, 2018 to 2033

Figure 69: Western Europe Market Value Share (%) and BPS Analysis by Solution, 2023 to 2033

Figure 70: Western Europe Market Y-o-Y Growth (%) Projections by Solution, 2023 to 2033

Figure 71: Western Europe Market Value (US$ Million) Analysis by Enterprise Size, 2018 to 2033

Figure 72: Western Europe Market Value Share (%) and BPS Analysis by Enterprise Size, 2023 to 2033

Figure 73: Western Europe Market Y-o-Y Growth (%) Projections by Enterprise Size, 2023 to 2033

Figure 74: Western Europe Market Value (US$ Million) Analysis by Industry , 2018 to 2033

Figure 75: Western Europe Market Value Share (%) and BPS Analysis by Industry , 2023 to 2033

Figure 76: Western Europe Market Y-o-Y Growth (%) Projections by Industry , 2023 to 2033

Figure 77: Western Europe Market Attractiveness by Solution, 2023 to 2033

Figure 78: Western Europe Market Attractiveness by Enterprise Size, 2023 to 2033

Figure 79: Western Europe Market Attractiveness by Industry , 2023 to 2033

Figure 80: Western Europe Market Attractiveness by Country, 2023 to 2033

Figure 81: Eastern Europe Market Value (US$ Million) by Solution, 2023 to 2033

Figure 82: Eastern Europe Market Value (US$ Million) by Enterprise Size, 2023 to 2033

Figure 83: Eastern Europe Market Value (US$ Million) by Industry , 2023 to 2033

Figure 84: Eastern Europe Market Value (US$ Million) by Country, 2023 to 2033

Figure 85: Eastern Europe Market Value (US$ Million) Analysis by Country, 2018 to 2033

Figure 86: Eastern Europe Market Value Share (%) and BPS Analysis by Country, 2023 to 2033

Figure 87: Eastern Europe Market Y-o-Y Growth (%) Projections by Country, 2023 to 2033

Figure 88: Eastern Europe Market Value (US$ Million) Analysis by Solution, 2018 to 2033

Figure 89: Eastern Europe Market Value Share (%) and BPS Analysis by Solution, 2023 to 2033

Figure 90: Eastern Europe Market Y-o-Y Growth (%) Projections by Solution, 2023 to 2033

Figure 91: Eastern Europe Market Value (US$ Million) Analysis by Enterprise Size, 2018 to 2033

Figure 92: Eastern Europe Market Value Share (%) and BPS Analysis by Enterprise Size, 2023 to 2033

Figure 93: Eastern Europe Market Y-o-Y Growth (%) Projections by Enterprise Size, 2023 to 2033

Figure 94: Eastern Europe Market Value (US$ Million) Analysis by Industry , 2018 to 2033

Figure 95: Eastern Europe Market Value Share (%) and BPS Analysis by Industry , 2023 to 2033

Figure 96: Eastern Europe Market Y-o-Y Growth (%) Projections by Industry , 2023 to 2033

Figure 97: Eastern Europe Market Attractiveness by Solution, 2023 to 2033

Figure 98: Eastern Europe Market Attractiveness by Enterprise Size, 2023 to 2033

Figure 99: Eastern Europe Market Attractiveness by Industry , 2023 to 2033

Figure 100: Eastern Europe Market Attractiveness by Country, 2023 to 2033

Figure 101: South Asia and Pacific Market Value (US$ Million) by Solution, 2023 to 2033

Figure 102: South Asia and Pacific Market Value (US$ Million) by Enterprise Size, 2023 to 2033

Figure 103: South Asia and Pacific Market Value (US$ Million) by Industry , 2023 to 2033

Figure 104: South Asia and Pacific Market Value (US$ Million) by Country, 2023 to 2033

Figure 105: South Asia and Pacific Market Value (US$ Million) Analysis by Country, 2018 to 2033

Figure 106: South Asia and Pacific Market Value Share (%) and BPS Analysis by Country, 2023 to 2033

Figure 107: South Asia and Pacific Market Y-o-Y Growth (%) Projections by Country, 2023 to 2033

Figure 108: South Asia and Pacific Market Value (US$ Million) Analysis by Solution, 2018 to 2033

Figure 109: South Asia and Pacific Market Value Share (%) and BPS Analysis by Solution, 2023 to 2033

Figure 110: South Asia and Pacific Market Y-o-Y Growth (%) Projections by Solution, 2023 to 2033

Figure 111: South Asia and Pacific Market Value (US$ Million) Analysis by Enterprise Size, 2018 to 2033

Figure 112: South Asia and Pacific Market Value Share (%) and BPS Analysis by Enterprise Size, 2023 to 2033

Figure 113: South Asia and Pacific Market Y-o-Y Growth (%) Projections by Enterprise Size, 2023 to 2033

Figure 114: South Asia and Pacific Market Value (US$ Million) Analysis by Industry , 2018 to 2033

Figure 115: South Asia and Pacific Market Value Share (%) and BPS Analysis by Industry , 2023 to 2033

Figure 116: South Asia and Pacific Market Y-o-Y Growth (%) Projections by Industry , 2023 to 2033

Figure 117: South Asia and Pacific Market Attractiveness by Solution, 2023 to 2033

Figure 118: South Asia and Pacific Market Attractiveness by Enterprise Size, 2023 to 2033

Figure 119: South Asia and Pacific Market Attractiveness by Industry , 2023 to 2033

Figure 120: South Asia and Pacific Market Attractiveness by Country, 2023 to 2033

Figure 121: East Asia Market Value (US$ Million) by Solution, 2023 to 2033

Figure 122: East Asia Market Value (US$ Million) by Enterprise Size, 2023 to 2033

Figure 123: East Asia Market Value (US$ Million) by Industry , 2023 to 2033

Figure 124: East Asia Market Value (US$ Million) by Country, 2023 to 2033

Figure 125: East Asia Market Value (US$ Million) Analysis by Country, 2018 to 2033

Figure 126: East Asia Market Value Share (%) and BPS Analysis by Country, 2023 to 2033

Figure 127: East Asia Market Y-o-Y Growth (%) Projections by Country, 2023 to 2033

Figure 128: East Asia Market Value (US$ Million) Analysis by Solution, 2018 to 2033

Figure 129: East Asia Market Value Share (%) and BPS Analysis by Solution, 2023 to 2033

Figure 130: East Asia Market Y-o-Y Growth (%) Projections by Solution, 2023 to 2033

Figure 131: East Asia Market Value (US$ Million) Analysis by Enterprise Size, 2018 to 2033

Figure 132: East Asia Market Value Share (%) and BPS Analysis by Enterprise Size, 2023 to 2033

Figure 133: East Asia Market Y-o-Y Growth (%) Projections by Enterprise Size, 2023 to 2033

Figure 134: East Asia Market Value (US$ Million) Analysis by Industry , 2018 to 2033

Figure 135: East Asia Market Value Share (%) and BPS Analysis by Industry , 2023 to 2033

Figure 136: East Asia Market Y-o-Y Growth (%) Projections by Industry , 2023 to 2033

Figure 137: East Asia Market Attractiveness by Solution, 2023 to 2033

Figure 138: East Asia Market Attractiveness by Enterprise Size, 2023 to 2033

Figure 139: East Asia Market Attractiveness by Industry , 2023 to 2033

Figure 140: East Asia Market Attractiveness by Country, 2023 to 2033

Figure 141: Middle East and Africa Market Value (US$ Million) by Solution, 2023 to 2033

Figure 142: Middle East and Africa Market Value (US$ Million) by Enterprise Size, 2023 to 2033

Figure 143: Middle East and Africa Market Value (US$ Million) by Industry , 2023 to 2033

Figure 144: Middle East and Africa Market Value (US$ Million) by Country, 2023 to 2033

Figure 145: Middle East and Africa Market Value (US$ Million) Analysis by Country, 2018 to 2033

Figure 146: Middle East and Africa Market Value Share (%) and BPS Analysis by Country, 2023 to 2033

Figure 147: Middle East and Africa Market Y-o-Y Growth (%) Projections by Country, 2023 to 2033

Figure 148: Middle East and Africa Market Value (US$ Million) Analysis by Solution, 2018 to 2033

Figure 149: Middle East and Africa Market Value Share (%) and BPS Analysis by Solution, 2023 to 2033

Figure 150: Middle East and Africa Market Y-o-Y Growth (%) Projections by Solution, 2023 to 2033

Figure 151: Middle East and Africa Market Value (US$ Million) Analysis by Enterprise Size, 2018 to 2033

Figure 152: Middle East and Africa Market Value Share (%) and BPS Analysis by Enterprise Size, 2023 to 2033

Figure 153: Middle East and Africa Market Y-o-Y Growth (%) Projections by Enterprise Size, 2023 to 2033

Figure 154: Middle East and Africa Market Value (US$ Million) Analysis by Industry , 2018 to 2033

Figure 155: Middle East and Africa Market Value Share (%) and BPS Analysis by Industry , 2023 to 2033

Figure 156: Middle East and Africa Market Y-o-Y Growth (%) Projections by Industry , 2023 to 2033

Figure 157: Middle East and Africa Market Attractiveness by Solution, 2023 to 2033

Figure 158: Middle East and Africa Market Attractiveness by Enterprise Size, 2023 to 2033

Figure 159: Middle East and Africa Market Attractiveness by Industry , 2023 to 2033

Figure 160: Middle East and Africa Market Attractiveness by Country, 2023 to 2033

Recommendations

Technology

Threat Intelligence Market

Published : March 2024

Technology

Advanced Persistent Threat Protection Market

Published : January 2023

Explore Technology Insights

View Reports