Reports

- Global Locations -

Headquarters

Future Market Insights, Inc.

Christiana Corporate, 200
Continental Drive, Suite 401,
Newark, Delaware - 19713,
United States

T: +1-845-579-5705

Americas

Future Market Insights, Inc.

616 Corporate Way, Suite 2-9018,
Valley Cottage, NY 10989, United States

T: +1-347-918-3531

MEA

Future Market Insights

1602-6 Jumeirah Bay X2 Tower, Plot No: JLT-PH2-X2A,
Jumeirah Lakes Towers, Dubai,
United Arab Emirates

Europe

Future Market Insights

3rd Floor, 207 Regent Street,
W1B 3HH London
United Kingdom

T: + 44 (0) 20 8123 9659
D: +44 (0) 20 3287 4268

Asia Pacific

Future Market Insights

IndiaLand Global Tech Park, Unit UG-1, Behind Grand HighStreet, Phase 1, Hinjawadi, MH, Pune – 411057, India

Insider Threat Protection Market Outlook from 2023 to 2033

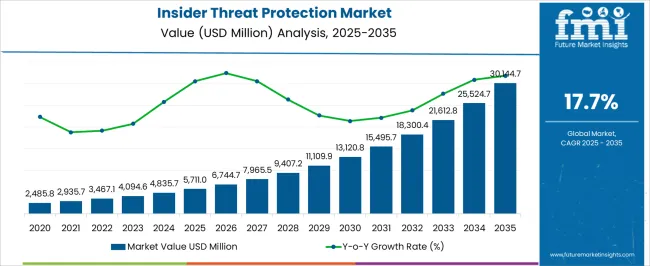
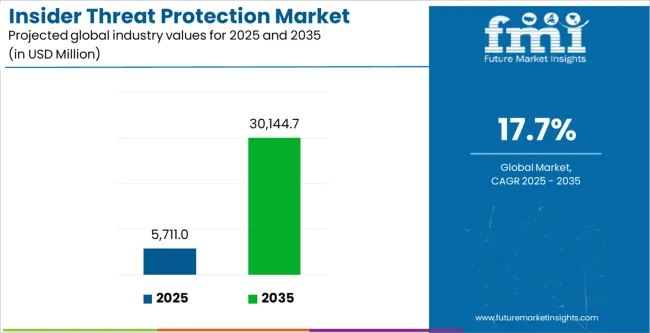
The global insider threat protection market reached US$ 4,094.6 million in 2023. The market is expected to attain a value of US$ 21,401.9 million, expanding at a CAGR of 18.1% by 2033.

Attributes Key Insights
Base Value (2022) US$ 3,500.0 million
Estimated Global Insider Threat Protection Market Size (2023E) US$ 4,094.6 million
Projected Insider Threat Protection Market Value (2033F) US$ 21,401.9 million
Value-based CAGR (2023 to 2033) 18.1%

The insider threat protection market is expected to surge due to significant efforts by governments and enterprises to create comprehensive threat intelligence solutions. Organizations are implementing data access control measures to keep sensitive data safe from unauthorized exposure, such as creating a security culture and employee screening.

They are implementing several safeguards to reduce the danger of authorized entities accessing sensitive information. These elements are expected to support the market expansion for insider threat projection throughout the projected period.

The popularity of remote working is increasing the risk of malware assaults and data breaches in several organizations. The possibility of company data being compromised due to device theft, loss, or hacking is raising concerns about data security. By offering security capabilities, including historical visibility of memory, disks, and devices, insider risk management solutions are set to assist in addressing these cybersecurity problems.

Regulations in several industrial verticals specify how data must be managed and safeguarded. The need for insider threat protection is increasing because of the ability of insider risk management solutions to assist firms in meeting these obligations and guaranteeing compliance. Machine learning (ML) and artificial intelligence (AI) are new technologies that are expected to help companies better defend against insider threats.

Don't pay for what you don't need

Customize your report by selecting specific countries or regions and save 30%!

Key Drivers for the Insider Threat Protection Market

  • Maintenance of productivity and service continuity for smooth business operations.
  • Financial risk mitigation to protect the organization's bottom line and financial stability.
  • Artificial intelligence (AI) and machine learning (ML) technologies are increasingly integrated into insider threat security systems. These technologies allow for spotting odd user patterns and behaviors, thereby improving an organization's ability to identify possible insider threats.
  • Employee devices and other endpoints are common places for insider threats to start.
  • Endpoint security solutions are becoming increasingly popular as they offer an additional defense against insider risks, illegal access, and data espionage.

Key Challenges for the Insider Threat Protection Market

  • Remote work amplifies the difficulty in securing organizational data.
  • Organizations with outdated systems are prone to potential insider threats.
Sudip Saha
Sudip Saha

Principal Consultant

Talk to Analyst

Find your sweet spots for generating winning opportunities in this market.

Growth Opportunities for Insider Threat Protection Market

  • Leveraging employee education evolution for enhanced security awareness.
  • Integration of cybersecurity frameworks.
  • Advancements for continuous monitoring for real-time risk assessment.

Insider Threat Protection Market Trends

  • Insider threat protection is witnessing a surge in the adoption of behavioral analytics, leveraging advanced algorithms to detect anomalies in employee behavior and enabling proactive identification of potential insider threats.
  • Organizations are increasingly incorporating AI and ML into insider threat protection solutions, empowering systems to learn & adapt, enhance anomaly detection, and mitigate risks with greater accuracy and efficiency.

Get the data you need at a Fraction of the cost

Personalize your report by choosing insights you need
and save 40%!

2018 to 2022 Insider Threat Protection Growth Outlook Vs. 2023 to 2033 Forecast

The insider threat protection market underwent a noteworthy transformation from 2018 to 2022, witnessing a substantial increase in market value. In 2018, the market stood at US$ 1,993.1 million.

From 2018 to 2022, organizations globally have become more aware of the risks associated with insider threats, leading to a growing demand for insider threat protection solutions. Implementing and enforcing data protection regulations, such as GDPR, have driven organizations to invest in solutions to ensure compliance and protect sensitive information.

The evolving nature of cyber threats and the adoption of advanced technologies have influenced the demand for more sophisticated insider threat protection solutions. The surge in remote work during the COVID-19 pandemic has heightened the need for solutions to address insider threats in distributed and virtual work environments.

Companies began creating official insider threat policies and strategies to deal with workers' careless and malevolent behavior. These programs frequently included user activity monitoring, background checks, and personnel training.

Future Forecast for the Insider Threat Protection Market

The global insider threat protection market is expected to rise at a CAGR of 18.1% from 2023 to 2033. The market size is expected to reach US$ 21,401.9 million by 2033.

The insider threat protection market appears promising, driven by a dynamic cybersecurity landscape and growing awareness of the potential hazards posed by individuals within companies. As companies prioritize data security and privacy, the demand for advanced insider threat prevention solutions is expected to surge.

Artificial intelligence, machine learning, and behavioral analytics are likely to play a vital role in strengthening the capabilities of insider threat defense methods. The global expansion of the insider threat protection ecosystem is also anticipated, further underlining its significance in the evolving landscape of business technology solutions.

Semi-annual Market Update

The table presents the expected CAGR for the insider threat protection market over several semi-annual periods spanning from 2022 to 2033. In the first half (H1) of the decade from 2022 to 2032, the field is estimated to surge at a CAGR of 16.0%, followed by a slightly higher growth rate of 16.4% in the second half (H2) of the same decade. Moving into the subsequent period, from H1 2023 to H2 2033, the CAGR is projected to remain high at 18.1% in the first half and surge to 18.5% in the second half.

Semi-annual Insights

Particular Value CAGR
H1 16.0% (2022 to 2032)
H2 16.4% (2022 to 2032)
H1 18.1% (2023 to 2033)
H2 18.5% (2023 to 2033)

Comparative View of Insider Threat Protection Markets

The peer or tangential markets in the technology division will likely impact the insider threat protection market. These include other types of markets, such as the security screening and open banking industries.

The security screening market is projected to expand at an 8.2% CAGR during the forecast period. Ongoing attention to modernizing airport security procedures, such as the introduction of cutting-edge screening tools for travelers and luggage, is set to drive the market.

On the contrary, the open banking industry is poised to thrive at a steady CAGR of 19.3% through 2033. Rising emphasis on streamlining onboarding procedures, facilitating fast account access, and creating user-friendly interfaces is expected to influence market expansion.

Insider Threat Protection Market:

Attributes Insider Threat Protection Market
CAGR (2023 to 2033) 18.1%
Growth Factor Creating a culture of security awareness involves educating people about potential risks and the significance of cybersecurity, which is set to gain traction in the market.
Key Trend in Insider Threat Protection Market Professional services are in demand as they assist companies in addressing vulnerabilities, minimizing further data loss, and taking preventative action to guard against potential cyberattacks.

Security Screening Market:

Attributes Security Screening Market
CAGR (2023 to 2033) 8.2%
Growth Factor There is a growing focus on screening technologies that can identify chemical and drug dangers in a variety of settings, such as vital infrastructure and transportation hubs.
Key Trends Integration of machine learning and artificial intelligence technologies to improve threat, pattern, and anomaly identification in security screening procedures is expected to drive the market.

Open Banking Market:

Attributes Open Banking Market
CAGR (2023 to 2033) 19.3%
Growth Factor Rising demand for financial services and solutions that are individualized and customized based on the preferences, data, and actions of customers is expected to fuel the market growth.
Key Trends The creation and implementation of standardized application programming interfaces (APIs) to enable smooth communication and interoperability between fintech companies and other participants is set to surge demand.

Country-wise Insights

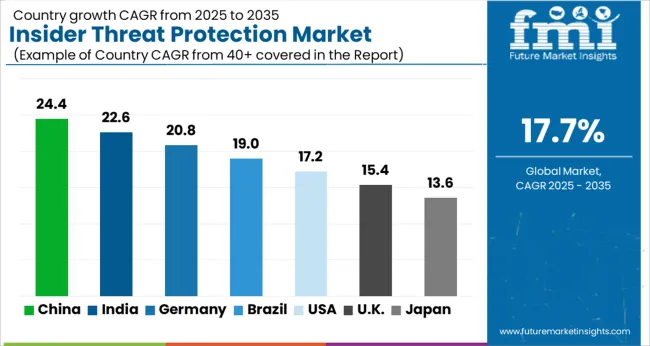
The table below shows the estimated growth rates of the top five countries. China, Japan, and Germany are set to record high CAGRs of 24.8%, 22.5%, and 19.7%, respectively, through 2033.

Country Value CAGR
United States 19.0%
China 24.8%
Japan 22.5%
Germany 19.7%
India 21.2%

Technological Advancements and Regulatory Imperatives Uplift the United States

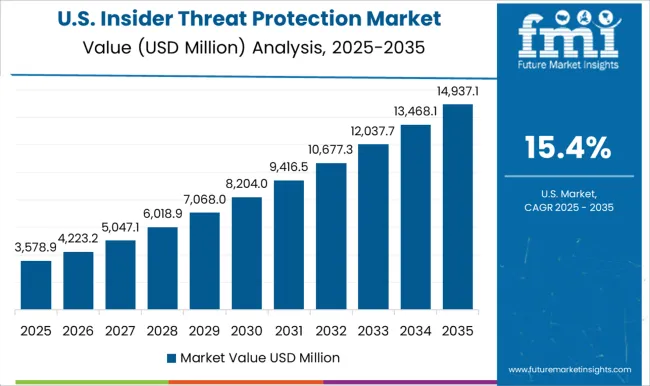
The insider threat protection market in the United States is set to rise at a CAGR of 19.0% from 2023 to 2033. The main factors supporting the market’s growth are:

  • To protect sensitive data, government departments and agencies in the United States frequently give insider threat defense the top priority. The public sector's adoption of solutions is influenced by government initiatives and policies.
  • Insider threat prevention solutions in the United States are equipped with cutting-edge technology such as machine learning, artificial intelligence, and behavior analytics to improve detection capabilities.
  • As a result of growing awareness of the possible risks posed by insider threats, organizations are investing more in preventive measures and implementing insider threat prevention systems.

Cultivating Cybersecurity Resilience Boosts Market Growth in Japan

Japan’s insider threat protection market is estimated to rise at a CAGR of 22.5% over the forecast period. Top factors supporting the market’s expansion in the country include:
  • With a growing reliance on digital infrastructure and technology, companies in Japan are actively implementing measures to safeguard sensitive data and intellectual property from insider threats.
  • Japan's unique cultural and business environment emphasizes trust and loyalty, making it essential for organizations to strike a balance between fostering a positive workplace culture and implementing robust security protocols.
  • As Japan advances technologically, the proactive approach to insider threat prevention underscores the importance of aligning cybersecurity strategies with the country's unique business and cultural landscape.

Germany Introduces Robust Strategies amid Cybersecurity Sophistication

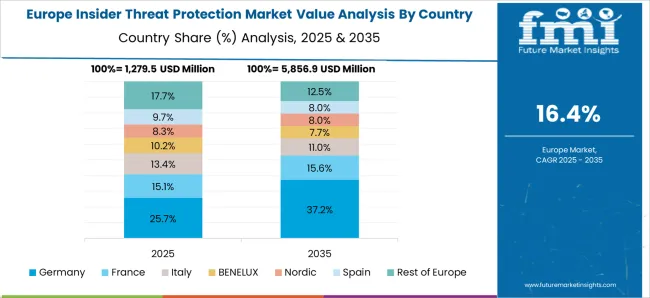
The insider threat protection market in Germany is estimated to record a CAGR of 19.7% through 2033. The primary factors bolstering the market size are:

  • The country's strong emphasis on data protection and privacy, exemplified by the General Data Protection Regulation (GDPR), underscores the importance of robust insider threat mitigation strategies.
  • Germany-based companies often prioritize a comprehensive approach that combines advanced technological solutions with stringent policies and employee training programs.

Rising Cybersecurity Concerns in India to Gain Traction Through 2033

India is estimated to rise at a CAGR of 21.2%. Key factors influencing the market include:

  • With a burgeoning IT sector and a growing emphasis on digital transformation, companies in India recognize the need to fortify defense against potential internal risks.
  • Implementation of robust cybersecurity measures, including advanced endpoint security, privileged access management, and employee training programs, is becoming integral to safeguarding sensitive data and intellectual property.
  • In navigating the complexities of the digital age, organizations are increasingly investing in proactive and adaptive strategies to mitigate insider threats & ensure the integrity and security of their digital assets.

Emerging Opportunities in China Attracting Key Market Players

Key players are significantly investing in China, as the country is offering greater growth opportunities than its counterparts. Through 2033, China is projected to expand at a CAGR of 24.8%, driven by the following factors:

  • The adoption of insider threat protection solutions by the banking sector is set to be proactive because of the crucial nature of financial data and the possible financial ramifications of a security breach.
  • Institutions of high learning and research, which manage sensitive data, valuable intellectual property, and trade secrets, are investing heavily in insider threat protection solutions to protect their assets.
  • Large enterprises, with their extensive networks and high-risk profile, are known to make significant investments in these solutions in China.

Category-wise Insights

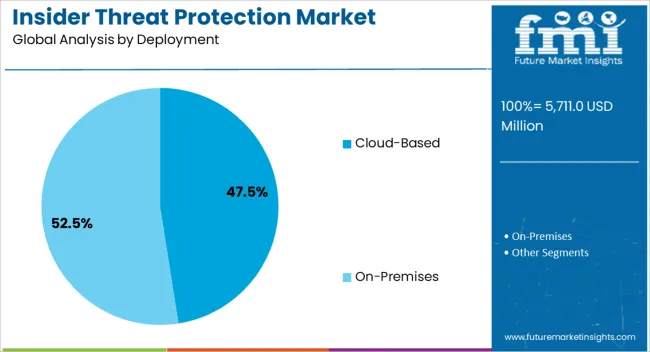
The section below shows the service segment dominating by solution. It is predicted to surge at a CAGR of 19.1% by 2033. Based on deployment type, the cloud-based segment is anticipated to generate a dominant share through 2033. It is set to rise at a CAGR of 19.7% by 2033.

Software Segment Dominates the Market by Solution

By Solution Value CAGR
Software 16.8%
Services 19.1%

The services segment experiences a surge in demand as organizations grapple with increasingly sophisticated and complex insider threats. Security professionals offer specialized expertise in navigating intricate threat landscapes and implementing effective countermeasures.

The dynamic nature of cyber threats necessitates continuous adaptation in the service segment. Security professionals within the professional service segment are adept at staying ahead of emerging threats, providing organizations with proactive measures to counter evolving insider threat tactics.

Demand for Cloud-based Deployment Type to Surge through 2033

Deployment Type Value CAGR
Cloud-based 19.7%
On-premises 15.9%

As industries use the benefits of cloud computing, organizations face new hurdles in protecting sensitive data from insider threats. Cloud-based insider threat protection services provide a cutting-edge approach to digital asset security and strong protection against potential breaches & illegal access.

Cloud-based solutions also offer real-time monitoring of user activity and data access, allowing for the rapid identification of considered actions. Products and services enable continuous analysis, generating alarms for potential insider threats, using advanced analytics and machine learning algorithms. This proactive approach enables prompt intervention and mitigation.

SMEs to be the Foremost Enterprise Size in the Market

Enterprise Size Value CAGR
SMEs 19.6%
Large Enterprises 16.7%

For SMEs, customized solutions, scalable technologies, and a strategic focus on the organization's unique characteristics are essential for effective protection. As SMEs evolve, their insider threat defense strategies also evolve in tandem, ensuring a resilient and adaptable security posture.

Insider threat protection service providers offer customized solutions to meet the specific demands of each enterprise. This entails easily integrating the technology into existing security frameworks and IT systems.

The ever-changing nature of cyber threats necessitates scalable and adaptable solutions. Service providers offer scalability to allow an organization's growth and respond to shifting threat scenarios. This ensures that solutions for insider threat protection remain effective and relevant.
Competitive Landscape

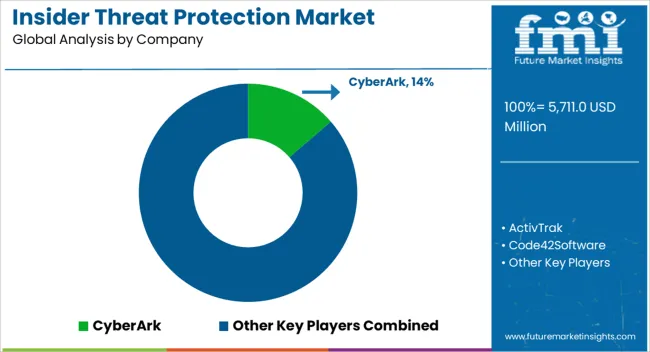
Key players are focusing on improving the customer experience for their insider threat protection solutions. They also consider the different needs and requirements of end-users and tailor solutions to their needs. Leading companies in the insider threat prevention market use a range of inorganic growth strategies, including alliances, mergers, and acquisitions, to increase the scope of their product offerings.

Key Developments

  • In April 2023, IBM introduced a new security suite to streamline and expedite the security analyst's workflow.
  • In October 2022, CyberArk unveiled additional features to secure all users' access to cloud services and contemporary infrastructure, leveraging the company's risk-based intelligent privilege controls.
  • In December 2022, LogRhythm Inc. announced a partnership with SentinelOne.
  • In January 2023, DoControl announced the growth of its SaaS security platform by introducing its Shadow Apps solution.

Key Players in the Insider Threat Protection Industry

  • ActivTrak
  • Code42Software
  • CyberArk
  • Cyberhaven
  • DellTechnologies
  • Digital Guardian
  • DoControl
  • Trellix (FireEye)
  • Forcepoint

Insider Threat Protection Market Segmentation by Category

By Solution:

  • Software
    • User and Entity Behavior Analytics (UEBA)
    • Security Information and Event Management (SIEM)
    • Identity and Access Management (IAM)
    • Others
  • Services
    • Professional Services
    • Security Consulting
    • Security Integration and Deployment
    • Support and Maintenance
    • Managed Services

By Deployment:

  • Cloud-based
  • On-premises

By Enterprise Type:

  • SMEs
  • Large Enterprises

By Industry:

  • Government and Defense
  • Banking, Financial Services, and Insurance (BFSI)
  • IT and Telecom
  • Retail and E-commerce
  • Energy and Utilities
  • Manufacturing
  • Education
  • Other Industry

By Region:

  • North America
  • Latin America
  • East Asia
  • South Asia and Pacific
  • Western Europe
  • Eastern Europe
  • Middle East and Africa

Frequently Asked Questions

How big is the insider threat protection market?

The market reached US$ 4,094.6 million in 2023.

What is the forecast for the insider threat protection market?

Demand for insider threat protection is slated to expand at an 18.1% CAGR by 2033.

What is the outlook for the insider threat protection market?

The market is set to reach US$ 21,401.9 million in 2033.

Who are the key players in the insider threat protection market sphere?

ActivTrak, Code42Software, and CyberArk are the key players.

Which region would lead the insider threat protection market?

East Asia is estimated to hold a market share of 20.8% over the forecast period.

Table of Content

1. Executive Summary

    1.1. Global Market Outlook

    1.2. Demand Side Trends

    1.3. Supply Side Trends

    1.4. Analysis and Recommendations

2. Market Overview

    2.1. Market Coverage / Taxonomy

    2.2. Market Definition / Scope / Limitations

3. Key Market Trends

    3.1. Key Trends Impacting the Market

    3.2. Product Innovation / Development Trends

4. Pricing Models

    4.1. Types of Pricing Models

        4.1.1. Subscription Pricing Model

        4.1.2. Perpetual License Model

    4.2. Average Solution Pricing Benchmark

5. Major Deals in Insider Threat Protection

    5.1. Major Deals/Strategic Contracts in Market, 2020- till present, 2023

    5.2. Deal Growth Scenarios, Y-o-Y %

        5.2.1. Year 2020 (Q1-Q4 deal movements, % change)

        5.2.2. Year 2021 (Q1-Q4 deal movements, % change)

        5.2.3. Year 2022 (Q1-Q4-est. deal movements, % change)

6. Global Market Demand (in Value or Size in US$ Million) Analysis 2018 to 2022 and Forecast, 2023 to 2033

    6.1. Historical Market Value (US$ Million) Analysis, 2018 to 2022

    6.2. Current and Future Market Value (US$ Million) Projections, 2023 to 2033

        6.2.1. Y-o-Y Growth Trend Analysis

        6.2.2. Absolute $ Opportunity Analysis

7. Market Background

    7.1. Macro-Economic Factors

    7.2. Forecast Factors - Relevance & Impact

    7.3. Value Chain

    7.4. COVID-19 Crisis - Impact Assessment

        7.4.1. Current Statistics

        7.4.2. Short-Mid-Long Term Outlook

        7.4.3. Likely Rebound

    7.5. Market Dynamics

        7.5.1. Drivers

        7.5.2. Restraints

        7.5.3. Opportunity Analysis

8. Global Market Analysis 2018 to 2022 and Forecast 2023 to 2033, by Solution

    8.1. Introduction / Key Findings

    8.2. Historical Market Size (US$ Million) Analysis By Solution, 2018 to 2022

    8.3. Current and Future Market Size (US$ Million) Analysis and Forecast By Solution, 2023 to 2033

        8.3.1. Software

            8.3.1.1. User and Entity Behavior Analytics (UEBA)

            8.3.1.2. Security Information and Event Management (SIEM)

            8.3.1.3. Identity and Access Management (IAM)

            8.3.1.4. Others

        8.3.2. Services

            8.3.2.1. Professional Services

                8.3.2.1.1. Security Consulting

                8.3.2.1.2. Security Integration and Deployment

                8.3.2.1.3. Support and Maintenance

            8.3.2.2. Managed Services

    8.4. Market Attractiveness Analysis By Solution

9. Global Market Analysis 2018 to 2022 and Forecast 2023 to 2033, by Deployment

    9.1. Introduction / Key Findings

    9.2. Historical Market Size (US$ Million) Analysis By Deployment, 2018 to 2022

    9.3. Current and Future Market Size (US$ Million) Analysis and Forecast By Deployment, 2023 to 2033

        9.3.1. Cloud-based

        9.3.2. On-premises

    9.4. Market Attractiveness Analysis By Deployment

10. Global Market Analysis 2018 to 2022 and Forecast 2023 to 2033, by Enterprise Size

    10.1. Introduction / Key Findings

    10.2. Historical Market Size (US$ Million) Analysis By Enterprise Size, 2018 to 2022

    10.3. Current and Future Market Size (US$ Million) Analysis and Forecast By Enterprise Size, 2023 to 2033

        10.3.1. Small and Mid-sized Enterprises (SMEs)

        10.3.2. Large Enterprises

    10.4. Market Attractiveness Analysis By Enterprise Size

11. Global Market Analysis 2018 to 2022 and Forecast 2023 to 2033, by Industry

    11.1. Introduction / Key Findings

    11.2. Historical Market Size (US$ Million) Analysis By Industry, 2018 to 2022

    11.3. Current and Future Market Size (US$ Million) Analysis and Forecast By Industry, 2023 to 2033

        11.3.1. Government and Defense

        11.3.2. Banking, Financial Services, and Insurance (BFSI)

        11.3.3. IT and Telecom

        11.3.4. Retail and e-commerce

        11.3.5. Energy and Utilities

        11.3.6. Manufacturing

        11.3.7. Education

        11.3.8. Others

    11.4. Market Attractiveness Analysis By Industry

12. Global Market Analysis 2018 to 2022 and Forecast 2023 to 2033, by Region

    12.1. Introduction

    12.2. Historical Market Size (US$ Million) Analysis By Region, 2018 to 2022

    12.3. Current and Future Market Size (US$ Million) Analysis and Forecast By Region, 2023 to 2033

        12.3.1. North America

        12.3.2. Latin America

        12.3.3. East Asia

        12.3.4. South Asia and Pacific

        12.3.5. Western Europe

        12.3.6. Eastern Europe

        12.3.7. Middle East and Africa

    12.4. Market Attractiveness Analysis By Region

13. North America Market Analysis 2018 to 2022 and Forecast 2023 to 2033

    13.1. Introduction

    13.2. Historical Market Size (US$ Million) Analysis By Market Taxonomy, 2018 to 2022

    13.3. Current and Future Market Size (US$ Million) Forecast By Market Taxonomy, 2023 to 2033

        13.3.1. By Country

            13.3.1.1. United States

            13.3.1.2. Canada

            13.3.1.3. Mexico

        13.3.2. By Solution

        13.3.3. By Deployment

        13.3.4. By Enterprise Size

        13.3.5. By Industry

    13.4. Market Attractiveness Analysis

        13.4.1. By Country

        13.4.2. By Solution

        13.4.3. By Deployment

        13.4.4. By Enterprise Size

        13.4.5. By Industry

    13.5. Market Trends

    13.6. Key Market Participants - Intensity Mapping

14. Latin America Market Analysis 2018 to 2022 and Forecast 2023 to 2033

    14.1. Introduction

    14.2. Historical Market Size (US$ Million) Analysis By Market Taxonomy, 2018 to 2022

    14.3. Current and Future Market Size (US$ Million) Forecast By Market Taxonomy, 2023 to 2033

        14.3.1. By Country

            14.3.1.1. Brazil

            14.3.1.2. Chile

            14.3.1.3. Rest of Latin America

        14.3.2. By Solution

        14.3.3. By Deployment

        14.3.4. By Enterprise Size

        14.3.5. By Industry

    14.4. Market Attractiveness Analysis

        14.4.1. By Country

        14.4.2. By Solution

        14.4.3. By Deployment

        14.4.4. By Enterprise Size

        14.4.5. By Industry

    14.5. Market Trends

    14.6. Key Market Participants - Intensity Mapping

15. South Asia and Pacific Market Analysis 2018 to 2022 and Forecast 2023 to 2033

    15.1. Introduction

    15.2. Historical Market Size (US$ Million) Analysis By Market Taxonomy, 2018 to 2022

    15.3. Current and Future Market Size (US$ Million) Forecast By Market Taxonomy, 2023 to 2033

        15.3.1. By Country

            15.3.1.1. India

            15.3.1.2. ASEAN

            15.3.1.3. Australia and New Zealand

            15.3.1.4. Rest of South Asia and Pacific

        15.3.2. By Solution

        15.3.3. By Deployment

        15.3.4. By Enterprise Size

        15.3.5. By Industry

    15.4. Market Attractiveness Analysis

        15.4.1. By Country

        15.4.2. By Solution

        15.4.3. By Deployment

        15.4.4. By Enterprise Size

        15.4.5. By Industry

    15.5. Market Trends

    15.6. Key Market Participants - Intensity Mapping

16. East Asia Market Analysis 2018 to 2022 and Forecast 2023 to 2033

    16.1. Introduction

    16.2. Historical Market Size (US$ Million) Analysis By Market Taxonomy, 2018 to 2022

    16.3. Current and Future Market Size (US$ Million) Forecast By Market Taxonomy, 2023 to 2033

        16.3.1. By Country

            16.3.1.1. China

            16.3.1.2. Japan

            16.3.1.3. South Korea

        16.3.2. By Solution

        16.3.3. By Deployment

        16.3.4. By Enterprise Size

        16.3.5. By Industry

    16.4. Market Attractiveness Analysis

        16.4.1. By Country

        16.4.2. By Solution

        16.4.3. By Deployment

        16.4.4. By Enterprise Size

        16.4.5. By Industry

    16.5. Market Trends

    16.6. Key Market Participants - Intensity Mapping

17. Western Europe Market Analysis 2018 to 2022 and Forecast 2023 to 2033

    17.1. Introduction

    17.2. Historical Market Size (US$ Million) Analysis By Market Taxonomy, 2018 to 2022

    17.3. Current and Future Market Size (US$ Million) Forecast By Market Taxonomy, 2023 to 2033

        17.3.1. By Country

            17.3.1.1. Germany

            17.3.1.2. Italy

            17.3.1.3. France

            17.3.1.4. United Kingdom

            17.3.1.5. Spain

            17.3.1.6. BENELUX

            17.3.1.7. Rest of Europe

        17.3.2. By Solution

        17.3.3. By Deployment

        17.3.4. By Enterprise Size

        17.3.5. By Industry

    17.4. Market Attractiveness Analysis

        17.4.1. By Country

        17.4.2. By Solution

        17.4.3. By Deployment

        17.4.4. By Enterprise Size

        17.4.5. By Industry

    17.5. Market Trends

    17.6. Key Market Participants - Intensity Mapping

18. Eastern Europe Market Analysis 2018 to 2022 and Forecast 2023 to 2033

    18.1. Introduction

    18.2. Historical Market Size (US$ Million) Analysis By Market Taxonomy, 2018 to 2022

    18.3. Current and Future Market Size (US$ Million) Forecast By Market Taxonomy, 2023 to 2033

        18.3.1. By Country

            18.3.1.1. Poland

            18.3.1.2. Hungary

            18.3.1.3. Russia

            18.3.1.4. Balkan and Baltics

            18.3.1.5. Rest of Eastern Europe

        18.3.2. By Solution

        18.3.3. By Deployment

        18.3.4. By Enterprise Size

        18.3.5. By Industry

    18.4. Market Attractiveness Analysis

        18.4.1. By Country

        18.4.2. By Solution

        18.4.3. By Deployment

        18.4.4. By Enterprise Size

        18.4.5. By Industry

    18.5. Market Trends

    18.6. Key Market Participants - Intensity Mapping

19. Middle East and Africa Market Analysis 2018 to 2022 and Forecast 2023 to 2033

    19.1. Introduction

    19.2. Historical Market Size (US$ Million) Analysis By Market Taxonomy, 2018 to 2022

    19.3. Current and Future Market Size (US$ Million) Forecast By Market Taxonomy, 2023 to 2033

        19.3.1. By Country

            19.3.1.1. Saudi Arabia

            19.3.1.2. United Arab Emirates

            19.3.1.3. Turkiye

            19.3.1.4. South Africa

            19.3.1.5. Rest of Middle East and Africa

        19.3.2. By Solution

        19.3.3. By Deployment

        19.3.4. By Enterprise Size

        19.3.5. By Industry

    19.4. Market Attractiveness Analysis

        19.4.1. By Country

        19.4.2. By Solution

        19.4.3. By Deployment

        19.4.4. By Enterprise Size

        19.4.5. By Industry

    19.5. Market Trends

    19.6. Key Market Participants - Intensity Mapping

20. Country-wise Market Analysis

    20.1. United States Market Analysis

        20.1.1. By Solution

        20.1.2. By Deployment

        20.1.3. By Enterprise Size

        20.1.4. By Industry

    20.2. Canada Market Analysis

        20.2.1. By Solution

        20.2.2. By Deployment

        20.2.3. By Enterprise Size

        20.2.4. By Industry

    20.3. Mexico Market Analysis

        20.3.1. By Solution

        20.3.2. By Deployment

        20.3.3. By Enterprise Size

        20.3.4. By Industry

    20.4. Brazil Market Analysis

        20.4.1. By Solution

        20.4.2. By Deployment

        20.4.3. By Enterprise Size

        20.4.4. By Industry

    20.5. Germany Market Analysis

        20.5.1. By Solution

        20.5.2. By Deployment

        20.5.3. By Enterprise Size

        20.5.4. By Industry

    20.6. Italy Market Analysis

        20.6.1. By Deployment

        20.6.2. By Enterprise Size

        20.6.3. By Industry

    20.7. France Market Analysis

        20.7.1. By Solution

        20.7.2. By Deployment

        20.7.3. By Enterprise Size

        20.7.4. By Industry

    20.8. United Kingdom Market Analysis

        20.8.1. By Solution

        20.8.2. By Deployment

        20.8.3. By Enterprise Size

        20.8.4. By Industry

    20.9. Spain Market Analysis

        20.9.1. By Solution

        20.9.2. By Deployment

        20.9.3. By Enterprise Size

        20.9.4. By Industry

    20.10. Russia Market Analysis

        20.10.1. By Solution

        20.10.2. By Deployment

        20.10.3. By Enterprise Size

        20.10.4. By Industry

    20.11. Hungary Market Analysis

        20.11.1. By Solution

        20.11.2. By Deployment

        20.11.3. By Enterprise Size

        20.11.4. By Industry

    20.12. Poland Market Analysis

        20.12.1. By Solution

        20.12.2. By Deployment

        20.12.3. By Enterprise Size

        20.12.4. By Industry

    20.13. China Market Analysis

        20.13.1. By Solution

        20.13.2. By Deployment

        20.13.3. By Enterprise Size

        20.13.4. By Industry

    20.14. Japan Market Analysis

        20.14.1. By Solution

        20.14.2. By Deployment

        20.14.3. By Enterprise Size

        20.14.4. By Industry

    20.15. South Korea Market Analysis

        20.15.1. By Solution

        20.15.2. By Deployment

        20.15.3. By Enterprise Size

        20.15.4. By Industry

    20.16. India Market Analysis

        20.16.1. By Solution

        20.16.2. By Deployment

        20.16.3. By Enterprise Size

        20.16.4. By Industry

    20.17. ASEAN Market Analysis

        20.17.1. By Solution

        20.17.2. By Deployment

        20.17.3. By Enterprise Size

        20.17.4. By Industry

    20.18. Australia and New Zealand Market Analysis

        20.18.1. By Solution

        20.18.2. By Deployment

        20.18.3. By Enterprise Size

        20.18.4. By Industry

    20.19. Saudi Arabia Market Analysis

        20.19.1. By Solution

        20.19.2. By Deployment

        20.19.3. By Enterprise Size

        20.19.4. By Industry

    20.20. UAE Market Analysis

        20.20.1. By Solution

        20.20.2. By Deployment

        20.20.3. By Enterprise Size

        20.20.4. By Industry

    20.21. Turkiye Market Analysis

        20.21.1. By Solution

        20.21.2. By Deployment

        20.21.3. By Enterprise Size

        20.21.4. By Industry

    20.22. South Africa Market Analysis

        20.22.1. By Solution

        20.22.2. By Deployment

        20.22.3. By Enterprise Size

        20.22.4. By Industry

21. Market Structure Analysis

    21.1. Market Analysis by Tier of Companies

    21.2. Market Share Analysis of Key Players

22. Competition Analysis

    22.1. Competition Dashboard

    22.2. Competition Deep Dive

        22.2.1. Business Overview

        22.2.2. Solution Portfolio

        22.2.3. Profitability by Market Segments (Business Segments/Region)

        22.2.4. Recent Market Development

        22.2.5. Key Strategies

    22.3. Prominent Vendors

        22.3.1. ActivTrak

        22.3.2. Code42 Software

        22.3.3. CyberArk

        22.3.4. Cyberhaven

        22.3.5. Dell Technologies

        22.3.6. Digital Guardian

        22.3.7. DoControl

        22.3.8. Trellix (FireEye)

        22.3.9. Forcepoint

        22.3.10. Fortinet

        22.3.11. IBM Corporation

        22.3.12. LogRhythm

        22.3.13. Proofpoint

        22.3.14. Sophos

        22.3.15. Splunk

        22.3.16. Varonis

        22.3.17. Microsoft

        22.3.18. CrowdStrike

        22.3.19. Broadcom (Symantec)

        22.3.20. Tenable, Inc.

23. Assumptions and Acronyms Used

24. Research Methodology

List of Tables

Table 1: Global Market Value (US$ Million) Analysis (2018 to 2022) by Solution

Table 2: Global Market Value (US$ Million) Forecast (2023 to 2033) by Solution

Table 3: Global Market Value (US$ Million) Analysis (2018 to 2022) by Enterprise Size

Table 4: Global Market Value (US$ Million) Forecast (2023 to 2033) by Enterprise Size

Table 5: Global Market Value (US$ Million) Analysis (2018 to 2022) by Deployment

Table 6: Global Market Value (US$ Million) Forecast (2023 to 2033) by Deployment

Table 7: Global Market Value (US$ Million) Analysis (2018 to 2022) by Industry

Table 8: Global Market Value (US$ Million) Forecast (2023 to 2033) by Industry

Table 9: Global Market Value (US$ Million) Analysis (2018 to 2022) by Region

Table 10: Global Market Value (US$ Million) Forecast (2023 to 2033) by Region

Table 11: North America Market Value (US$ Million) Analysis (2018 to 2022) by Solution

Table 12: North America Market Value (US$ Million) Forecast (2023 to 2033) by Solution

Table 13: North America Market Value (US$ Million) Analysis (2018 to 2022) by Enterprise Size

Table 14: North America Market Value (US$ Million) Forecast (2023 to 2033) by Enterprise Size

Table 15: North America Market Value (US$ Million) Analysis (2018 to 2022) by Deployment

Table 16: North America Market Value (US$ Million) Forecast (2023 to 2033) by Deployment

Table 17: North America Market Value (US$ Million) Analysis (2018 to 2022) by Industry

Table 18: North America Market Value (US$ Million) Forecast (2023 to 2033) by Industry

Table 19: North America Market Value (US$ Million) Analysis (2018 to 2022) by Country

Table 20: North America Market Value (US$ Million) Forecast (2023 to 2033) by Country

Table 21: Latin America Market Value (US$ Million) Analysis (2018 to 2022) by Solution

Table 22: Latin America Market Value (US$ Million) Forecast (2023 to 2033) by Solution

Table 23: Latin America Market Value (US$ Million) Analysis (2018 to 2022) by Enterprise Size

Table 24: Latin America Market Value (US$ Million) Forecast (2023 to 2033) by Enterprise Size

Table 25: Latin America Market Value (US$ Million) Analysis (2018 to 2022) by Deployment

Table 26: Latin America Market Value (US$ Million) Forecast (2023 to 2033) by Deployment

Table 27: Latin America Market Value (US$ Million) Analysis (2018 to 2022) by Industry

Table 28: Latin America Market Value (US$ Million) Forecast (2023 to 2033) by Industry

Table 29: Latin America Market Value (US$ Million) Analysis (2018 to 2022) by Country

Table 30: Latin America Market Value (US$ Million) Forecast (2023 to 2033) by Country

Table 31: Western Europe Market Value (US$ Million) Analysis (2018 to 2022) by Solution

Table 32: Western Europe Market Value (US$ Million) Forecast (2023 to 2033) by Solution

Table 33: Western Europe Market Value (US$ Million) Analysis (2018 to 2022) by Enterprise Size

Table 34: Western Europe Market Value (US$ Million) Forecast (2023 to 2033) by Enterprise Size

Table 35: Western Europe Market Value (US$ Million) Analysis (2018 to 2022) by Deployment

Table 36: Western Europe Market Value (US$ Million) Forecast (2023 to 2033) by Deployment

Table 37: Western Europe Market Value (US$ Million) Analysis (2018 to 2022) by Industry

Table 38: Western Europe Market Value (US$ Million) Forecast (2023 to 2033) by Industry

Table 39: Western Europe Market Value (US$ Million) Analysis (2018 to 2022) by Country

Table 40: Western Europe Market Value (US$ Million) Forecast (2023 to 2033) by Country

Table 41: Eastern Europe Market Value (US$ Million) Analysis (2018 to 2022) by Solution

Table 42: Eastern Europe Market Value (US$ Million) Forecast (2023 to 2033) by Solution

Table 43: Eastern Europe Market Value (US$ Million) Analysis (2018 to 2022) by Enterprise Size

Table 44: Eastern Europe Market Value (US$ Million) Forecast (2023 to 2033) by Enterprise Size

Table 45: Eastern Europe Market Value (US$ Million) Analysis (2018 to 2022) by Deployment

Table 46: Eastern Europe Market Value (US$ Million) Forecast (2023 to 2033) by Deployment

Table 47: Eastern Europe Market Value (US$ Million) Analysis (2018 to 2022) by Industry

Table 48: Eastern Europe Market Value (US$ Million) Forecast (2023 to 2033) by Industry

Table 49: Eastern Europe Market Value (US$ Million) Analysis (2018 to 2022) by Country

Table 50: Eastern Europe Market Value (US$ Million) Forecast (2023 to 2033) by Country

Table 51: South Asia and Pacific Market Value (US$ Million) Analysis (2018 to 2022) by Solution

Table 52: South Asia and Pacific Market Value (US$ Million) Forecast (2023 to 2033) by Solution

Table 53: South Asia and Pacific Market Value (US$ Million) Analysis (2018 to 2022) by Enterprise Size

Table 54: South Asia and Pacific Market Value (US$ Million) Forecast (2023 to 2033) by Enterprise Size

Table 55: South Asia and Pacific Market Value (US$ Million) Analysis (2018 to 2022) by Deployment

Table 56: South Asia and Pacific Market Value (US$ Million) Forecast (2023 to 2033) by Deployment

Table 57: South Asia and Pacific Market Value (US$ Million) Analysis (2018 to 2022) by Industry

Table 58: South Asia and Pacific Market Value (US$ Million) Forecast (2023 to 2033) by Industry

Table 59: South Asia and Pacific Market Value (US$ Million) Analysis (2018 to 2022) by Country

Table 60: South Asia and Pacific Market Value (US$ Million) Forecast (2023 to 2033) by Country

Table 61: East Asia Market Value (US$ Million) Analysis (2018 to 2022) by Solution

Table 62: East Asia Market Value (US$ Million) Forecast (2023 to 2033) by Solution

Table 63: East Asia Market Value (US$ Million) Analysis (2018 to 2022) by Enterprise Size

Table 64: East Asia Market Value (US$ Million) Forecast (2023 to 2033) by Enterprise Size

Table 65: East Asia Market Value (US$ Million) Analysis (2018 to 2022) by Deployment

Table 66: East Asia Market Value (US$ Million) Forecast (2023 to 2033) by Deployment

Table 67: East Asia Market Value (US$ Million) Analysis (2018 to 2022) by Industry

Table 68: East Asia Market Value (US$ Million) Forecast (2023 to 2033) by Industry

Table 69: East Asia Market Value (US$ Million) Analysis (2018 to 2022) by Country

Table 70: East Asia Market Value (US$ Million) Forecast (2023 to 2033) by Country

Table 71: Middle East and Africa Market Value (US$ Million) Analysis (2018 to 2022) by Solution

Table 72: Middle East and Africa Market Value (US$ Million) Forecast (2023 to 2033) by Solution

Table 73: Middle East and Africa Market Value (US$ Million) Analysis (2018 to 2022) by Enterprise Size

Table 74: Middle East and Africa Market Value (US$ Million) Forecast (2023 to 2033) by Enterprise Size

Table 75: Middle East and Africa Market Value (US$ Million) Analysis (2018 to 2022) by Deployment

Table 76: Middle East and Africa Market Value (US$ Million) Forecast (2023 to 2033) by Deployment

Table 77: Middle East and Africa Market Value (US$ Million) Analysis (2018 to 2022) by Industry

Table 78: Middle East and Africa Market Value (US$ Million) Forecast (2023 to 2033) by Industry

Table 79: Middle East and Africa Market Value (US$ Million) Analysis (2018 to 2022) by Country

Table 80: Middle East and Africa Market Value (US$ Million) Forecast (2023 to 2033) by Country

List of Charts

Figure 1: Global Market Value (US$ Million), 2018 to 2022

Figure 2: Global Market Value (US$ Million), 2023 to 2033

Figure 3: Global Market Size (US$ Million) and Y-o-Y Growth Rate from 2023 to 2033

Figure 4: Global Market Size and Y-o-Y Growth Rate from 2023 to 2033

Figure 5: Global Market Value Y-o-Y Growth Trend Analysis (2018 to 2033) by Solution

Figure 6: Global Market Value Share Analysis (2023 to 2033) by Solution

Figure 7: Global Market Attractiveness by Solution

Figure 8: Global Market Value Y-o-Y Growth Trend Analysis (2018 to 2033) by Enterprise Size

Figure 9: Global Market Value Share Analysis (2023 to 2033) by Enterprise Size

Figure 10: Global Market Attractiveness by Enterprise Size

Figure 11: Global Market Value Y-o-Y Growth Trend Analysis (2018 to 2033) by Deployment

Figure 12: Global Market Value Share Analysis (2023 to 2033) by Deployment

Figure 13: Global Market Attractiveness by Deployment

Figure 14: Global Market Value Y-o-Y Growth Trend Analysis (2018 to 2033) by Industry

Figure 15: Global Market Value Share Analysis (2023 to 2033) by Industry

Figure 16: Global Market Attractiveness by Industry

Figure 17: Global Market Value Y-o-Y Growth Trend Analysis (2018 to 2033) by Region

Figure 18: Global Market Value Share Analysis (2023 to 2033) by Region

Figure 19: Global Market Attractiveness by Region

Figure 20: North America Market Absolute $ Opportunity (US$ Million), 2018 to 2033

Figure 21: Latin America Market Absolute $ Opportunity (US$ Million), 2018 to 2033

Figure 22: Western Europe Market Absolute $ Opportunity (US$ Million), 2018 to 2033

Figure 23: Eastern Western Europe Market Absolute $ Opportunity (US$ Million), 2018 to 2033

Figure 24: East Asia Market Absolute $ Opportunity (US$ Million), 2018 to 2033

Figure 25: South Asia and Pacific Market Absolute $ Opportunity (US$ Million), 2018 to 2033

Figure 26: Middle East and Africa Market Absolute $ Opportunity (US$ Million), 2018 to 2033

Figure 27: North America Market Value (US$ Million), 2018 to 2022

Figure 28: North America Market Value (US$ Million), 2023 to 2033

Figure 29: North America Market Value Y-o-Y Growth Trend Analysis (2018 to 2033) by Solution

Figure 30: North America Market Value Share Analysis (2023 to 2033) by Solution

Figure 31: North America Market Attractiveness by Solution

Figure 32: North America Market Value Y-o-Y Growth Trend Analysis (2018 to 2033) by Enterprise Size

Figure 33: North America Market Value Share Analysis (2023 to 2033) by Enterprise Size

Figure 34: North America Market Attractiveness by Enterprise Size

Figure 35: North America Market Value Y-o-Y Growth Trend Analysis (2018 to 2033) by Deployment

Figure 36: North America Market Value Share Analysis (2023 to 2033) by Deployment

Figure 37: North America Market Attractiveness by Deployment

Figure 38: North America Market Value Y-o-Y Growth Trend Analysis (2018 to 2033) by Industry

Figure 39: North America Market Value Share Analysis (2023 to 2033) by Industry

Figure 40: North America Market Attractiveness by Industry

Figure 41: North America Market Value Y-o-Y Growth Trend Analysis (2018 to 2033) by Country

Figure 42: North America Market Value Share Analysis (2023 to 2033) by Country

Figure 43: North America Market Attractiveness by Country

Figure 44: USA Market Absolute $ Opportunity (US$ Million), 2018 to 2033

Figure 45: Canada Market Absolute $ Opportunity (US$ Million), 2018 to 2033

Figure 46: Mexico Market Absolute $ Opportunity (US$ Million), 2018 to 2033

Figure 47: Latin America Market Value (US$ Million), 2018 to 2022

Figure 48: Latin America Market Value (US$ Million), 2023 to 2033

Figure 49: Latin America Market Value Y-o-Y Growth Trend Analysis (2018 to 2033) by Solution

Figure 50: Latin America Market Value Share Analysis (2023 to 2033) by Solution

Figure 51: Latin America Market Attractiveness by Solution

Figure 52: Latin America Market Value Y-o-Y Growth Trend Analysis (2018 to 2033) by Enterprise Size

Figure 53: Latin America Market Value Share Analysis (2023 to 2033) by Enterprise Size

Figure 54: Latin America Market Attractiveness by Enterprise Size

Figure 55: Latin America Market Value Y-o-Y Growth Trend Analysis (2018 to 2033) by Deployment

Figure 56: Latin America Market Value Share Analysis (2023 to 2033) by Deployment

Figure 57: Latin America Market Attractiveness by Deployment

Figure 58: Latin America Market Value Y-o-Y Growth Trend Analysis (2018 to 2033) by Industry

Figure 59: Latin America Market Value Share Analysis (2023 to 2033) by Industry

Figure 60: Latin America Market Attractiveness by Industry

Figure 61: Latin America Market Value Y-o-Y Growth Trend Analysis (2018 to 2033) by Country

Figure 62: Latin America Market Value Share Analysis (2023 to 2033) by Country

Figure 63: Latin America Market Attractiveness by Country

Figure 64: Brazil Market Absolute $ Opportunity (US$ Million), 2018 to 2033

Figure 65: Chile Market Absolute $ Opportunity (US$ Million), 2018 to 2033

Figure 66: Rest of Latin America Market Absolute $ Opportunity (US$ Million), 2018 to 2033

Figure 67: Western Europe Market Value (US$ Million), 2018 to 2022

Figure 68: Western Europe Market Value (US$ Million), 2023 to 2033

Figure 69: Western Europe Market Value Y-o-Y Growth Trend Analysis (2018 to 2033) by Solution

Figure 70: Western Europe Market Value Share Analysis (2023 to 2033) by Solution

Figure 71: Western Europe Market Attractiveness by Solution

Figure 72: Western Europe Market Value Y-o-Y Growth Trend Analysis (2018 to 2033) by Enterprise Size

Figure 73: Western Europe Market Value Share Analysis (2023 to 2033) by Enterprise Size

Figure 74: Western Europe Market Attractiveness by Enterprise Size

Figure 75: Western Europe Market Value Y-o-Y Growth Trend Analysis (2018 to 2033) by Deployment

Figure 76: Western Europe Market Value Share Analysis (2023 to 2033) by Deployment

Figure 77: Western Europe Market Attractiveness by Deployment

Figure 78: Western Europe Market Value Y-o-Y Growth Trend Analysis (2018 to 2033) by Industry

Figure 79: Western Europe Market Value Share Analysis (2023 to 2033) by Industry

Figure 80: Western Europe Market Attractiveness by Industry

Figure 81: Western Europe Market Value Y-o-Y Growth Trend Analysis (2018 to 2033) by Country

Figure 82: Western Europe Market Value Share Analysis (2023 to 2033) by Country

Figure 83: Western Europe Market Attractiveness by Country

Figure 84: Germany Market Absolute $ Opportunity (US$ Million), 2018 to 2033

Figure 85: Italy Market Absolute $ Opportunity (US$ Million), 2018 to 2033

Figure 86: France Market Absolute $ Opportunity (US$ Million), 2018 to 2033

Figure 87: UK Market Absolute $ Opportunity (US$ Million), 2018 to 2033

Figure 88: Spain Market Absolute $ Opportunity (US$ Million), 2018 to 2033

Figure 89: BENELUX Market Absolute $ Opportunity (US$ Million), 2018 to 2033

Figure 90: Russia Market Absolute $ Opportunity (US$ Million), 2018 to 2033

Figure 91: Rest of Western Europe Market Absolute $ Opportunity (US$ Million), 2018 to 2033

Figure 92: Eastern Europe Market Value (US$ Million), 2018 to 2022

Figure 93: Eastern Europe Market Value (US$ Million), 2023 to 2033

Figure 94: Eastern Europe Market Value Y-o-Y Growth Trend Analysis (2018 to 2033) by Solution

Figure 95: Eastern Europe Market Value Share Analysis (2023 to 2033) by Solution

Figure 96: Eastern Europe Market Attractiveness by Solution

Figure 97: Eastern Europe Market Value Y-o-Y Growth Trend Analysis (2018 to 2033) by Enterprise Size

Figure 98: Eastern Europe Market Value Share Analysis (2023 to 2033) by Enterprise Size

Figure 99: Eastern Europe Market Attractiveness by Enterprise Size

Figure 100: Eastern Europe Market Value Y-o-Y Growth Trend Analysis (2018 to 2033) by Deployment

Figure 101: Eastern Europe Market Value Share Analysis (2023 to 2033) by Deployment

Figure 102: Eastern Europe Market Attractiveness by Deployment

Figure 103: Eastern Europe Market Value Y-o-Y Growth Trend Analysis (2018 to 2033) by Industry

Figure 104: Eastern Europe Market Value Share Analysis (2023 to 2033) by Industry

Figure 105: Eastern Europe Market Attractiveness by Industry

Figure 106: Eastern Europe Market Value Y-o-Y Growth Trend Analysis (2018 to 2033) by Country

Figure 107: Eastern Europe Market Value Share Analysis (2023 to 2033) by Country

Figure 108: Eastern Europe Market Attractiveness by Country

Figure 109: Russia Market Absolute $ Opportunity (US$ Million), 2018 to 2033

Figure 110: Hungary Market Absolute $ Opportunity (US$ Million), 2018 to 2033

Figure 111: Poland Market Absolute $ Opportunity (US$ Million), 2018 to 2033

Figure 112:Balakan & Baltics Market Absolute $ Opportunity (US$ Million), 2018 to 2033

Figure 113: Rest of Eastern Europe Market Absolute $ Opportunity (US$ Million), 2018 to 2033

Figure 114: East Asia Market Value (US$ Million), 2018 to 2022

Figure 115: East Asia Market Value (US$ Million), 2023 to 2033

Figure 116: East Asia Market Value Y-o-Y Growth Trend Analysis (2018 to 2033) by Solution

Figure 117: East Asia Market Value Share Analysis (2023 to 2033) by Solution

Figure 118: East Asia Market Attractiveness by Solution

Figure 119: East Asia Market Value Y-o-Y Growth Trend Analysis (2018 to 2033) by Enterprise Size

Figure 120: East Asia Market Value Share Analysis (2023 to 2033) by Enterprise Size

Figure 121: East Asia Market Attractiveness by Enterprise Size

Figure 122: East Asia Market Value Y-o-Y Growth Trend Analysis (2018 to 2033) by Deployment

Figure 123: East Asia Market Value Share Analysis (2023 to 2033) by Deployment

Figure 124: East Asia Market Attractiveness by Deployment

Figure 125: East Asia Market Value Y-o-Y Growth Trend Analysis (2018 to 2033) by Industry

Figure 126: East Asia Market Value Share Analysis (2023 to 2033) by Industry

Figure 127: East Asia Market Attractiveness by Industry

Figure 128: East Asia Market Value Y-o-Y Growth Trend Analysis (2018 to 2033) by Country

Figure 129: East Asia Market Value Share Analysis (2023 to 2033) by Country

Figure 130: East Asia Market Attractiveness by Country

Figure 131: China Market Absolute $ Opportunity (US$ Million), 2018 to 2033

Figure 132: Japan Market Absolute $ Opportunity (US$ Million), 2018 to 2033

Figure 133: South Korea Market Absolute $ Opportunity (US$ Million), 2018 to 2033

Figure 134: South Asia and Pacific Market Value (US$ Million), 2018 to 2022

Figure 135: South Asia and Pacific Market Value (US$ Million), 2023 to 2033

Figure 136: South Asia and Pacific Market Value Y-o-Y Growth Trend Analysis (2018 to 2033) by Solution

Figure 137: South Asia and Pacific Market Value Share Analysis (2023 to 2033) by Solution

Figure 138: South Asia and Pacific Market Attractiveness by Solution

Figure 139: South Asia and Pacific Market Value Y-o-Y Growth Trend Analysis (2018 to 2033) by Enterprise Size

Figure 140: South Asia and Pacific Market Value Share Analysis (2023 to 2033) by Enterprise Size

Figure 141: South Asia and Pacific Market Attractiveness by Enterprise Size

Figure 142: South Asia and Pacific Market Value Y-o-Y Growth Trend Analysis (2018 to 2033) by Deployment

Figure 143: South Asia and Pacific Market Value Share Analysis (2023 to 2033) by Deployment

Figure 144: South Asia and Pacific Market Attractiveness by Deployment

Figure 145: South Asia and Pacific Market Value Y-o-Y Growth Trend Analysis (2018 to 2033) by Industry

Figure 146: South Asia and Pacific Market Value Share Analysis (2023 to 2033) by Industry

Figure 147: South Asia and Pacific Market Attractiveness by Industry

Figure 148: South Asia and Pacific Market Value Y-o-Y Growth Trend Analysis (2018 to 2033) by Country

Figure 149: South Asia and Pacific Market Value Share Analysis (2023 to 2033) by Country

Figure 150: South Asia and Pacific Market Attractiveness by Country

Figure 151: India Market Absolute $ Opportunity (US$ Million), 2018 to 2033

Figure 152: ASEAN Market Absolute $ Opportunity (US$ Million), 2018 to 2033

Figure 153: Australia & New Zealand Market Absolute $ Opportunity (US$ Million), 2018 to 2033

Figure 154: Rest of South Asia and Pacific Market Absolute $ Opportunity (US$ Million), 2018 to 2033

Figure 155: Middle East and Africa Market Value (US$ Million), 2018 to 2022

Figure 156: Middle East and Africa Market Value (US$ Million), 2023 to 2033

Figure 157: Middle East and Africa Market Value Y-o-Y Growth Trend Analysis (2018 to 2033) by Solution

Figure 158: Middle East and Africa Market Value Share Analysis (2023 to 2033) by Solution

Figure 159: Middle East and Africa Market Attractiveness by Solution

Figure 160: Middle East and Africa Market Value Y-o-Y Growth Trend Analysis (2018 to 2033) by Enterprise Size

Figure 161: Middle East and Africa Market Value Share Analysis (2023 to 2033) by Enterprise Size

Figure 162: Middle East and Africa Market Attractiveness by Enterprise Size

Figure 163: Middle East and Africa Market Value Y-o-Y Growth Trend Analysis (2018 to 2033) by Deployment

Figure 164: Middle East and Africa Market Value Share Analysis (2023 to 2033) by Deployment

Figure 165: Middle East and Africa Market Attractiveness by Deployment

Figure 166: Middle East and Africa Market Value Y-o-Y Growth Trend Analysis (2018 to 2033) by Industry

Figure 167: Middle East and Africa Market Value Share Analysis (2023 to 2033) by Industry

Figure 168: Middle East and Africa Market Attractiveness by Industry

Figure 169: Middle East and Africa Market Value Y-o-Y Growth Trend Analysis (2018 to 2033) by Country

Figure 170: Middle East and Africa Market Value Share Analysis (2023 to 2033) by Country

Figure 171: Middle East and Africa Market Attractiveness by Country

Figure 172: Saudi Arabia Market Absolute $ Opportunity (US$ Million), 2018 to 2033

Figure 173: UAE Market Absolute $ Opportunity (US$ Million), 2018 to 2033

Figure 174: Turkiye Market Absolute $ Opportunity (US$ Million), 2018 to 2033

Figure 175: South Africa Market Absolute $ Opportunity (US$ Million), 2018 to 2033

Figure 176: Rest of Middle East and Africa Market Absolute $ Opportunity (US$ Million), 2018 to 2033

Recommendations

Technology

Security Screening Market

Published : January 2024

Technology

Digital Forensics Market

Published : January 2024

Technology

Embedded AI Market

Published : January 2024

Technology

Open Banking Market

Published : January 2024

Explore Technology Insights

View Reports

Insider Threat Protection Market