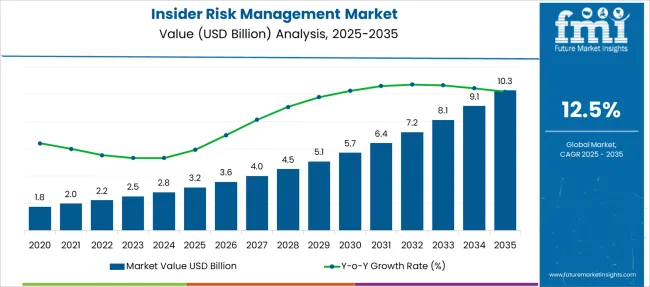
The Insider Risk Management Market is estimated to be valued at USD 3.2 billion in 2025 and is projected to reach USD 10.3 billion by 2035, registering a compound annual growth rate (CAGR) of 12.5% over the forecast period.
| Metric | Value |
|---|---|
| Insider Risk Management Market Estimated Value in (2025 E) | USD 3.2 billion |
| Insider Risk Management Market Forecast Value in (2035 F) | USD 10.3 billion |
| Forecast CAGR (2025 to 2035) | 12.5% |
The insider risk management market is witnessing strong momentum as enterprises increasingly focus on data security, user behavior monitoring, and regulatory compliance. The shift toward hybrid work models has expanded the threat landscape, driving demand for advanced tools capable of detecting internal threats from both malicious and negligent insiders.
Regulatory frameworks such as GDPR, HIPAA, and financial sector compliance mandates have further necessitated investments in proactive monitoring solutions. Real-time analytics, AI-driven risk scoring, and behavioral baselining are becoming integral features as companies seek to prevent data loss, IP theft, and policy violations.
The market is also being shaped by heightened board-level attention to cybersecurity governance, particularly in sectors dealing with sensitive data. Moving forward, integration of insider risk management with enterprise security platforms and SIEM systems is expected to accelerate adoption across verticals.
The market is segmented by Enterprise Size and Industry and region. By Enterprise Size, the market is divided into Large Enterprises and Small & Mid-size Enterprises. In terms of Industry, the market is classified into Finance, Healthcare, Government, Education, Manufacturing, and Others. Regionally, the market is classified into North America, Latin America, Western Europe, Eastern Europe, Balkan & Baltic Countries, Russia & Belarus, Central Asia, East Asia, South Asia & Pacific, and the Middle East & Africa.
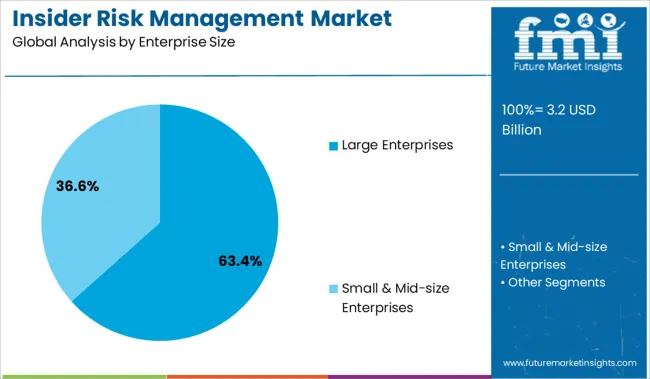
Large enterprises are projected to account for 63.4% of the total insider risk management market revenue in 2025, making them the leading enterprise size segment. This dominance is being driven by the scale and complexity of operations within large organizations, which amplify exposure to internal vulnerabilities.
The need for comprehensive identity and access management, privileged user tracking, and anomaly detection across distributed environments has necessitated robust insider risk frameworks. Investments in employee monitoring software, policy enforcement automation, and machine learning-based behavior analysis are higher among large enterprises due to their expanded IT infrastructure and regulatory obligations.
Additionally, the growing volume of remote workforces and third-party contractors has prompted large firms to deploy scalable, centralized risk management platforms to mitigate internal threats effectively.
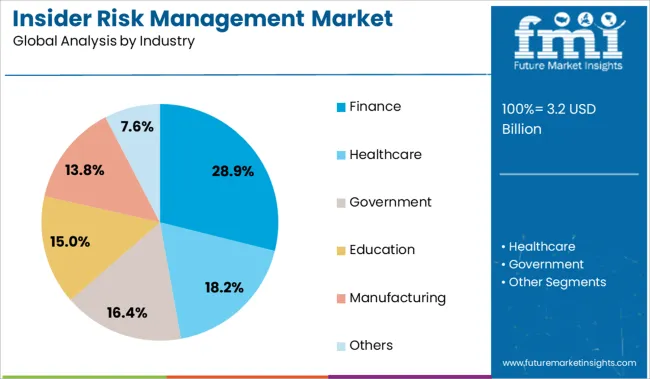
The finance industry is expected to contribute 28.9% of the total market revenue in 2025, positioning it as the leading vertical in the insider risk management space. This is being driven by the industry’s heightened exposure to sensitive customer data, financial records, and intellectual property.
Regulatory compliance obligations, including SOX, GLBA, and PCI DSS, have made internal threat detection and response a top security priority. Financial institutions are increasingly adopting insider risk tools to monitor high-privilege users, prevent fraudulent activity, and ensure secure communication channels.
Integration with transaction monitoring systems, real-time alerts, and audit-ready reporting capabilities are further enhancing adoption. As financial operations continue to digitize and threat actors grow more sophisticated, insider risk management is becoming a foundational component of cybersecurity architecture within the finance sector.
Numerous manufacturers provide advanced insider risk management software. This software connects with several signals to detect insider risks comprising data leakage, IP theft, and security violations that may be intentional or unintentional.
Consumers can produce policies to manage security and compliance through insider risk management. Users are pseudonymized by default, and audit logs and role-based access controls are in place to ensure user-level privacy because the system was built with privacy in mind.
Insider risk management tools offer insider risk management workflow which permits users to detect, investigate, and take action to address internal threats in the organization. With focused policy templates, case management Software, and alert tools, users can utilize actionable insights to rapidly detect and act on risk behavior.
The insider risk management market demand is expected to increase at 12.5% CAGR between 2025 and 2035 in comparison with the 10.4% CAGR registered from 2020 to 2024. Greater and more access to manage, control, and exchange data across many platforms and services is given to employees.
In order to detect and mitigate overall business risks while still adhering to legal obligations and employee privacy standards, organizations frequently lack the tools and resources necessary. These risks could include harmful information leaks to the outside world and information theft by departing staff.
A program for preventing insider threats includes thorough reporting, monitoring, and scoring systems. This makes it easier for user security and forensic personnel to identify, monitor, and manage various insider threat types. Continuous risk grading is carried out by different suppliers based on recent and historical behavior.
Real-time risk-prioritized notifications for incident analysis may result from it. Additionally, these dynamic risk assessments can trigger an automatic risk response workflow. Therefore, the advantages offered by insider risk management are expected to drive the market demand.
Managing and lowering risk in organizations starts with understanding the kind of risks found in the modern workplace. Some risks are operated by external events and user activities that can be avoided and lowered.
Insider risk management policies are utilized in financial services which are built utilizing pre-defined policy standards that identify which triggering risk and events indicators in financial services are examined. These conditions comprise who is covered by the policy, how risk indicators are utilized for alerts, which services are prioritized, and the time span of the monitoring.
Insider risk management is utilized in the finance industry to protect financial institutions from leaks of important data and data spillage, intellectual property theft, fraud, regulatory compliance violations, confidentiality violations, insider trading, etc. Thus, the benefits offered by insider risk management in the finance industry are expected to drive market demand.
North America region is dominating the worldwide market with a share of around 32.9% in the year 2024. Moreover, South Asia and the Pacific region are expected to register strong growth in the market, exhibiting a CAGR of around 22.5% during the forecast period.
Moreover, Europe is estimated to be the second fastest-growing region in the insider risk management market. This region is predicted to grow with a market share of around 20.7% during the forecast period. In the Europe region hospitals, pharma, and biotech firm’s companies are entrusted to prevent sensitive details, comprising valuable proprietary research, personal patient data, etc., for protecting the data insider risk management software is required in the healthcare industry this factor is expected to drive the market demand.
Increasing usage of insider risk management solutions in the manufacturing sector is expected to drive market demand. The manufacturing industry reported the largest number of insider attacks among companies in the critical infrastructure sector.
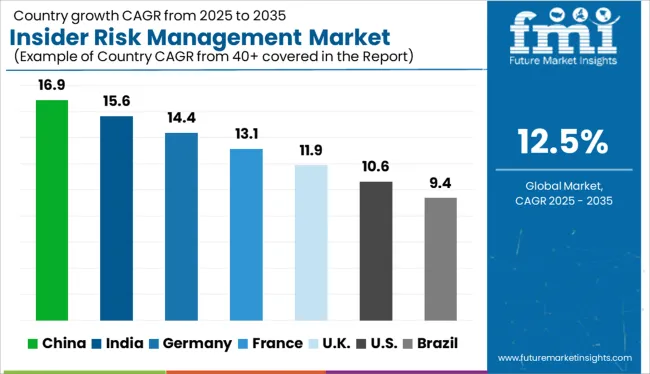
Thus, the increasing insider attacks drive the insider risk management solution demand in India. Due to these factors, sales in India are predicted to increase at the CAGR of 24.1% during the predicted period 2025 to 32.
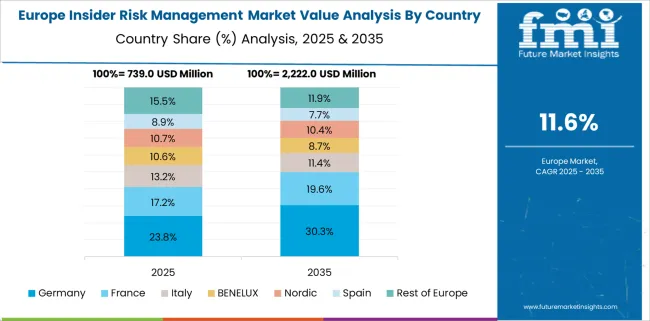
Insider risk management solution is highly used in Germany in the financial services, manufacturing, and healthcare sector industry to protect important data and lower internal risk by identifying, acting, and investigating malicious activities inside the organization. Thus, the benefits offered by
insider risk management are anticipated to drive the market demand. According to the analysis, the nation held close to 12.5% of the market share for the region of Europe in 2024.
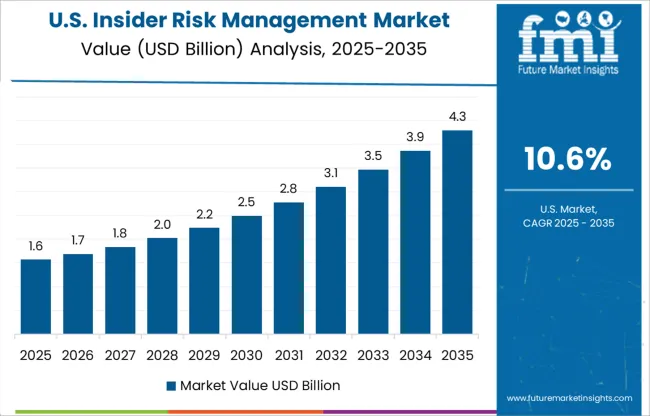
In the market for insider risk management, the USA held a 23.4% share of the North American market in 2024. The presence of major vendors like Microsoft, Splunk Inc., Forcepoint, etc. is expected to drive the market demand.
The benefits offered by the insider risk management solution to monitor user activity in real-time, streamline audits and investigation, and protects the workforce is expected to drive the market demand. It is highly used in the financial services industry to protect the data this factor is contributing to the market growth.
Insider risk management software is installed on the on-premises of organizations to protect important data against malicious activities. Insider risk management helps organizations protect, identify, and contain risks.
Thus, the insider risk management solution is highly installed in the on-premises segment and is expected to drive the market demand. As a result, the on-premises accounted for 68.0% market share of the solution segment in 2024.
Large enterprises utilize insider risk management to protect important data from insider attacks and data breaches. Insider risk management policies are produced utilizing predefined policies and templates that define what activating events and risk indicators are inspected in large enterprises.
Thus, the growing usage of insider risk management in large enterprises is expected to drive market demand. The large enterprise segment held a 62.7% market share of the enterprise size segment in 2024.
The financial industry is the major target for hackers and ransomware attacks, the finance industry is therefore utilizing insider risk management solutions to prevent their critical data from inside attacks. Thus, the advantages offered by the insider risk management solution are expected to drive segment growth. As per the analysis, the finance segment is expected to grow at a CAGR of 17.3% during the forecast period from 2025 to 2035.
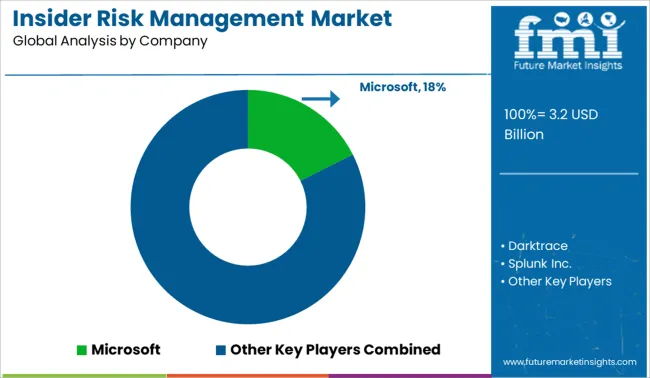
Insider risk management market major vendors are concentrating on strategic partnerships with other crucial players to develop technologically advanced insider risk management solutions for several applications to serve their consumers.
| Attribute | Details |
|---|---|
| Market value in 2025 | USD 3.2 billion |
| Market CAGR 2025 to 2035 | 12.5% |
| Share of top 5 players | Around 35% |
| Forecast Period | 2025 to 2035 |
| Historical Data Available for | 2020 to 2024 |
| Market Analysis | USD Million for Value |
| Key Regions Covered | North America; Latin America; Europe; East Asia; South Asia & Pacific; and the Middle East & Africa |
| Key Countries Covered | USA, Canada, Germany, United Kingdom, France, Italy, Spain, Russia, China, Japan, South Korea, India, Malaysia, Indonesia, Singapore, Australia & New Zealand, GCC Countries, Turkey, North Africa, and South Africa |
| Key Segments Covered | The solution, Enterprise Size, Industry, and Region |
| Key Companies Profiled | Darktrace; Microsoft; Splunk Inc.; Forcepoint; Varonis; Teramind Inc.; Exabeam; Proofpoint; Elevate Security; Cyberhaven; Ekran System; GURUCUL; Clearspeed; DTEX Systems Inc.; Others |
| Report Coverage | Market Forecast, Company Share Analysis, Competition Intelligence, Drivers, Restraints, Opportunities, and Threats Analysis, Market Dynamics and Challenges, and Strategic Growth Initiatives |
| Customization & Pricing | Available upon Request |
The global insider risk management market is estimated to be valued at USD 3.2 billion in 2025.
The market size for the insider risk management market is projected to reach USD 10.3 billion by 2035.
The insider risk management market is expected to grow at a 12.5% CAGR between 2025 and 2035.
The key product types in insider risk management market are large enterprises and small & mid-size enterprises.
In terms of industry, finance segment to command 28.9% share in the insider risk management market in 2025.


Full Research Suite comprises of:
Market outlook & trends analysis
Interviews & case studies
Strategic recommendations
Vendor profiles & capabilities analysis
5-year forecasts
8 regions and 60+ country-level data splits
Market segment data splits
12 months of continuous data updates
DELIVERED AS:
PDF EXCEL ONLINE
Insider Threat Protection Market Analysis Size and Share Forecast Outlook 2025 to 2035
Risk-based Authentication (RBA) Market
Risk Management Market Size and Share Forecast Outlook 2025 to 2035
Frisket Masking Film Market
Legal, Risk and Compliance Solution Market Forecast and Outlook 2025 to 2035
Digital Risk Protection Platform Market Analysis by Solution, Enterprise Size, Industry and Region Through 2035
Global Clinical Risk Grouping Solution Market Insights – Trends & Forecast 2024-2034
Third-Party Risk Management Market Trends - Growth & Forecast through 2034
Construction Risk Assessment Software Market Size and Share Forecast Outlook 2025 to 2035
AI-Driven Treasury & Risk Management – Future-Proofing Finance
Financial Services Operational Risk Management Solution Market
Tax Management Market Size and Share Forecast Outlook 2025 to 2035
Key Management as a Service Market
Cash Management Supplies Packaging Market Size and Share Forecast Outlook 2025 to 2035
Fuel Management Software Market Size and Share Forecast Outlook 2025 to 2035
SBOM Management and Software Supply Chain Compliance Market Analysis - Size, Share, and Forecast Outlook 2025 to 2035
Case Management Software (CMS) Market Size and Share Forecast Outlook 2025 to 2035
Farm Management Software Market Size and Share Forecast Outlook 2025 to 2035
Lead Management Market Size and Share Forecast Outlook 2025 to 2035
Pain Management Devices Market Growth - Trends & Forecast 2025 to 2035

Thank you!
You will receive an email from our Business Development Manager. Please be sure to check your SPAM/JUNK folder too.
Chat With
MaRIA