CBRN Protection Equipment Market
An Analysis of CBRN Protection Equipment Market by End-Use Applications in Sectors like Military, Civil Defence and Security, Nuclear Power Plants and Sites, Disaster Management
Rising geopolitical turbulence, threats from terrorist groups, hostile neighboring countries, and growing regional conflicts among nations are anticipated to facilitate growth in the market during the forecast period
CBRN Protection Equipment Market Snapshot (2023 to 2033)
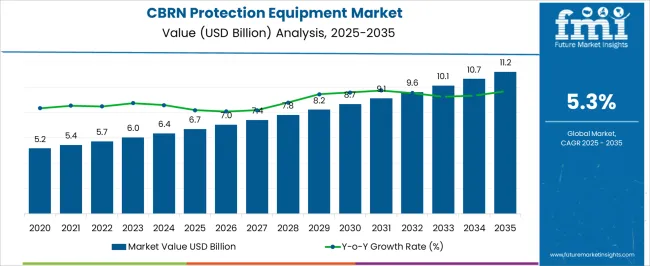
The global CBRN protection equipment market is anticipated at US$ 5.7 billion in 2022. Demand is likely to remain high for CBRN protection equipment during the assessment period. This is due to the increased application in mining operations and garnering US$ 10.3 billion in 2033, recording a CAGR of 5.6% from 2023 to 2033. The market is likely to secure US$ 6.0 billion in 2023.
Data Points | Key Statistics |
---|---|
CBRN protection equipment Market Size Value in 2023 | US$ 6.0 billion |
CBRN protection equipment Market Forecast Value in 2033 | US$ 10.3 billion |
Global Growth Rate | 5.6% |
Forecast Period | 2023 to 2033 |
Key Factors Shaping the Demand Outlook of the CBRN Protection Equipment Industry :
- Increasing stringent safety regulations to augment the growth of the market
- Increasing security concerns across the globe are expected to spur the market growth
- Expansion of military capabilities to boost the market growth
- Growing advances in technology are expected to create new growth prospects for CBRN protective equipment manufacturers.
Don't pay for what you don't need
Customize your report by selecting specific countries or regions and save 30%!
CBRN Protection Equipment Market Revenue Analysis from 2018 to 2022 Vs Market Outlook for 2023 to 2033
Historical CAGR (2018 to 2022) | 4.7% |
---|---|
Forecasted CAGR (2023 to 2033) | 5.6% |
Sales of CBRN protection equipment increased at 4.7% CAGR between 2018 and 2022 with countries such as the United States, Mexico, China, India, and the United Kingdom accounting for a substantial portion of the global market.
Advanced training programs for the army and detecting and responding to incidents or accidents effectively will require securing CBRN materials. The demand for innovative CBRN materials is increasing by governments.
The demand for integrated collective protection equipment (COLPRO) in military camps is also increasing for military operations. This ongoing trend of CBRN protection equipment is forecast to enable growth in the global CBRN protection equipment market. The CBRN protection equipment market is projected to grow at a 5.6% CAGR during the forecast period of 2023 to 2033.
Which Factors Will Drive Demand For CBRN Protection Equipment In Various End-use Industries?
Use Of Chemical and Biological Weapons is Likely to Boost the Market Growth
Chemical weapons have been used often in recent years. For example, the recent use of chemical weapon attacks between 2012 and 2018 in Syria, where numerous people were killed. Such activities have increased the demand for CBRN protection equipment such as CBRN suits, masks, CBRN filtration systems, and others.
For instance, in February 2017, North Korean agents used a nerve agent (VX) in Kuala Lumpur Airport, Malaysia. To cope with this situation, manufacturers are offering modern protective equipment along with filtration system and advanced features that provide a higher degree of protection.
Biological warfare agents are extremely dangerous as small amounts of content are delivered by breathing or skin adsorption, which can cause extreme health issues and it is contagious. Numerous manufacturers are developing new CBRN protection equipment that is forecasted for the growth of the CBRN protection equipment market to secure common people from such biological agents.
What is Limiting the Sales of CBRN Protective Equipment?
High Cost of Equipment May Hamper the Market Growth
The high costs of equipment and services as well as the government’s relatively low expenditure on CBRN security for implementing top-notch security services. The expense of restraining numerous law enforcement and military organizations with vast amounts of capital, equipment, and labor is very high, which restrains the growth of the CBRN security market.
Emergency Medical Services (EMS) around the world have taken rigorous CBRN protection measures to prioritize patient safety. The management of possible chemical disasters brought on by either industrial accidents or terrorist activity falls under the purview of EMS.
The Hazardous Substances Management Division, which oversees the Ministry for the Management of Chemical Emergencies and Hazardous Substances in India, has implemented strict CBRN defense measures, which are projected to drive the market forward in the approaching years.
Comparative View of CBRN Protection Equipment Markets
Global CBRN Protection Equipment Market:
Attributes | Global CBRN Protection Equipment Market |
---|---|
CAGR (2023 to 2033) | 5.6% |
Market Value (2033) | US$ 10.3billion |
Growth Factors | The increasing geopolitical tensions, conflicts, and the threat of terrorism influence the demand for CBRN protection equipment in the forecast period. |
Opportunities | The increasing technological advances offer opportunities for market expansion in the forecast period. |
Global Security & Surveillance Equipment Market:
Attributes | Global Security & Surveillance Equipment Market |
---|---|
CAGR (2023 to 2033) | 4.8% |
Market Value (2033) | US$ 32.1 billion |
Growth Factors | The growing global security concern, theft prevention, and safety concern is expected to boost market growth in the forecast period. |
Opportunities | The growing expansion of smart cities, and the construction of big infrastructure, offer significant opportunities for market expansion in the forecast period. |
Global Compact Power Equipment Rental Market:
Attributes | Global Compact Power Equipment Rental Market |
---|---|
CAGR (2023 to 2033) | 6.7% |
Market Value (2033) | US$ 20.4 billion |
Growth Factors | The increasing demand for power tools in developing countries is expected to boost market growth during the forecast period. |
Opportunities | The increasing construction and infrastructural development is expected to offer significant opportunities for expansion in the coming time |
Get the data you need at a Fraction of the cost
Personalize your report by choosing insights you need
and save 40%!
Country-Wise Insights
What Is the China CBRN Protection Equipment Market Demand Outlook?
Increased Military Spending in China to Boost the Market Demand
As per FMI, China is projected to account for around 52.4% of the East Asia market by the end of 2029. China has become the world’s second-largest military spender, allocated $250 billion to the military in 2018, which accounted for 14 percent of global spending.
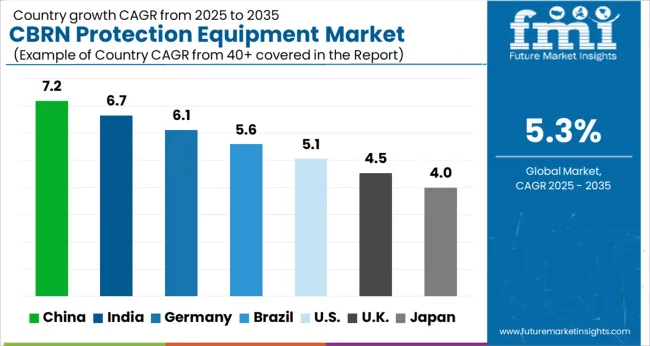
Military spending in China has increased substantially owing to the strengthening of armed forces. The sector’s spending in 2018 was almost 10 times higher than in 1994. China as an emerging country will offer prime opportunities for the growth of the CBRN protection equipment market in the incoming years. Hence, China is anticipated to grow with a remarkable CAGR of 5.5% during the forecast period 2023 to 2033.
Why is the Demand for CBRN Protection Equipment Rising in the United States?
High Defence Spending to Drive the Market Growth in the United States
The United States currently dominates the world in terms of military expenditure. It accounted for 36 percent of the global military spending in 2018. The country spent almost as much on its military in 2018 as the next eight highest spenders combined. Military spending of the United States in year 2018 was 19% lower as compared to the year 2010.
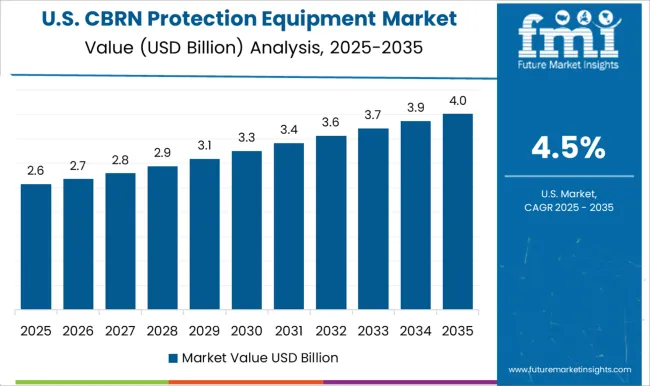
The recent growth in global tensions between Iran and the United States has projected to propel the demand for CBRN Protection Equipment over the forthcoming years. The adoption of CBRN protection equipment will continue growing in the country due to rising geopolitical tensions. The United States is projected to account for approximately 87% of the North America CBRN protection equipment market at the end of 2033.
How big is the Opportunity in Germany?
Increased Security Concerns to Drive the Market Demand
Germany is estimated to hold 18.7% of the Europe CBRN protection equipment market in 2033. Germany was the third-largest military spender in Western Europe with a total military spending of about 1.2 percent of its GDP in 2020. Military spending in Germany was 9.0 % higher than in 2009.
Germany aims to play a greater role in global security and plans, which has estimated to increase its military expenditure to 1.5 percent of GDP by 2025 which is expected to boost the growth of the CBRN protection equipment market in the coming years.
Category-Wise Insights
Which is the Leading Product Type in CRBN Protective Equipment Market?
Sales of Personal Protective Equipment Increasing
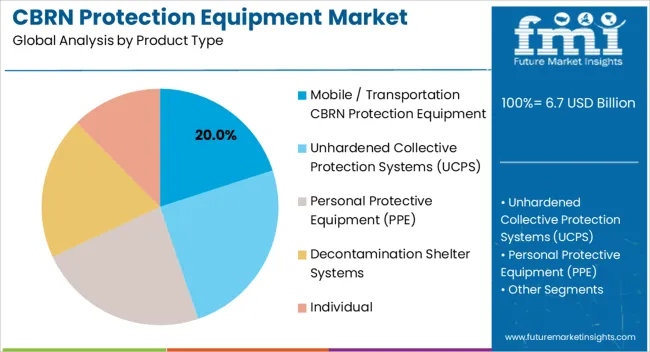
Among product types, the sales of personal protective equipment are expected to hold a dominant share of 53.4% of the global market by the end of 2029. Personal protective equipment includes muff, gloves, coveralls, vests and body suit. This segment is estimated to maintain its dominance throughout the forecast period which is attributable to its increasing usage in healthcare settings such as clinics, labs, and others.
Which Category Will Create a Remarkable Impact on The CBRN Protection Equipment Market Growth?
C-Decontamination Will Generate High Revenue in CBRN Protective Equipment Market
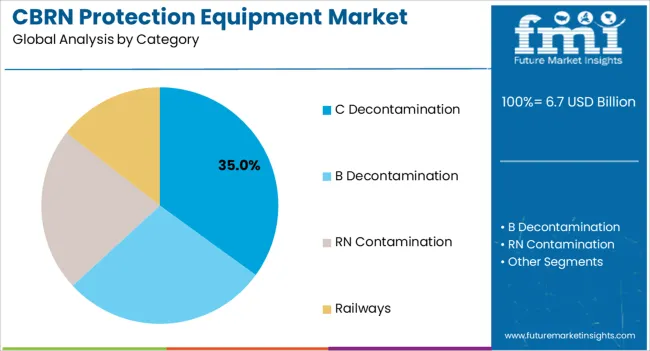
On the basis of category type, C decontamination is anticipated to hold leading share of above 80.5% in 2023 and grow exponentially in the coming years. In response to the increasing chemical hazards across the globe, the C decontamination segment is likely to remain dominant during the forecast period. In terms of value, the C decontamination segment is anticipated to grow at a CAGR of 5.4% during the forecast period due to more feasibility.
Who is the Leading End User of CBRN Protection Equipment?
Military Segment to Show Exponential Demand
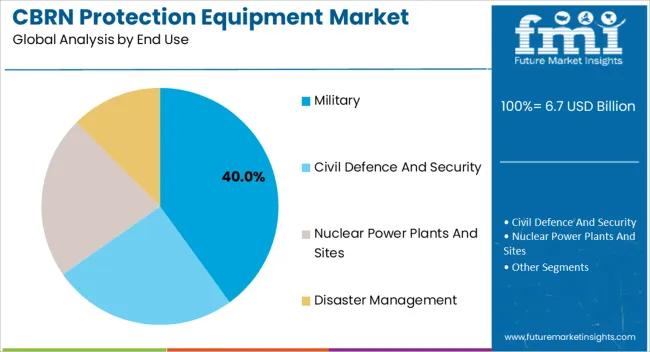
The military segment is projected to dominate the CBRN protection equipment market in terms of market share and Y-o-Y growth during the forecast period. The military segment is projected to grow at a CAGR of 5.5% over the forecast period of 2023 to 2033 and is expected to account for 79.5% market revenue share in 2023.
This segment is expected to dominate the market owing to the growing adoption of advanced defense solutions and military drones and the increasing defense budget worldwide.
Competitive Landscape
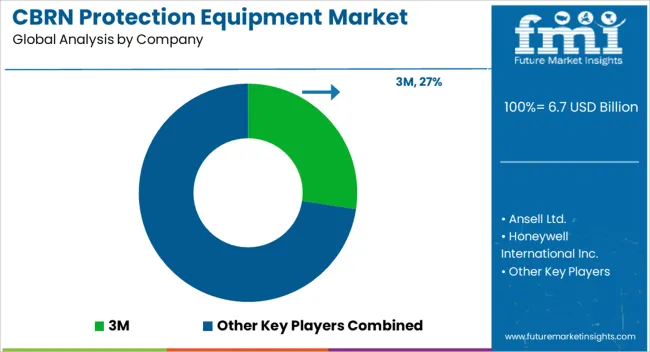
Some of the leading players operating in the CBRN protection equipment market are 3M, Ansell Ltd, Honeywell, AirBoss of America Corp, and Indra among others. Market players are currently focusing on increasing customer retention and strengthening their relationships with existing customers. Long-term relationships with customers and vendors can enable companies to acquire long-term contracts for the deployment of CBRN protection equipment.
For instance:
- In May 2019, AirBoss of America Corporation announced the creation of Airboss Defense Group through the merger of Airboss Defense and Critical Solutions International, Inc. in order to increase its diversified product offerings.
- 3M, a diversified technology company, has been actively involved in the development of CBRN protection solutions. They have introduced innovative respiratory protection products, such as the 3M Scott AV-3000 HT facepiece and the 3M Scott E-Z Flo C5 regulator, which offer improved performance, comfort, and ease of use. 3M has also invested in research and development to enhance the effectiveness and durability of their CBRN protection equipment.
Report Scope
Attribute | Details |
---|---|
Growth Rate | CAGR of 5.6% from 2023 to2033 |
Market Value in 2023 | US$ 6 billion |
Market Value in 2033 | US$ 10.3 billion |
Base Year for Estimation | 2022 |
Historical Data | 2018 to 2022 |
Forecast Period | 2023 to 2033 |
Quantitative Units | Revenue in US$ Billion and CAGR from 2023 to 2033 |
Report Coverage | Revenue Forecast, Company Ranking, Competitive Landscape, Growth Factors, Trends, and Pricing Analysis |
Segments Covered |
|
Regions Covered |
|
Key Countries Profiled |
|
Key Companies Profiled |
|
CBRN Protection Equipment Markey by Category
By Product Type:
- Mobile / Transportation CBRN Protection Equipment
- Air Purification Units
- Integrated Colpro Systems
- Protective Entrances
- ROV Bags
- Medical Transportation Sets
- Unhardened Collective Protection Systems (UCPS)
- Personal Protective Equipment (PPE)
- Decontamination Shelter Systems
- Individual
- 2 Line
- 3 Line
- 4 Line
By Category:
- C Decontamination
- B Decontamination
- RN Contamination
- Railways
By End Use:
- Military
- Civil Defence and Security
- Nuclear Power Plants and Sites
- Disaster Management
Region:
- North America
- Latin America
- Western Europe
- Eastern Europe
- South Asia and Pacific
- East Asia
- Middle East & Africa
Frequently Asked Questions
What is the CBRN Protection Equipment Market in 2023?
The market is estimated to be valued at US$ 6 billion in 2023.
What is the Anticipated Value of the CBRN Protection Equipment Market by 2033?
The market is projected to surpass US$ 10.3 billion by 2033.
What is the Growth Outlook for the CBRN Protection Equipment Market?
The market is likely to expand at a CAGR of 5.6% through 2033.
Which Category Holds a Dominant Share in the Market?
The category of C-decontamination is expected to hold a significant share in the market.
What Segment Dominates the CBRN Protection Equipment Market in Terms of End-use?
The military segment is projected to be the dominant segment through 2033.
Table of Content
1. Executive Summary 1.1. Global Market Outlook 1.2. Demand-side Trends 1.3. Supply-side Trends 1.4. Technology Roadmap Analysis 1.5. Analysis and Recommendations 2. Market Overview 2.1. Market Coverage / Taxonomy 2.2. Market Definition / Scope / Limitations 3. Market Background 3.1. Market Dynamics 3.1.1. Drivers 3.1.2. Restraints 3.1.3. Opportunity 3.1.4. Trends 3.2. Scenario Forecast 3.2.1. Demand in Optimistic Scenario 3.2.2. Demand in Likely Scenario 3.2.3. Demand in Conservative Scenario 3.3. Opportunity Map Analysis 3.4. Product Life Cycle Analysis 3.5. Supply Chain Analysis 3.5.1. Supply Side Participants and their Roles 3.5.1.1. Producers 3.5.1.2. Mid-Level Participants (Traders/ Agents/ Brokers) 3.5.1.3. Wholesalers and Distributors 3.5.2. Value Added and Value Created at Node in the Supply Chain 3.5.3. List of Raw Material Suppliers 3.5.4. List of Existing and Potential Buyer’s 3.6. Investment Feasibility Matrix 3.7. Value Chain Analysis 3.7.1. Profit Margin Analysis 3.7.2. Wholesalers and Distributors 3.7.3. Retailers 3.8. PESTLE and Porter’s Analysis 3.9. Regulatory Landscape 3.9.1. By Key Regions 3.9.2. By Key Countries 3.10. Regional Parent Market Outlook 3.11. Production and Consumption Statistics 3.12. Import and Export Statistics 4. Global Market Analysis 2018 to 2022 and Forecast, 2023 to 2033 4.1. Historical Market Size Value (US$ Million) & Volume (Units) Analysis, 2018 to 2022 4.2. Current and Future Market Size Value (US$ Million) & Volume (Units) Projections, 2023 to 2033 4.2.1. Y-o-Y Growth Trend Analysis 4.2.2. Absolute $ Opportunity Analysis 5. Global Market Analysis 2018 to 2022 and Forecast 2023 to 2033, By Product Type 5.1. Introduction / Key Findings 5.2. Historical Market Size Value (US$ Million) & Volume (Units) Analysis By Product Type, 2018 to 2022 5.3. Current and Future Market Size Value (US$ Million) & Volume (Units) Analysis and Forecast By Product Type, 2023 to 2033 5.3.1. Mobile / Transportation 5.3.1.1. Air Purification Value (US$ Million) & Volume (Units)s 5.3.1.2. Integrated Colpro Systems 5.3.1.3. Protective Entrances 5.3.1.4. ROV Bags 5.3.1.5. Medical Transportation Sets 5.3.2. Unhardened Collective Protection Systems (UCPS) 5.3.3. Personal Protective Equipment (PPE) 5.3.4. Decontamination Shelter Systems 5.3.4.1. Individual 5.3.4.2. 2 Line 5.3.4.3. 3 Line 5.3.4.4. 4 Line 5.4. Y-o-Y Growth Trend Analysis By Product Type, 2018 to 2022 5.5. Absolute $ Opportunity Analysis By Product Type, 2023 to 2033 6. Global Market Analysis 2018 to 2022 and Forecast 2023 to 2033, By Category 6.1. Introduction / Key Findings 6.2. Historical Market Size Value (US$ Million) & Volume (Units) Analysis By Category , 2018 to 2022 6.3. Current and Future Market Size Value (US$ Million) & Volume (Units) Analysis and Forecast By Category , 2023 to 2033 6.3.1. C Decontamination 6.3.2. B Decontamination 6.3.3. RN Contamination 6.3.4. Railways 6.4. Y-o-Y Growth Trend Analysis By Category , 2018 to 2022 6.5. Absolute $ Opportunity Analysis By Category , 2023 to 2033 7. Global Market Analysis 2018 to 2022 and Forecast 2023 to 2033, By End User 7.1. Introduction / Key Findings 7.2. Historical Market Size Value (US$ Million) & Volume (Units) Analysis By End User, 2018 to 2022 7.3. Current and Future Market Size Value (US$ Million) & Volume (Units) Analysis and Forecast By End User, 2023 to 2033 7.3.1. Military 7.3.2. Civil Defence and Security 7.3.3. Nuclear Power Plants and Sites 7.3.4. Disaster Management 7.4. Y-o-Y Growth Trend Analysis By End User, 2018 to 2022 7.5. Absolute $ Opportunity Analysis By End User, 2023 to 2033 8. Global Market Analysis 2018 to 2022 and Forecast 2023 to 2033, By Region 8.1. Introduction 8.2. Historical Market Size Value (US$ Million) & Volume (Units) Analysis By Region, 2018 to 2022 8.3. Current Market Size Value (US$ Million) & Volume (Units) Analysis and Forecast By Region, 2023 to 2033 8.3.1. North America 8.3.2. Latin America 8.3.3. Western Europe 8.3.4. Eastern Europe 8.3.5. South Asia and Pacific 8.3.6. East Asia 8.3.7. Middle East and Africa 8.4. Market Attractiveness Analysis By Region 9. North America Market Analysis 2018 to 2022 and Forecast 2023 to 2033, By Country 9.1. Historical Market Size Value (US$ Million) & Volume (Units) Trend Analysis By Market Taxonomy, 2018 to 2022 9.2. Market Size Value (US$ Million) & Volume (Units) Forecast By Market Taxonomy, 2023 to 2033 9.2.1. By Country 9.2.1.1. The USA 9.2.1.2. Canada 9.2.2. By Product Type 9.2.3. By Category 9.2.4. By End User 9.3. Market Attractiveness Analysis 9.3.1. By Country 9.3.2. By Product Type 9.3.3. By Category 9.3.4. By End User 9.4. Key Takeaways 10. Latin America Market Analysis 2018 to 2022 and Forecast 2023 to 2033, By Country 10.1. Historical Market Size Value (US$ Million) & Volume (Units) Trend Analysis By Market Taxonomy, 2018 to 2022 10.2. Market Size Value (US$ Million) & Volume (Units) Forecast By Market Taxonomy, 2023 to 2033 10.2.1. By Country 10.2.1.1. Brazil 10.2.1.2. Mexico 10.2.1.3. Rest of Latin America 10.2.2. By Product Type 10.2.3. By Category 10.2.4. By End User 10.3. Market Attractiveness Analysis 10.3.1. By Country 10.3.2. By Product Type 10.3.3. By Category 10.3.4. By End User 10.4. Key Takeaways 11. Western Europe Market Analysis 2018 to 2022 and Forecast 2023 to 2033, By Country 11.1. Historical Market Size Value (US$ Million) & Volume (Units) Trend Analysis By Market Taxonomy, 2018 to 2022 11.2. Market Size Value (US$ Million) & Volume (Units) Forecast By Market Taxonomy, 2023 to 2033 11.2.1. By Country 11.2.1.1. Germany 11.2.1.2. United Kingdom 11.2.1.3. France 11.2.1.4. Spain 11.2.1.5. Italy 11.2.1.6. Rest of Western Europe 11.2.2. By Product Type 11.2.3. By Category 11.2.4. By End User 11.3. Market Attractiveness Analysis 11.3.1. By Country 11.3.2. By Product Type 11.3.3. By Category 11.3.4. By End User 11.4. Key Takeaways 12. Eastern Europe Market Analysis 2018 to 2022 and Forecast 2023 to 2033, By Country 12.1. Historical Market Size Value (US$ Million) & Volume (Units) Trend Analysis By Market Taxonomy, 2018 to 2022 12.2. Market Size Value (US$ Million) & Volume (Units) Forecast By Market Taxonomy, 2023 to 2033 12.2.1. By Country 12.2.1.1. Poland 12.2.1.2. Russia 12.2.1.3. Czech Republic 12.2.1.4. Romania 12.2.1.5. Rest of Eastern Europe 12.2.2. By Product Type 12.2.3. By Category 12.2.4. By End User 12.3. Market Attractiveness Analysis 12.3.1. By Country 12.3.2. By Product Type 12.3.3. By Category 12.3.4. By End User 12.4. Key Takeaways 13. South Asia and Pacific Market Analysis 2018 to 2022 and Forecast 2023 to 2033, By Country 13.1. Historical Market Size Value (US$ Million) & Volume (Units) Trend Analysis By Market Taxonomy, 2018 to 2022 13.2. Market Size Value (US$ Million) & Volume (Units) Forecast By Market Taxonomy, 2023 to 2033 13.2.1. By Country 13.2.1.1. India 13.2.1.2. Bangladesh 13.2.1.3. Australia 13.2.1.4. New Zealand 13.2.1.5. Rest of South Asia and Pacific 13.2.2. By Product Type 13.2.3. By Category 13.2.4. By End User 13.3. Market Attractiveness Analysis 13.3.1. By Country 13.3.2. By Product Type 13.3.3. By Category 13.3.4. By End User 13.4. Key Takeaways 14. East Asia Market Analysis 2018 to 2022 and Forecast 2023 to 2033, By Country 14.1. Historical Market Size Value (US$ Million) & Volume (Units) Trend Analysis By Market Taxonomy, 2018 to 2022 14.2. Market Size Value (US$ Million) & Volume (Units) Forecast By Market Taxonomy, 2023 to 2033 14.2.1. By Country 14.2.1.1. China 14.2.1.2. Japan 14.2.1.3. South Korea 14.2.2. By Product Type 14.2.3. By Category 14.2.4. By End User 14.3. Market Attractiveness Analysis 14.3.1. By Country 14.3.2. By Product Type 14.3.3. By Category 14.3.4. By End User 14.4. Key Takeaways 15. Middle East and Africa Market Analysis 2018 to 2022 and Forecast 2023 to 2033, By Country 15.1. Historical Market Size Value (US$ Million) & Volume (Units) Trend Analysis By Market Taxonomy, 2018 to 2022 15.2. Market Size Value (US$ Million) & Volume (Units) Forecast By Market Taxonomy, 2023 to 2033 15.2.1. By Country 15.2.1.1. GCC Countries 15.2.1.2. South Africa 15.2.1.3. Israel 15.2.1.4. Rest of MEA 15.2.2. By Product Type 15.2.3. By Category 15.2.4. By End User 15.3. Market Attractiveness Analysis 15.3.1. By Country 15.3.2. By Product Type 15.3.3. By Category 15.3.4. By End User 15.4. Key Takeaways 16. Key Countries Market Analysis 16.1. USA 16.1.1. Pricing Analysis 16.1.2. Market Share Analysis, 2022 16.1.2.1. By Product Type 16.1.2.2. By Category 16.1.2.3. By End User 16.2. Canada 16.2.1. Pricing Analysis 16.2.2. Market Share Analysis, 2022 16.2.2.1. By Product Type 16.2.2.2. By Category 16.2.2.3. By End User 16.3. Brazil 16.3.1. Pricing Analysis 16.3.2. Market Share Analysis, 2022 16.3.2.1. By Product Type 16.3.2.2. By Category 16.3.2.3. By End User 16.4. Mexico 16.4.1. Pricing Analysis 16.4.2. Market Share Analysis, 2022 16.4.2.1. By Product Type 16.4.2.2. By Category 16.4.2.3. By End User 16.5. Germany 16.5.1. Pricing Analysis 16.5.2. Market Share Analysis, 2022 16.5.2.1. By Product Type 16.5.2.2. By Category 16.5.2.3. By End User 16.6. United Kingdom 16.6.1. Pricing Analysis 16.6.2. Market Share Analysis, 2022 16.6.2.1. By Product Type 16.6.2.2. By Category 16.6.2.3. By End User 16.7. France 16.7.1. Pricing Analysis 16.7.2. Market Share Analysis, 2022 16.7.2.1. By Product Type 16.7.2.2. By Category 16.7.2.3. By End User 16.8. Spain 16.8.1. Pricing Analysis 16.8.2. Market Share Analysis, 2022 16.8.2.1. By Product Type 16.8.2.2. By Category 16.8.2.3. By End User 16.9. Italy 16.9.1. Pricing Analysis 16.9.2. Market Share Analysis, 2022 16.9.2.1. By Product Type 16.9.2.2. By Category 16.9.2.3. By End User 16.10. Poland 16.10.1. Pricing Analysis 16.10.2. Market Share Analysis, 2022 16.10.2.1. By Product Type 16.10.2.2. By Category 16.10.2.3. By End User 16.11. Russia 16.11.1. Pricing Analysis 16.11.2. Market Share Analysis, 2022 16.11.2.1. By Product Type 16.11.2.2. By Category 16.11.2.3. By End User 16.12. Czech Republic 16.12.1. Pricing Analysis 16.12.2. Market Share Analysis, 2022 16.12.2.1. By Product Type 16.12.2.2. By Category 16.12.2.3. By End User 16.13. Romania 16.13.1. Pricing Analysis 16.13.2. Market Share Analysis, 2022 16.13.2.1. By Product Type 16.13.2.2. By Category 16.13.2.3. By End User 16.14. India 16.14.1. Pricing Analysis 16.14.2. Market Share Analysis, 2022 16.14.2.1. By Product Type 16.14.2.2. By Category 16.14.2.3. By End User 16.15. Bangladesh 16.15.1. Pricing Analysis 16.15.2. Market Share Analysis, 2022 16.15.2.1. By Product Type 16.15.2.2. By Category 16.15.2.3. By End User 16.16. Australia 16.16.1. Pricing Analysis 16.16.2. Market Share Analysis, 2022 16.16.2.1. By Product Type 16.16.2.2. By Category 16.16.2.3. By End User 16.17. New Zealand 16.17.1. Pricing Analysis 16.17.2. Market Share Analysis, 2022 16.17.2.1. By Product Type 16.17.2.2. By Category 16.17.2.3. By End User 16.18. China 16.18.1. Pricing Analysis 16.18.2. Market Share Analysis, 2022 16.18.2.1. By Product Type 16.18.2.2. By Category 16.18.2.3. By End User 16.19. Japan 16.19.1. Pricing Analysis 16.19.2. Market Share Analysis, 2022 16.19.2.1. By Product Type 16.19.2.2. By Category 16.19.2.3. By End User 16.20. South Korea 16.20.1. Pricing Analysis 16.20.2. Market Share Analysis, 2022 16.20.2.1. By Product Type 16.20.2.2. By Category 16.20.2.3. By End User 16.21. GCC Countries 16.21.1. Pricing Analysis 16.21.2. Market Share Analysis, 2022 16.21.2.1. By Product Type 16.21.2.2. By Category 16.21.2.3. By End User 16.22. South Africa 16.22.1. Pricing Analysis 16.22.2. Market Share Analysis, 2022 16.22.2.1. By Product Type 16.22.2.2. By Category 16.22.2.3. By End User 16.23. Israel 16.23.1. Pricing Analysis 16.23.2. Market Share Analysis, 2022 16.23.2.1. By Product Type 16.23.2.2. By Category 16.23.2.3. By End User 17. Market Structure Analysis 17.1. Competition Dashboard 17.2. Competition Benchmarking 17.3. Market Share Analysis of Top Players 17.3.1. By Regional 17.3.2. By Product Type 17.3.3. By Category 17.3.4. By End User 18. Competition Analysis 18.1. Competition Deep Dive 18.1.1. 3M 18.1.1.1. Overview 18.1.1.2. Product Portfolio 18.1.1.3. Profitability by Market Segments 18.1.1.4. Sales Footprint 18.1.1.5. Strategy Overview 18.1.1.5.1. Marketing Strategy 18.1.1.5.2. Product Strategy 18.1.1.5.3. Channel Strategy 18.1.2. Ansell Ltd. 18.1.2.1. Overview 18.1.2.2. Product Portfolio 18.1.2.3. Profitability by Market Segments 18.1.2.4. Sales Footprint 18.1.2.5. Strategy Overview 18.1.2.5.1. Marketing Strategy 18.1.2.5.2. Product Strategy 18.1.2.5.3. Channel Strategy 18.1.3. Honeywell International Inc. 18.1.3.1. Overview 18.1.3.2. Product Portfolio 18.1.3.3. Profitability by Market Segments 18.1.3.4. Sales Footprint 18.1.3.5. Strategy Overview 18.1.3.5.1. Marketing Strategy 18.1.3.5.2. Product Strategy 18.1.3.5.3. Channel Strategy 18.1.4. AirBoss of America Corporation 18.1.4.1. Overview 18.1.4.2. Product Portfolio 18.1.4.3. Profitability by Market Segments 18.1.4.4. Sales Footprint 18.1.4.5. Strategy Overview 18.1.4.5.1. Marketing Strategy 18.1.4.5.2. Product Strategy 18.1.4.5.3. Channel Strategy 18.1.5. Drägerwerk AG & Co. KGaA 18.1.5.1. Overview 18.1.5.2. Product Portfolio 18.1.5.3. Profitability by Market Segments 18.1.5.4. Sales Footprint 18.1.5.5. Strategy Overview 18.1.5.5.1. Marketing Strategy 18.1.5.5.2. Product Strategy 18.1.5.5.3. Channel Strategy 18.1.6. MSA Safety Inc 18.1.6.1. Overview 18.1.6.2. Product Portfolio 18.1.6.3. Profitability by Market Segments 18.1.6.4. Sales Footprint 18.1.6.5. Strategy Overview 18.1.6.5.1. Marketing Strategy 18.1.6.5.2. Product Strategy 18.1.6.5.3. Channel Strategy 18.1.7. HDT Global 18.1.7.1. Overview 18.1.7.2. Product Portfolio 18.1.7.3. Profitability by Market Segments 18.1.7.4. Sales Footprint 18.1.7.5. Strategy Overview 18.1.7.5.1. Marketing Strategy 18.1.7.5.2. Product Strategy 18.1.7.5.3. Channel Strategy 18.1.8. Avon Protection Systems 18.1.8.1. Overview 18.1.8.2. Product Portfolio 18.1.8.3. Profitability by Market Segments 18.1.8.4. Sales Footprint 18.1.8.5. Strategy Overview 18.1.8.5.1. Marketing Strategy 18.1.8.5.2. Product Strategy 18.1.8.5.3. Channel Strategy 18.1.9. Chemviron Carbon 18.1.9.1. Overview 18.1.9.2. Product Portfolio 18.1.9.3. Profitability by Market Segments 18.1.9.4. Sales Footprint 18.1.9.5. Strategy Overview 18.1.9.5.1. Marketing Strategy 18.1.9.5.2. Product Strategy 18.1.9.5.3. Channel Strategy 18.1.10. LION Group, Inc. 18.1.10.1. Overview 18.1.10.2. Product Portfolio 18.1.10.3. Profitability by Market Segments 18.1.10.4. Sales Footprint 18.1.10.5. Strategy Overview 18.1.10.5.1. Marketing Strategy 18.1.10.5.2. Product Strategy 18.1.10.5.3. Channel Strategy 18.1.11. Blauer Manufacturing Co., Inc. 18.1.11.1. Overview 18.1.11.2. Product Portfolio 18.1.11.3. Profitability by Market Segments 18.1.11.4. Sales Footprint 18.1.11.5. Strategy Overview 18.1.11.5.1. Marketing Strategy 18.1.11.5.2. Product Strategy 18.1.11.5.3. Channel Strategy 18.1.12. AMETEK, Inc. 18.1.12.1. Overview 18.1.12.2. Product Portfolio 18.1.12.3. Profitability by Market Segments 18.1.12.4. Sales Footprint 18.1.12.5. Strategy Overview 18.1.12.5.1. Marketing Strategy 18.1.12.5.2. Product Strategy 18.1.12.5.3. Channel Strategy 18.1.13. Ouvry - Systèmes de protection NRBC 18.1.13.1. Overview 18.1.13.2. Product Portfolio 18.1.13.3. Profitability by Market Segments 18.1.13.4. Sales Footprint 18.1.13.5. Strategy Overview 18.1.13.5.1. Marketing Strategy 18.1.13.5.2. Product Strategy 18.1.13.5.3. Channel Strategy 18.1.14. MDH Defence 18.1.14.1. Overview 18.1.14.2. Product Portfolio 18.1.14.3. Profitability by Market Segments 18.1.14.4. Sales Footprint 18.1.14.5. Strategy Overview 18.1.14.5.1. Marketing Strategy 18.1.14.5.2. Product Strategy 18.1.14.5.3. Channel Strategy 18.1.15. Seyntex 18.1.15.1. Overview 18.1.15.2. Product Portfolio 18.1.15.3. Profitability by Market Segments 18.1.15.4. Sales Footprint 18.1.15.5. Strategy Overview 18.1.15.5.1. Marketing Strategy 18.1.15.5.2. Product Strategy 18.1.15.5.3. Channel Strategy 18.1.16. Portsmouth Aviation Ltd. 18.1.16.1. Overview 18.1.16.2. Product Portfolio 18.1.16.3. Profitability by Market Segments 18.1.16.4. Sales Footprint 18.1.16.5. Strategy Overview 18.1.16.5.1. Marketing Strategy 18.1.16.5.2. Product Strategy 18.1.16.5.3. Channel Strategy 18.1.17. BLÜCHER GmbH 18.1.17.1. Overview 18.1.17.2. Product Portfolio 18.1.17.3. Profitability by Market Segments 18.1.17.4. Sales Footprint 18.1.17.5. Strategy Overview 18.1.17.5.1. Marketing Strategy 18.1.17.5.2. Product Strategy 18.1.17.5.3. Channel Strategy 18.1.18. ROFI 18.1.18.1. Overview 18.1.18.2. Product Portfolio 18.1.18.3. Profitability by Market Segments 18.1.18.4. Sales Footprint 18.1.18.5. Strategy Overview 18.1.18.5.1. Marketing Strategy 18.1.18.5.2. Product Strategy 18.1.18.5.3. Channel Strategy 19. Assumptions & Acronyms Used 20. Research Methodology
Don't pay for what you don't need
Customize your report by selecting specific countries or regions and save 30%!
List of Tables
Table 1: Global Market Value (US$ Million) Forecast by Region, 2018 to 2033 Table 2: Global Market Volume (Units) Forecast by Region, 2018 to 2033 Table 3: Global Market Value (US$ Million) Forecast by Product Type, 2018 to 2033 Table 4: Global Market Volume (Units) Forecast by Product Type, 2018 to 2033 Table 5: Global Market Value (US$ Million) Forecast by Category, 2018 to 2033 Table 6: Global Market Volume (Units) Forecast by Category, 2018 to 2033 Table 7: Global Market Value (US$ Million) Forecast by End User, 2018 to 2033 Table 8: Global Market Volume (Units) Forecast by End User, 2018 to 2033 Table 9: North America Market Value (US$ Million) Forecast by Country, 2018 to 2033 Table 10: North America Market Volume (Units) Forecast by Country, 2018 to 2033 Table 11: North America Market Value (US$ Million) Forecast by Product Type, 2018 to 2033 Table 12: North America Market Volume (Units) Forecast by Product Type, 2018 to 2033 Table 13: North America Market Value (US$ Million) Forecast by Category, 2018 to 2033 Table 14: North America Market Volume (Units) Forecast by Category, 2018 to 2033 Table 15: North America Market Value (US$ Million) Forecast by End User, 2018 to 2033 Table 16: North America Market Volume (Units) Forecast by End User, 2018 to 2033 Table 17: Latin America Market Value (US$ Million) Forecast by Country, 2018 to 2033 Table 18: Latin America Market Volume (Units) Forecast by Country, 2018 to 2033 Table 19: Latin America Market Value (US$ Million) Forecast by Product Type, 2018 to 2033 Table 20: Latin America Market Volume (Units) Forecast by Product Type, 2018 to 2033 Table 21: Latin America Market Value (US$ Million) Forecast by Category, 2018 to 2033 Table 22: Latin America Market Volume (Units) Forecast by Category, 2018 to 2033 Table 23: Latin America Market Value (US$ Million) Forecast by End User, 2018 to 2033 Table 24: Latin America Market Volume (Units) Forecast by End User, 2018 to 2033 Table 25: Western Europe Market Value (US$ Million) Forecast by Country, 2018 to 2033 Table 26: Western Europe Market Volume (Units) Forecast by Country, 2018 to 2033 Table 27: Western Europe Market Value (US$ Million) Forecast by Product Type, 2018 to 2033 Table 28: Western Europe Market Volume (Units) Forecast by Product Type, 2018 to 2033 Table 29: Western Europe Market Value (US$ Million) Forecast by Category, 2018 to 2033 Table 30: Western Europe Market Volume (Units) Forecast by Category, 2018 to 2033 Table 31: Western Europe Market Value (US$ Million) Forecast by End User, 2018 to 2033 Table 32: Western Europe Market Volume (Units) Forecast by End User, 2018 to 2033 Table 33: Eastern Europe Market Value (US$ Million) Forecast by Country, 2018 to 2033 Table 34: Eastern Europe Market Volume (Units) Forecast by Country, 2018 to 2033 Table 35: Eastern Europe Market Value (US$ Million) Forecast by Product Type, 2018 to 2033 Table 36: Eastern Europe Market Volume (Units) Forecast by Product Type, 2018 to 2033 Table 37: Eastern Europe Market Value (US$ Million) Forecast by Category, 2018 to 2033 Table 38: Eastern Europe Market Volume (Units) Forecast by Category, 2018 to 2033 Table 39: Eastern Europe Market Value (US$ Million) Forecast by End User, 2018 to 2033 Table 40: Eastern Europe Market Volume (Units) Forecast by End User, 2018 to 2033 Table 41: South Asia and Pacific Market Value (US$ Million) Forecast by Country, 2018 to 2033 Table 42: South Asia and Pacific Market Volume (Units) Forecast by Country, 2018 to 2033 Table 43: South Asia and Pacific Market Value (US$ Million) Forecast by Product Type, 2018 to 2033 Table 44: South Asia and Pacific Market Volume (Units) Forecast by Product Type, 2018 to 2033 Table 45: South Asia and Pacific Market Value (US$ Million) Forecast by Category, 2018 to 2033 Table 46: South Asia and Pacific Market Volume (Units) Forecast by Category, 2018 to 2033 Table 47: South Asia and Pacific Market Value (US$ Million) Forecast by End User, 2018 to 2033 Table 48: South Asia and Pacific Market Volume (Units) Forecast by End User, 2018 to 2033 Table 49: East Asia Market Value (US$ Million) Forecast by Country, 2018 to 2033 Table 50: East Asia Market Volume (Units) Forecast by Country, 2018 to 2033 Table 51: East Asia Market Value (US$ Million) Forecast by Product Type, 2018 to 2033 Table 52: East Asia Market Volume (Units) Forecast by Product Type, 2018 to 2033 Table 53: East Asia Market Value (US$ Million) Forecast by Category, 2018 to 2033 Table 54: East Asia Market Volume (Units) Forecast by Category, 2018 to 2033 Table 55: East Asia Market Value (US$ Million) Forecast by End User, 2018 to 2033 Table 56: East Asia Market Volume (Units) Forecast by End User, 2018 to 2033 Table 57: Middle East and Africa Market Value (US$ Million) Forecast by Country, 2018 to 2033 Table 58: Middle East and Africa Market Volume (Units) Forecast by Country, 2018 to 2033 Table 59: Middle East and Africa Market Value (US$ Million) Forecast by Product Type, 2018 to 2033 Table 60: Middle East and Africa Market Volume (Units) Forecast by Product Type, 2018 to 2033 Table 61: Middle East and Africa Market Value (US$ Million) Forecast by Category, 2018 to 2033 Table 62: Middle East and Africa Market Volume (Units) Forecast by Category, 2018 to 2033 Table 63: Middle East and Africa Market Value (US$ Million) Forecast by End User, 2018 to 2033 Table 64: Middle East and Africa Market Volume (Units) Forecast by End User, 2018 to 2033
List of Charts
Figure 1: Global Market Value (US$ Million) by Product Type, 2023 to 2033 Figure 2: Global Market Value (US$ Million) by Category, 2023 to 2033 Figure 3: Global Market Value (US$ Million) by End User, 2023 to 2033 Figure 4: Global Market Value (US$ Million) by Region, 2023 to 2033 Figure 5: Global Market Value (US$ Million) Analysis by Region, 2018 to 2033 Figure 6: Global Market Volume (Units) Analysis by Region, 2018 to 2033 Figure 7: Global Market Value Share (%) and BPS Analysis by Region, 2023 to 2033 Figure 8: Global Market Y-o-Y Growth (%) Projections by Region, 2023 to 2033 Figure 9: Global Market Value (US$ Million) Analysis by Product Type, 2018 to 2033 Figure 10: Global Market Volume (Units) Analysis by Product Type, 2018 to 2033 Figure 11: Global Market Value Share (%) and BPS Analysis by Product Type, 2023 to 2033 Figure 12: Global Market Y-o-Y Growth (%) Projections by Product Type, 2023 to 2033 Figure 13: Global Market Value (US$ Million) Analysis by Category, 2018 to 2033 Figure 14: Global Market Volume (Units) Analysis by Category, 2018 to 2033 Figure 15: Global Market Value Share (%) and BPS Analysis by Category, 2023 to 2033 Figure 16: Global Market Y-o-Y Growth (%) Projections by Category, 2023 to 2033 Figure 17: Global Market Value (US$ Million) Analysis by End User, 2018 to 2033 Figure 18: Global Market Volume (Units) Analysis by End User, 2018 to 2033 Figure 19: Global Market Value Share (%) and BPS Analysis by End User, 2023 to 2033 Figure 20: Global Market Y-o-Y Growth (%) Projections by End User, 2023 to 2033 Figure 21: Global Market Attractiveness by Product Type, 2023 to 2033 Figure 22: Global Market Attractiveness by Category, 2023 to 2033 Figure 23: Global Market Attractiveness by End User, 2023 to 2033 Figure 24: Global Market Attractiveness by Region, 2023 to 2033 Figure 25: North America Market Value (US$ Million) by Product Type, 2023 to 2033 Figure 26: North America Market Value (US$ Million) by Category, 2023 to 2033 Figure 27: North America Market Value (US$ Million) by End User, 2023 to 2033 Figure 28: North America Market Value (US$ Million) by Country, 2023 to 2033 Figure 29: North America Market Value (US$ Million) Analysis by Country, 2018 to 2033 Figure 30: North America Market Volume (Units) Analysis by Country, 2018 to 2033 Figure 31: North America Market Value Share (%) and BPS Analysis by Country, 2023 to 2033 Figure 32: North America Market Y-o-Y Growth (%) Projections by Country, 2023 to 2033 Figure 33: North America Market Value (US$ Million) Analysis by Product Type, 2018 to 2033 Figure 34: North America Market Volume (Units) Analysis by Product Type, 2018 to 2033 Figure 35: North America Market Value Share (%) and BPS Analysis by Product Type, 2023 to 2033 Figure 36: North America Market Y-o-Y Growth (%) Projections by Product Type, 2023 to 2033 Figure 37: North America Market Value (US$ Million) Analysis by Category, 2018 to 2033 Figure 38: North America Market Volume (Units) Analysis by Category, 2018 to 2033 Figure 39: North America Market Value Share (%) and BPS Analysis by Category, 2023 to 2033 Figure 40: North America Market Y-o-Y Growth (%) Projections by Category, 2023 to 2033 Figure 41: North America Market Value (US$ Million) Analysis by End User, 2018 to 2033 Figure 42: North America Market Volume (Units) Analysis by End User, 2018 to 2033 Figure 43: North America Market Value Share (%) and BPS Analysis by End User, 2023 to 2033 Figure 44: North America Market Y-o-Y Growth (%) Projections by End User, 2023 to 2033 Figure 45: North America Market Attractiveness by Product Type, 2023 to 2033 Figure 46: North America Market Attractiveness by Category, 2023 to 2033 Figure 47: North America Market Attractiveness by End User, 2023 to 2033 Figure 48: North America Market Attractiveness by Country, 2023 to 2033 Figure 49: Latin America Market Value (US$ Million) by Product Type, 2023 to 2033 Figure 50: Latin America Market Value (US$ Million) by Category, 2023 to 2033 Figure 51: Latin America Market Value (US$ Million) by End User, 2023 to 2033 Figure 52: Latin America Market Value (US$ Million) by Country, 2023 to 2033 Figure 53: Latin America Market Value (US$ Million) Analysis by Country, 2018 to 2033 Figure 54: Latin America Market Volume (Units) Analysis by Country, 2018 to 2033 Figure 55: Latin America Market Value Share (%) and BPS Analysis by Country, 2023 to 2033 Figure 56: Latin America Market Y-o-Y Growth (%) Projections by Country, 2023 to 2033 Figure 57: Latin America Market Value (US$ Million) Analysis by Product Type, 2018 to 2033 Figure 58: Latin America Market Volume (Units) Analysis by Product Type, 2018 to 2033 Figure 59: Latin America Market Value Share (%) and BPS Analysis by Product Type, 2023 to 2033 Figure 60: Latin America Market Y-o-Y Growth (%) Projections by Product Type, 2023 to 2033 Figure 61: Latin America Market Value (US$ Million) Analysis by Category, 2018 to 2033 Figure 62: Latin America Market Volume (Units) Analysis by Category, 2018 to 2033 Figure 63: Latin America Market Value Share (%) and BPS Analysis by Category, 2023 to 2033 Figure 64: Latin America Market Y-o-Y Growth (%) Projections by Category, 2023 to 2033 Figure 65: Latin America Market Value (US$ Million) Analysis by End User, 2018 to 2033 Figure 66: Latin America Market Volume (Units) Analysis by End User, 2018 to 2033 Figure 67: Latin America Market Value Share (%) and BPS Analysis by End User, 2023 to 2033 Figure 68: Latin America Market Y-o-Y Growth (%) Projections by End User, 2023 to 2033 Figure 69: Latin America Market Attractiveness by Product Type, 2023 to 2033 Figure 70: Latin America Market Attractiveness by Category, 2023 to 2033 Figure 71: Latin America Market Attractiveness by End User, 2023 to 2033 Figure 72: Latin America Market Attractiveness by Country, 2023 to 2033 Figure 73: Western Europe Market Value (US$ Million) by Product Type, 2023 to 2033 Figure 74: Western Europe Market Value (US$ Million) by Category, 2023 to 2033 Figure 75: Western Europe Market Value (US$ Million) by End User, 2023 to 2033 Figure 76: Western Europe Market Value (US$ Million) by Country, 2023 to 2033 Figure 77: Western Europe Market Value (US$ Million) Analysis by Country, 2018 to 2033 Figure 78: Western Europe Market Volume (Units) Analysis by Country, 2018 to 2033 Figure 79: Western Europe Market Value Share (%) and BPS Analysis by Country, 2023 to 2033 Figure 80: Western Europe Market Y-o-Y Growth (%) Projections by Country, 2023 to 2033 Figure 81: Western Europe Market Value (US$ Million) Analysis by Product Type, 2018 to 2033 Figure 82: Western Europe Market Volume (Units) Analysis by Product Type, 2018 to 2033 Figure 83: Western Europe Market Value Share (%) and BPS Analysis by Product Type, 2023 to 2033 Figure 84: Western Europe Market Y-o-Y Growth (%) Projections by Product Type, 2023 to 2033 Figure 85: Western Europe Market Value (US$ Million) Analysis by Category, 2018 to 2033 Figure 86: Western Europe Market Volume (Units) Analysis by Category, 2018 to 2033 Figure 87: Western Europe Market Value Share (%) and BPS Analysis by Category, 2023 to 2033 Figure 88: Western Europe Market Y-o-Y Growth (%) Projections by Category, 2023 to 2033 Figure 89: Western Europe Market Value (US$ Million) Analysis by End User, 2018 to 2033 Figure 90: Western Europe Market Volume (Units) Analysis by End User, 2018 to 2033 Figure 91: Western Europe Market Value Share (%) and BPS Analysis by End User, 2023 to 2033 Figure 92: Western Europe Market Y-o-Y Growth (%) Projections by End User, 2023 to 2033 Figure 93: Western Europe Market Attractiveness by Product Type, 2023 to 2033 Figure 94: Western Europe Market Attractiveness by Category, 2023 to 2033 Figure 95: Western Europe Market Attractiveness by End User, 2023 to 2033 Figure 96: Western Europe Market Attractiveness by Country, 2023 to 2033 Figure 97: Eastern Europe Market Value (US$ Million) by Product Type, 2023 to 2033 Figure 98: Eastern Europe Market Value (US$ Million) by Category, 2023 to 2033 Figure 99: Eastern Europe Market Value (US$ Million) by End User, 2023 to 2033 Figure 100: Eastern Europe Market Value (US$ Million) by Country, 2023 to 2033 Figure 101: Eastern Europe Market Value (US$ Million) Analysis by Country, 2018 to 2033 Figure 102: Eastern Europe Market Volume (Units) Analysis by Country, 2018 to 2033 Figure 103: Eastern Europe Market Value Share (%) and BPS Analysis by Country, 2023 to 2033 Figure 104: Eastern Europe Market Y-o-Y Growth (%) Projections by Country, 2023 to 2033 Figure 105: Eastern Europe Market Value (US$ Million) Analysis by Product Type, 2018 to 2033 Figure 106: Eastern Europe Market Volume (Units) Analysis by Product Type, 2018 to 2033 Figure 107: Eastern Europe Market Value Share (%) and BPS Analysis by Product Type, 2023 to 2033 Figure 108: Eastern Europe Market Y-o-Y Growth (%) Projections by Product Type, 2023 to 2033 Figure 109: Eastern Europe Market Value (US$ Million) Analysis by Category, 2018 to 2033 Figure 110: Eastern Europe Market Volume (Units) Analysis by Category, 2018 to 2033 Figure 111: Eastern Europe Market Value Share (%) and BPS Analysis by Category, 2023 to 2033 Figure 112: Eastern Europe Market Y-o-Y Growth (%) Projections by Category, 2023 to 2033 Figure 113: Eastern Europe Market Value (US$ Million) Analysis by End User, 2018 to 2033 Figure 114: Eastern Europe Market Volume (Units) Analysis by End User, 2018 to 2033 Figure 115: Eastern Europe Market Value Share (%) and BPS Analysis by End User, 2023 to 2033 Figure 116: Eastern Europe Market Y-o-Y Growth (%) Projections by End User, 2023 to 2033 Figure 117: Eastern Europe Market Attractiveness by Product Type, 2023 to 2033 Figure 118: Eastern Europe Market Attractiveness by Category, 2023 to 2033 Figure 119: Eastern Europe Market Attractiveness by End User, 2023 to 2033 Figure 120: Eastern Europe Market Attractiveness by Country, 2023 to 2033 Figure 121: South Asia and Pacific Market Value (US$ Million) by Product Type, 2023 to 2033 Figure 122: South Asia and Pacific Market Value (US$ Million) by Category, 2023 to 2033 Figure 123: South Asia and Pacific Market Value (US$ Million) by End User, 2023 to 2033 Figure 124: South Asia and Pacific Market Value (US$ Million) by Country, 2023 to 2033 Figure 125: South Asia and Pacific Market Value (US$ Million) Analysis by Country, 2018 to 2033 Figure 126: South Asia and Pacific Market Volume (Units) Analysis by Country, 2018 to 2033 Figure 127: South Asia and Pacific Market Value Share (%) and BPS Analysis by Country, 2023 to 2033 Figure 128: South Asia and Pacific Market Y-o-Y Growth (%) Projections by Country, 2023 to 2033 Figure 129: South Asia and Pacific Market Value (US$ Million) Analysis by Product Type, 2018 to 2033 Figure 130: South Asia and Pacific Market Volume (Units) Analysis by Product Type, 2018 to 2033 Figure 131: South Asia and Pacific Market Value Share (%) and BPS Analysis by Product Type, 2023 to 2033 Figure 132: South Asia and Pacific Market Y-o-Y Growth (%) Projections by Product Type, 2023 to 2033 Figure 133: South Asia and Pacific Market Value (US$ Million) Analysis by Category, 2018 to 2033 Figure 134: South Asia and Pacific Market Volume (Units) Analysis by Category, 2018 to 2033 Figure 135: South Asia and Pacific Market Value Share (%) and BPS Analysis by Category, 2023 to 2033 Figure 136: South Asia and Pacific Market Y-o-Y Growth (%) Projections by Category, 2023 to 2033 Figure 137: South Asia and Pacific Market Value (US$ Million) Analysis by End User, 2018 to 2033 Figure 138: South Asia and Pacific Market Volume (Units) Analysis by End User, 2018 to 2033 Figure 139: South Asia and Pacific Market Value Share (%) and BPS Analysis by End User, 2023 to 2033 Figure 140: South Asia and Pacific Market Y-o-Y Growth (%) Projections by End User, 2023 to 2033 Figure 141: South Asia and Pacific Market Attractiveness by Product Type, 2023 to 2033 Figure 142: South Asia and Pacific Market Attractiveness by Category, 2023 to 2033 Figure 143: South Asia and Pacific Market Attractiveness by End User, 2023 to 2033 Figure 144: South Asia and Pacific Market Attractiveness by Country, 2023 to 2033 Figure 145: East Asia Market Value (US$ Million) by Product Type, 2023 to 2033 Figure 146: East Asia Market Value (US$ Million) by Category, 2023 to 2033 Figure 147: East Asia Market Value (US$ Million) by End User, 2023 to 2033 Figure 148: East Asia Market Value (US$ Million) by Country, 2023 to 2033 Figure 149: East Asia Market Value (US$ Million) Analysis by Country, 2018 to 2033 Figure 150: East Asia Market Volume (Units) Analysis by Country, 2018 to 2033 Figure 151: East Asia Market Value Share (%) and BPS Analysis by Country, 2023 to 2033 Figure 152: East Asia Market Y-o-Y Growth (%) Projections by Country, 2023 to 2033 Figure 153: East Asia Market Value (US$ Million) Analysis by Product Type, 2018 to 2033 Figure 154: East Asia Market Volume (Units) Analysis by Product Type, 2018 to 2033 Figure 155: East Asia Market Value Share (%) and BPS Analysis by Product Type, 2023 to 2033 Figure 156: East Asia Market Y-o-Y Growth (%) Projections by Product Type, 2023 to 2033 Figure 157: East Asia Market Value (US$ Million) Analysis by Category, 2018 to 2033 Figure 158: East Asia Market Volume (Units) Analysis by Category, 2018 to 2033 Figure 159: East Asia Market Value Share (%) and BPS Analysis by Category, 2023 to 2033 Figure 160: East Asia Market Y-o-Y Growth (%) Projections by Category, 2023 to 2033 Figure 161: East Asia Market Value (US$ Million) Analysis by End User, 2018 to 2033 Figure 162: East Asia Market Volume (Units) Analysis by End User, 2018 to 2033 Figure 163: East Asia Market Value Share (%) and BPS Analysis by End User, 2023 to 2033 Figure 164: East Asia Market Y-o-Y Growth (%) Projections by End User, 2023 to 2033 Figure 165: East Asia Market Attractiveness by Product Type, 2023 to 2033 Figure 166: East Asia Market Attractiveness by Category, 2023 to 2033 Figure 167: East Asia Market Attractiveness by End User, 2023 to 2033 Figure 168: East Asia Market Attractiveness by Country, 2023 to 2033 Figure 169: Middle East and Africa Market Value (US$ Million) by Product Type, 2023 to 2033 Figure 170: Middle East and Africa Market Value (US$ Million) by Category, 2023 to 2033 Figure 171: Middle East and Africa Market Value (US$ Million) by End User, 2023 to 2033 Figure 172: Middle East and Africa Market Value (US$ Million) by Country, 2023 to 2033 Figure 173: Middle East and Africa Market Value (US$ Million) Analysis by Country, 2018 to 2033 Figure 174: Middle East and Africa Market Volume (Units) Analysis by Country, 2018 to 2033 Figure 175: Middle East and Africa Market Value Share (%) and BPS Analysis by Country, 2023 to 2033 Figure 176: Middle East and Africa Market Y-o-Y Growth (%) Projections by Country, 2023 to 2033 Figure 177: Middle East and Africa Market Value (US$ Million) Analysis by Product Type, 2018 to 2033 Figure 178: Middle East and Africa Market Volume (Units) Analysis by Product Type, 2018 to 2033 Figure 179: Middle East and Africa Market Value Share (%) and BPS Analysis by Product Type, 2023 to 2033 Figure 180: Middle East and Africa Market Y-o-Y Growth (%) Projections by Product Type, 2023 to 2033 Figure 181: Middle East and Africa Market Value (US$ Million) Analysis by Category, 2018 to 2033 Figure 182: Middle East and Africa Market Volume (Units) Analysis by Category, 2018 to 2033 Figure 183: Middle East and Africa Market Value Share (%) and BPS Analysis by Category, 2023 to 2033 Figure 184: Middle East and Africa Market Y-o-Y Growth (%) Projections by Category, 2023 to 2033 Figure 185: Middle East and Africa Market Value (US$ Million) Analysis by End User, 2018 to 2033 Figure 186: Middle East and Africa Market Volume (Units) Analysis by End User, 2018 to 2033 Figure 187: Middle East and Africa Market Value Share (%) and BPS Analysis by End User, 2023 to 2033 Figure 188: Middle East and Africa Market Y-o-Y Growth (%) Projections by End User, 2023 to 2033 Figure 189: Middle East and Africa Market Attractiveness by Product Type, 2023 to 2033 Figure 190: Middle East and Africa Market Attractiveness by Category, 2023 to 2033 Figure 191: Middle East and Africa Market Attractiveness by End User, 2023 to 2033 Figure 192: Middle East and Africa Market Attractiveness by Country, 2023 to 2033
Recommendations
Explore Industrial Automation Insights
View Reports