Reports

- Global Locations -

Headquarters

Future Market Insights, Inc.

Christiana Corporate, 200
Continental Drive, Suite 401,
Newark, Delaware - 19713,
United States

T: +1-845-579-5705

Americas

Future Market Insights, Inc.

616 Corporate Way, Suite 2-9018,
Valley Cottage, NY 10989, United States

T: +1-347-918-3531

MEA

Future Market Insights

1602-6 Jumeirah Bay X2 Tower, Plot No: JLT-PH2-X2A,
Jumeirah Lakes Towers, Dubai,
United Arab Emirates

Europe

Future Market Insights

3rd Floor, 207 Regent Street,
W1B 3HH London
United Kingdom

T: + 44 (0) 20 8123 9659
D: +44 (0) 20 3287 4268

Asia Pacific

Future Market Insights

IndiaLand Global Tech Park, Unit UG-1, Behind Grand HighStreet, Phase 1, Hinjawadi, MH, Pune – 411057, India

Surface Protection Service Market Outlook for 2024 to 2034

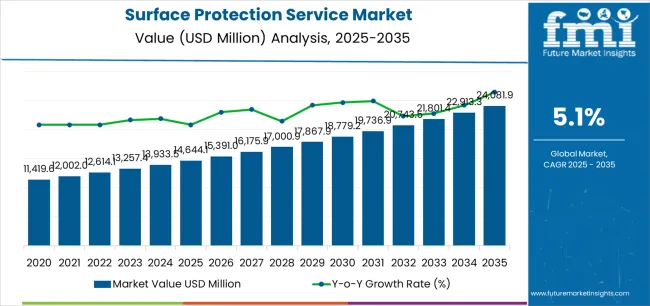
The surface protection service market size is estimated to be worth US$ 13,933.50 million in 2024. Surface protection services have witnessed a surge in demand driven by various factors contributing to the need to safeguard surfaces from damage, wear, and deterioration.

The demand for surface protection services is predicted to rise at a CAGR of 5.10% through 2034. One significant driver is the growing awareness among industries and consumers about the importance of preserving the integrity and longevity of surfaces, especially in high-traffic areas or environments prone to harsh conditions.

The surface protection service industry is anticipated to surpass US$ 21,063 million by 2034. With an increasing focus on sustainability across industries, there's a growing demand for eco-friendly surface protection solutions that minimize environmental impact and support green initiatives. Companies are seeking services that utilize biodegradable materials, reduce energy consumption during application, and promote responsible disposal practices.

Attributes Details
Surface Protection Service Market Value for 2024 US$ 13,933.50 million
Surface Protection Service Market Value for 2034 US$ 21,063 million
Surface Protection Service Market Forecast CAGR for 2024 to 2034 5.10%

Don't pay for what you don't need

Customize your report by selecting specific countries or regions and save 30%!

Historical Performance and Future Growth of the Surface Protection Service Market

Historical CAGR 4.70%
Forecast CAGR 5.10%

The historical performance of the surface protection service market indicates a CAGR of 4.70%, reflecting steady growth over the past years. However, the forecasted CAGR of 5.10% suggests a slight increase in growth rate moving forward.

  • Growing awareness among industries about the importance of surface protection in prolonging the lifespan of assets, reducing maintenance costs, and ensuring operational efficiency has driven demand for surface protection services.
  • Rapid infrastructure development projects, including the construction of commercial buildings, bridges, and roads, have created substantial demand for surface protection services to preserve and maintain these structures against environmental degradation.

Looking ahead, several factors may influence the forecasted CAGR of 5.10%.

  • Economic fluctuations and market uncertainties could impact investment decisions and infrastructure spending, potentially affecting the demand for surface protection services.
  • Continued advancements in coating technologies, including the development of sustainable and smart coatings, may drive higher demand for surface protection services among industries seeking innovative solutions.
  • Growing concerns about environmental sustainability may lead to increased adoption of eco-friendly surface protection solutions, influencing market dynamics and growth trends.

Key Trends Influencing the Surface Protection Service Market

  • Rising Adoption in the Automotive Sector

The automotive industry's focus on vehicle aesthetics, durability, and longevity is propelling the demand for surface protection services, including paint protection films and ceramic coatings, to safeguard automotive surfaces from scratches, UV damage, and contaminants.

  • Increasing Application in Industrial Manufacturing

Surface protection services are witnessing higher adoption in industrial manufacturing sectors, including aerospace, marine, and machinery, to extend the lifespan of equipment, prevent corrosion, and enhance operational efficiency.

  • Demand from Electronic Devices

With the proliferation of electronic devices, there is a growing need for surface protection services to safeguard delicate components from moisture, dust, and other contaminants, ensuring optimal performance and longevity.

  • Focus on Anti-Graffiti Solutions

Urban areas and public infrastructure are increasingly targeted by graffiti vandalism. As a result, there is a rising demand for anti-graffiti surface protection services that facilitate easy removal of graffiti without damaging the underlying surface.

  • Shift towards Sustainable Packaging

The packaging industry is moving towards sustainable materials and practices. Surface protection services are crucial in extending the shelf life of eco-friendly packaging materials, such as paper-based products, by providing barrier coatings that protect against moisture, oxygen, and UV radiation.

Nikhil Kaitwade
Nikhil Kaitwade

Principal Consultant

Talk to Analyst

Find your sweet spots for generating winning opportunities in this market.

Comparative View of the Adjacent Surface Protection Service Market

This section provides a comparative view of the surface protection service industry, the corrosion protective coating and acid-proof lining market, and the ballistic protection material market. The table below compares each market from 2024 to 2034, including CAGR, opportunities, and key trends in each market.

Surface Protection Service Market:

Attributes Surface Protection Service Market
CAGR (2024 to 2034) 5.10%
Opportunity Integration of smart technologies for real-time monitoring and predictive maintenance of protected surfaces
Key Trends Rising demand for eco-friendly and sustainable surface protection solutions to reduce environmental impact

Corrosion Protective Coating and Acid-Proof Lining Market:

Attributes Corrosion Protective Coating and Acid-Proof Lining Market
CAGR (2024 to 2034) 5.7%.
Opportunity Expansion in industries like oil & gas and chemical processing, driving the need for advanced corrosion protection solutions
Key Trends Adoption of nanotechnology-based coatings for enhanced corrosion resistance and durability in harsh environments

Ballistic Protection Material Market:

Attributes Ballistic Protection Material Market
CAGR (2024 to 2034) 7.4%
Opportunity Increasing investments in military and law enforcement sectors, fueling the demand for advanced ballistic protection materials
Key Trends Development of lightweight and flexible ballistic materials for improved wearer comfort and mobility without compromising protection

Category-wise Insights

This section provides detailed insights into specific segments in the surface protection service industry.

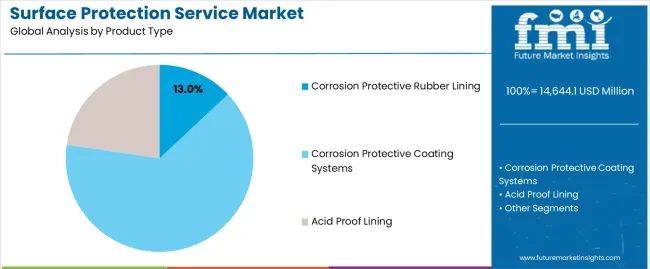
Corrosion Protective Coating Systems Segment to Hold a Share of 64.30% in 2024

Top Product Type Corrosion Protective Coating Systems
Market Share in 2024 64.30%

Corrosion protective coating systems emerge as the dominant category, capturing a significant market share of 64.30% in 2024.

  • Corrosion protective coating systems witness robust growth driven by rising demand across diverse industries such as oil & gas, marine, and automotive.
  • Innovations in coating technologies, including nanocoatings and self-healing coatings, contribute to market expansion by offering superior protection and durability.
  • End-users prioritize coatings that ensure long-term protection against corrosion, enhancing the lifespan of assets and reducing maintenance costs.

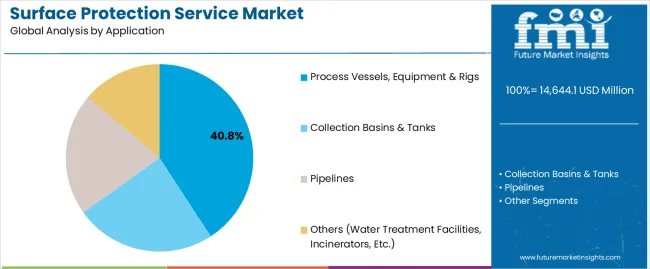
Process Vessels, Equipment & Rigs Segment to Dominate the Industry in 2024

Dominating Application Segment Process Vessels, Equipment & Rigs
Market Share in 2024 40.80%

Process vessels, equipment & rigs emerge as the dominant application segment, commanding a substantial market share of 40.80% in 2024.

  • Growing investments in industrial infrastructure development, particularly in sectors like chemical processing and manufacturing, fuel the demand for surface protection services.
  • With process vessels, equipment, and rigs being critical assets in various industries, there is a heightened focus on protecting them against corrosion and wear.
  • The oil & gas industry constitutes a significant portion of the market demand, driven by the need to protect offshore platforms, pipelines, and refineries from corrosion and harsh environmental conditions.

Get the data you need at a Fraction of the cost

Personalize your report by choosing insights you need
and save 40%!

Country-wise Insights

The section analyzes the surface protection service market across key countries, including the United States, United Kingdom, China, Japan, and Germany. The analysis delves into the specific factors driving the demand for surface protection services in these countries.

Countries CAGR
United States 30.4%
United Kingdom 10.7%
China 25.7%
Japan 12.4%
Germany 15.3%

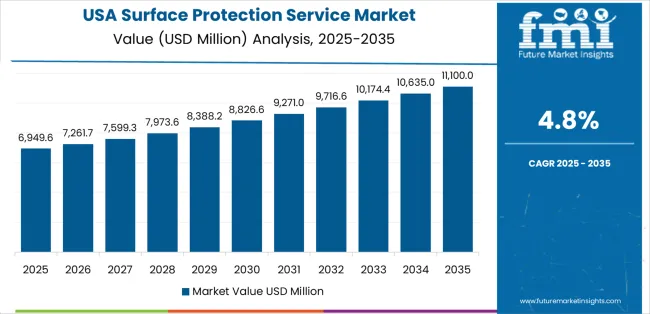
Surface Protection Service Industry in the United States

The surface protection service industry in the United States is anticipated to rise at a CAGR of 30.4% through 2034.

  • The United States government's focus on infrastructure development creates a significant demand for surface protection services.
  • The thriving manufacturing and energy industries drive demand for protection solutions for equipment and facilities.
  • Enhanced awareness of safety risks associated with corrosion and wear & tear fuels the adoption of protective measures.
  • Continuous advancements in coating materials and application techniques make protection solutions more effective and efficient.

Surface Protection Service Industry in the United Kingdom

The surface protection service industry in the United Kingdom is projected to rise at a CAGR of 10.7% through 2034.

  • The need to maintain and protect aging infrastructure across various sectors, including transportation and energy, drives demand.
  • The increasing focus on renewable energy sources, like wind farms, creates a demand for protection solutions for these assets.
  • Similar to the United States, strict safety regulations in the UK mandate the use of protective measures for various applications.
  • The United Kingdom benefits from advancements in technology developed in other countries, further boosting the market's growth.

Surface Protection Service Industry in China

China’s surface protection service industry is likely to witness expansion at a CAGR of 25.7% through 2034.

  • China's ambitious infrastructure development plans create significant demand for surface protection services.
  • The booming manufacturing sector drives the need for protection solutions for industrial equipment and facilities.
  • Rapid urbanization leads to increased demand for protective measures for buildings and other structures.
  • Growing awareness of safety and quality standards creates demand for reliable and effective protection solutions.

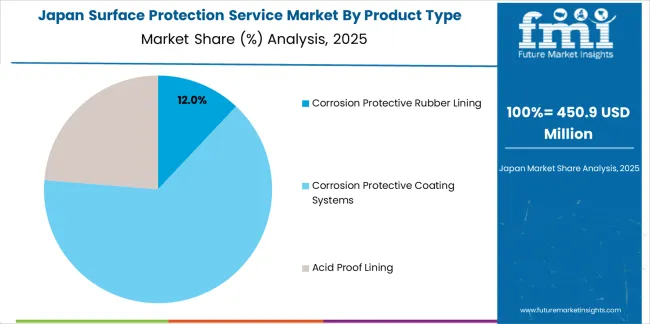
Surface Protection Service Industry in Japan

Japan's surface protection service industry is projected to rise at a CAGR of 12.4% through 2034.

  • Japan's focus on high-tech industries, such as automotive and electronics, necessitates the use of advanced and reliable protection solutions.
  • The need to maintain and protect aging infrastructure across various sectors fuels demand.
  • Japan's renowned focus on quality control translates to a demand for high-performance protection solutions.
  • Japan is a leader in developing innovative coating materials and application techniques, further propelling the market.
  • Growing environmental awareness leads to the adoption of eco-friendly protection solutions.

Surface Protection Service Industry in Germany

Germany's surface protection service market is expected to rise at a 15.3% CAGR through 2034.

  • Germany's robust manufacturing sector creates a significant demand for surface protection solutions for industrial equipment.
  • Germany's commitment to sustainability leads to a demand for eco-friendly and resource-efficient protection solutions.
  • Germany is a leader in developing innovative and efficient protection technologies, further propelling the market.
  • Germany's high-quality standards translate to a demand for reliable and effective protection solutions.

Competition Outlook of the Surface Protection Service Industry

Companies are relentlessly innovating, formulating next-generation coatings boasting superior performance, enhanced durability, and eco-friendliness. Nanotechnology, self-healing properties, and specialized functionalities are paving the way for transformative solutions.

Environmental consciousness is driving a shift towards sustainable practices. Companies are prioritizing the development of eco-friendly formulations, minimizing waste generation, and exploring circular economy solutions to reduce their environmental footprint and cater to environmentally responsible clients.

Industry leaders are consolidating their strengths through strategic mergers and acquisitions, expanding their service portfolios and geographical reach. Recognizing the power of collaboration, companies are forging strategic partnerships with research institutions, startups, and even competitors to tackle complex projects and develop groundbreaking solutions.

Companies are strategically focusing on specialized niches, offering unique solutions for specific applications like concrete protection, high-temperature environments, or temporary protection during construction. This trend fosters innovation and caters to diverse client needs. Recognizing the importance of local nuances, regional players are adapting to specific regulations and challenges, offering culturally relevant solutions, and building strong relationships with local clients to enhance their competitive edge.

Recent Developments in the Surface Protection Service Industry:

  • AkzoNobel unveiled a new powder coating technology that can reduce energy consumption and carbon emissions by up to 25%. The company also completed the sale of its specialty chemicals business to The Carlyle Group and GIC for US$ 12.5 billion on October 1, 2023.
  • Nippon Paint Holdings launched a new anti-viral paint that can deactivate 99.9% of coronaviruses on surfaces on January 28, 2024. The company also acquired the remaining 49% stake in Nippon Paint (India) from its joint venture partner, Berger Paints, on September 30, 2023.

Key Companies in the Market

  • Shawcor
  • PPG Industries
  • Hempel
  • Jotun
  • AkzoNobel
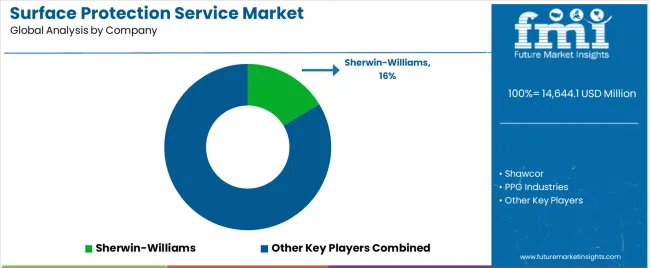
  • Sherwin-Williams
  • Nippon Paint Holdings

Key Coverage in the Surface Protection Service Industry Report

  • Surface Protection Services Market Analysis
  • Surface Protection Films Market
  • Surface Protection Tapes Market
  • Protective Coatings Market
  • Surface Technology Market
  • Sales of Surface Protection Services
  • Industry Trends of Surface Protection Services

Key Segments

By Product Type:

  • Corrosion Protective Rubber Lining
  • Corrosion Protective Coating Systems
  • Acid Proof Lining
    • Ceramic & Brick Lining
    • Tile Lining
    • Thermoplastic Lining

By Application:

  • Process Vessels, Equipment & Rigs
  • Collection Basins & Tanks
  • Pipelines
  • Others (water treatment facilities, incinerators, etc.)

By Region:

  • North America
  • Latin America
  • Europe
  • East Asia
  • South Asia
  • Oceania
  • Middle East and Africa

Frequently Asked Questions

What is the Market Potential for Surface Protection Services?

The surface protection service market is projected to expand at a CAGR of 5.10% between 2024 and 2034.

Which Product Type Segment Dominates the Surface Protection Service Market?

The corrosion protective coating systems segment dominates the industry.

Who are the Top Three Surface Protection Service Providers?

The top 3 surface protection service providers are Shawcor, PPG Industries, and Hempel.

What is the Surface Protection Service Market Growth Outlook for 2034?

The surface protection service market is anticipated to surpass US$ 21,063 million by 2034.

What is Driving the Demand for Surface Protection Services?

Increasing industrial activities and the need to preserve assets against corrosion and wear are driving the demand for surface protection services.

Table of Content

1. Executive Summary

    1.1. Global Market Outlook

    1.2. Demand-side Trends

    1.3. Supply-side Trends

    1.4. Technology Roadmap Analysis

    1.5. Analysis and Recommendations

2. Market Overview

    2.1. Market Coverage / Taxonomy

    2.2. Market Definition / Scope / Limitations

3. Market Background

    3.1. Market Dynamics

        3.1.1. Drivers

        3.1.2. Restraints

        3.1.3. Opportunity

        3.1.4. Trends

    3.2. Scenario Forecast

        3.2.1. Demand in Optimistic Scenario

        3.2.2. Demand in Likely Scenario

        3.2.3. Demand in Conservative Scenario

    3.3. Opportunity Map Analysis

    3.4. Investment Feasibility Matrix

    3.5. PESTLE and Porter’s Analysis

    3.6. Regulatory Landscape

        3.6.1. By Key Regions

        3.6.2. By Key Countries

    3.7. Regional Parent Market Outlook

4. Global Market Analysis 2019 to 2023 and Forecast, 2024 to 2034

    4.1. Historical Market Size Value (US$ Million) Analysis, 2019 to 2023

    4.2. Current and Future Market Size Value (US$ Million) Projections, 2024 to 2034

        4.2.1. Y-o-Y Growth Trend Analysis

        4.2.2. Absolute $ Opportunity Analysis

5. Global Market Analysis 2019 to 2023 and Forecast 2024 to 2034, By Product Type

    5.1. Introduction / Key Findings

    5.2. Historical Market Size Value (US$ Million) Analysis By Product Type, 2019 to 2023

    5.3. Current and Future Market Size Value (US$ Million) Analysis and Forecast By Product Type, 2024 to 2034

        5.3.1. Corrosion Protective Rubber Lining

        5.3.2. Corrosion Protective Coating Systems

        5.3.3. Acid Proof Lining

            5.3.3.1. Ceramic & Brick Lining

            5.3.3.2. Tile Lining

            5.3.3.3. Thermoplastic Lining

    5.4. Y-o-Y Growth Trend Analysis By Product Type, 2019 to 2023

    5.5. Absolute $ Opportunity Analysis By Product Type, 2024 to 2034

6. Global Market Analysis 2019 to 2023 and Forecast 2024 to 2034, By Application

    6.1. Introduction / Key Findings

    6.2. Historical Market Size Value (US$ Million) Analysis By Application, 2019 to 2023

    6.3. Current and Future Market Size Value (US$ Million) Analysis and Forecast By Application, 2024 to 2034

        6.3.1. Process Vessels, Equipment & Rigs

        6.3.2. Collection Basins & Tanks

        6.3.3. Pipelines

        6.3.4. Others

    6.4. Y-o-Y Growth Trend Analysis By Application, 2019 to 2023

    6.5. Absolute $ Opportunity Analysis By Application, 2024 to 2034

7. Global Market Analysis 2019 to 2023 and Forecast 2024 to 2034, By Region

    7.1. Introduction

    7.2. Historical Market Size Value (US$ Million) Analysis By Region, 2019 to 2023

    7.3. Current Market Size Value (US$ Million) Analysis and Forecast By Region, 2024 to 2034

        7.3.1. North America

        7.3.2. Latin America

        7.3.3. Western Europe

        7.3.4. Eastern Europe

        7.3.5. South Asia and Pacific

        7.3.6. East Asia

        7.3.7. Middle East and Africa

    7.4. Market Attractiveness Analysis By Region

8. North America Market Analysis 2019 to 2023 and Forecast 2024 to 2034, By Country

    8.1. Historical Market Size Value (US$ Million) Trend Analysis By Market Taxonomy, 2019 to 2023

    8.2. Market Size Value (US$ Million) Forecast By Market Taxonomy, 2024 to 2034

        8.2.1. By Country

            8.2.1.1. USA

            8.2.1.2. Canada

        8.2.2. By Product Type

        8.2.3. By Application

    8.3. Market Attractiveness Analysis

        8.3.1. By Country

        8.3.2. By Product Type

        8.3.3. By Application

    8.4. Key Takeaways

9. Latin America Market Analysis 2019 to 2023 and Forecast 2024 to 2034, By Country

    9.1. Historical Market Size Value (US$ Million) Trend Analysis By Market Taxonomy, 2019 to 2023

    9.2. Market Size Value (US$ Million) Forecast By Market Taxonomy, 2024 to 2034

        9.2.1. By Country

            9.2.1.1. Brazil

            9.2.1.2. Mexico

            9.2.1.3. Rest of Latin America

        9.2.2. By Product Type

        9.2.3. By Application

    9.3. Market Attractiveness Analysis

        9.3.1. By Country

        9.3.2. By Product Type

        9.3.3. By Application

    9.4. Key Takeaways

10. Western Europe Market Analysis 2019 to 2023 and Forecast 2024 to 2034, By Country

    10.1. Historical Market Size Value (US$ Million) Trend Analysis By Market Taxonomy, 2019 to 2023

    10.2. Market Size Value (US$ Million) Forecast By Market Taxonomy, 2024 to 2034

        10.2.1. By Country

            10.2.1.1. Germany

            10.2.1.2. UK

            10.2.1.3. France

            10.2.1.4. Spain

            10.2.1.5. Italy

            10.2.1.6. Rest of Western Europe

        10.2.2. By Product Type

        10.2.3. By Application

    10.3. Market Attractiveness Analysis

        10.3.1. By Country

        10.3.2. By Product Type

        10.3.3. By Application

    10.4. Key Takeaways

11. Eastern Europe Market Analysis 2019 to 2023 and Forecast 2024 to 2034, By Country

    11.1. Historical Market Size Value (US$ Million) Trend Analysis By Market Taxonomy, 2019 to 2023

    11.2. Market Size Value (US$ Million) Forecast By Market Taxonomy, 2024 to 2034

        11.2.1. By Country

            11.2.1.1. Poland

            11.2.1.2. Russia

            11.2.1.3. Czech Republic

            11.2.1.4. Romania

            11.2.1.5. Rest of Eastern Europe

        11.2.2. By Product Type

        11.2.3. By Application

    11.3. Market Attractiveness Analysis

        11.3.1. By Country

        11.3.2. By Product Type

        11.3.3. By Application

    11.4. Key Takeaways

12. South Asia and Pacific Market Analysis 2019 to 2023 and Forecast 2024 to 2034, By Country

    12.1. Historical Market Size Value (US$ Million) Trend Analysis By Market Taxonomy, 2019 to 2023

    12.2. Market Size Value (US$ Million) Forecast By Market Taxonomy, 2024 to 2034

        12.2.1. By Country

            12.2.1.1. India

            12.2.1.2. Bangladesh

            12.2.1.3. Australia

            12.2.1.4. New Zealand

            12.2.1.5. Rest of South Asia and Pacific

        12.2.2. By Product Type

        12.2.3. By Application

    12.3. Market Attractiveness Analysis

        12.3.1. By Country

        12.3.2. By Product Type

        12.3.3. By Application

    12.4. Key Takeaways

13. East Asia Market Analysis 2019 to 2023 and Forecast 2024 to 2034, By Country

    13.1. Historical Market Size Value (US$ Million) Trend Analysis By Market Taxonomy, 2019 to 2023

    13.2. Market Size Value (US$ Million) Forecast By Market Taxonomy, 2024 to 2034

        13.2.1. By Country

            13.2.1.1. China

            13.2.1.2. Japan

            13.2.1.3. South Korea

        13.2.2. By Product Type

        13.2.3. By Application

    13.3. Market Attractiveness Analysis

        13.3.1. By Country

        13.3.2. By Product Type

        13.3.3. By Application

    13.4. Key Takeaways

14. Middle East and Africa Market Analysis 2019 to 2023 and Forecast 2024 to 2034, By Country

    14.1. Historical Market Size Value (US$ Million) Trend Analysis By Market Taxonomy, 2019 to 2023

    14.2. Market Size Value (US$ Million) Forecast By Market Taxonomy, 2024 to 2034

        14.2.1. By Country

            14.2.1.1. GCC Countries

            14.2.1.2. South Africa

            14.2.1.3. Israel

            14.2.1.4. Rest of MEA

        14.2.2. By Product Type

        14.2.3. By Application

    14.3. Market Attractiveness Analysis

        14.3.1. By Country

        14.3.2. By Product Type

        14.3.3. By Application

    14.4. Key Takeaways

15. Key Countries Market Analysis

    15.1. USA

        15.1.1. Pricing Analysis

        15.1.2. Market Share Analysis, 2023

            15.1.2.1. By Product Type

            15.1.2.2. By Application

    15.2. Canada

        15.2.1. Pricing Analysis

        15.2.2. Market Share Analysis, 2023

            15.2.2.1. By Product Type

            15.2.2.2. By Application

    15.3. Brazil

        15.3.1. Pricing Analysis

        15.3.2. Market Share Analysis, 2023

            15.3.2.1. By Product Type

            15.3.2.2. By Application

    15.4. Mexico

        15.4.1. Pricing Analysis

        15.4.2. Market Share Analysis, 2023

            15.4.2.1. By Product Type

            15.4.2.2. By Application

    15.5. Germany

        15.5.1. Pricing Analysis

        15.5.2. Market Share Analysis, 2023

            15.5.2.1. By Product Type

            15.5.2.2. By Application

    15.6. UK

        15.6.1. Pricing Analysis

        15.6.2. Market Share Analysis, 2023

            15.6.2.1. By Product Type

            15.6.2.2. By Application

    15.7. France

        15.7.1. Pricing Analysis

        15.7.2. Market Share Analysis, 2023

            15.7.2.1. By Product Type

            15.7.2.2. By Application

    15.8. Spain

        15.8.1. Pricing Analysis

        15.8.2. Market Share Analysis, 2023

            15.8.2.1. By Product Type

            15.8.2.2. By Application

    15.9. Italy

        15.9.1. Pricing Analysis

        15.9.2. Market Share Analysis, 2023

            15.9.2.1. By Product Type

            15.9.2.2. By Application

    15.10. Poland

        15.10.1. Pricing Analysis

        15.10.2. Market Share Analysis, 2023

            15.10.2.1. By Product Type

            15.10.2.2. By Application

    15.11. Russia

        15.11.1. Pricing Analysis

        15.11.2. Market Share Analysis, 2023

            15.11.2.1. By Product Type

            15.11.2.2. By Application

    15.12. Czech Republic

        15.12.1. Pricing Analysis

        15.12.2. Market Share Analysis, 2023

            15.12.2.1. By Product Type

            15.12.2.2. By Application

    15.13. Romania

        15.13.1. Pricing Analysis

        15.13.2. Market Share Analysis, 2023

            15.13.2.1. By Product Type

            15.13.2.2. By Application

    15.14. India

        15.14.1. Pricing Analysis

        15.14.2. Market Share Analysis, 2023

            15.14.2.1. By Product Type

            15.14.2.2. By Application

    15.15. Bangladesh

        15.15.1. Pricing Analysis

        15.15.2. Market Share Analysis, 2023

            15.15.2.1. By Product Type

            15.15.2.2. By Application

    15.16. Australia

        15.16.1. Pricing Analysis

        15.16.2. Market Share Analysis, 2023

            15.16.2.1. By Product Type

            15.16.2.2. By Application

    15.17. New Zealand

        15.17.1. Pricing Analysis

        15.17.2. Market Share Analysis, 2023

            15.17.2.1. By Product Type

            15.17.2.2. By Application

    15.18. China

        15.18.1. Pricing Analysis

        15.18.2. Market Share Analysis, 2023

            15.18.2.1. By Product Type

            15.18.2.2. By Application

    15.19. Japan

        15.19.1. Pricing Analysis

        15.19.2. Market Share Analysis, 2023

            15.19.2.1. By Product Type

            15.19.2.2. By Application

    15.20. South Korea

        15.20.1. Pricing Analysis

        15.20.2. Market Share Analysis, 2023

            15.20.2.1. By Product Type

            15.20.2.2. By Application

    15.21. GCC Countries

        15.21.1. Pricing Analysis

        15.21.2. Market Share Analysis, 2023

            15.21.2.1. By Product Type

            15.21.2.2. By Application

    15.22. South Africa

        15.22.1. Pricing Analysis

        15.22.2. Market Share Analysis, 2023

            15.22.2.1. By Product Type

            15.22.2.2. By Application

    15.23. Israel

        15.23.1. Pricing Analysis

        15.23.2. Market Share Analysis, 2023

            15.23.2.1. By Product Type

            15.23.2.2. By Application

16. Market Structure Analysis

    16.1. Competition Dashboard

    16.2. Competition Benchmarking

    16.3. Market Share Analysis of Top Players

        16.3.1. By Regional

        16.3.2. By Product Type

        16.3.3. By Application

17. Competition Analysis

    17.1. Competition Deep Dive

        17.1.1. Protex Products

            17.1.1.1. Overview

            17.1.1.2. Product Portfolio

            17.1.1.3. Profitability by Market Segments

            17.1.1.4. Sales Footprint

            17.1.1.5. Strategy Overview

                17.1.1.5.1. Marketing Strategy

        17.1.2. Aegion Corporation

            17.1.2.1. Overview

            17.1.2.2. Product Portfolio

            17.1.2.3. Profitability by Market Segments

            17.1.2.4. Sales Footprint

            17.1.2.5. Strategy Overview

                17.1.2.5.1. Marketing Strategy

        17.1.3. Moon Fabricating Corporation

            17.1.3.1. Overview

            17.1.3.2. Product Portfolio

            17.1.3.3. Profitability by Market Segments

            17.1.3.4. Sales Footprint

            17.1.3.5. Strategy Overview

                17.1.3.5.1. Marketing Strategy

        17.1.4. Dampney Company

            17.1.4.1. Overview

            17.1.4.2. Product Portfolio

            17.1.4.3. Profitability by Market Segments

            17.1.4.4. Sales Footprint

            17.1.4.5. Strategy Overview

                17.1.4.5.1. Marketing Strategy

        17.1.5. T.F. Warren Group

            17.1.5.1. Overview

            17.1.5.2. Product Portfolio

            17.1.5.3. Profitability by Market Segments

            17.1.5.4. Sales Footprint

            17.1.5.5. Strategy Overview

                17.1.5.5.1. Marketing Strategy

        17.1.6. Applied Rubber Linings Ltd.

            17.1.6.1. Overview

            17.1.6.2. Product Portfolio

            17.1.6.3. Profitability by Market Segments

            17.1.6.4. Sales Footprint

            17.1.6.5. Strategy Overview

                17.1.6.5.1. Marketing Strategy

        17.1.7. Wasser Corporation

            17.1.7.1. Overview

            17.1.7.2. Product Portfolio

            17.1.7.3. Profitability by Market Segments

            17.1.7.4. Sales Footprint

            17.1.7.5. Strategy Overview

                17.1.7.5.1. Marketing Strategy

        17.1.8. Hempel A/S

            17.1.8.1. Overview

            17.1.8.2. Product Portfolio

            17.1.8.3. Profitability by Market Segments

            17.1.8.4. Sales Footprint

            17.1.8.5. Strategy Overview

                17.1.8.5.1. Marketing Strategy

        17.1.9. Delta T & Protective Products

            17.1.9.1. Overview

            17.1.9.2. Product Portfolio

            17.1.9.3. Profitability by Market Segments

            17.1.9.4. Sales Footprint

            17.1.9.5. Strategy Overview

                17.1.9.5.1. Marketing Strategy

        17.1.10. Blair Rubber Co.

            17.1.10.1. Overview

            17.1.10.2. Product Portfolio

            17.1.10.3. Profitability by Market Segments

            17.1.10.4. Sales Footprint

            17.1.10.5. Strategy Overview

                17.1.10.5.1. Marketing Strategy

        17.1.11. Integrated Protective Coating

            17.1.11.1. Overview

            17.1.11.2. Product Portfolio

            17.1.11.3. Profitability by Market Segments

            17.1.11.4. Sales Footprint

            17.1.11.5. Strategy Overview

                17.1.11.5.1. Marketing Strategy

18. Assumptions & Acronyms Used

19. Research Methodology

Don't pay for what you don't need

Customize your report by selecting specific countries or regions and save 30%!

List of Tables

Table 1: Global Market Value (US$ Million) Forecast by Region, 2019 to 2034

Table 2: Global Market Value (US$ Million) Forecast by Product Type, 2019 to 2034

Table 3: Global Market Value (US$ Million) Forecast by Application, 2019 to 2034

Table 4: North America Market Value (US$ Million) Forecast by Country, 2019 to 2034

Table 5: North America Market Value (US$ Million) Forecast by Product Type, 2019 to 2034

Table 6: North America Market Value (US$ Million) Forecast by Application, 2019 to 2034

Table 7: Latin America Market Value (US$ Million) Forecast by Country, 2019 to 2034

Table 8: Latin America Market Value (US$ Million) Forecast by Product Type, 2019 to 2034

Table 9: Latin America Market Value (US$ Million) Forecast by Application, 2019 to 2034

Table 10: Western Europe Market Value (US$ Million) Forecast by Country, 2019 to 2034

Table 11: Western Europe Market Value (US$ Million) Forecast by Product Type, 2019 to 2034

Table 12: Western Europe Market Value (US$ Million) Forecast by Application, 2019 to 2034

Table 13: Eastern Europe Market Value (US$ Million) Forecast by Country, 2019 to 2034

Table 14: Eastern Europe Market Value (US$ Million) Forecast by Product Type, 2019 to 2034

Table 15: Eastern Europe Market Value (US$ Million) Forecast by Application, 2019 to 2034

Table 16: South Asia and Pacific Market Value (US$ Million) Forecast by Country, 2019 to 2034

Table 17: South Asia and Pacific Market Value (US$ Million) Forecast by Product Type, 2019 to 2034

Table 18: South Asia and Pacific Market Value (US$ Million) Forecast by Application, 2019 to 2034

Table 19: East Asia Market Value (US$ Million) Forecast by Country, 2019 to 2034

Table 20: East Asia Market Value (US$ Million) Forecast by Product Type, 2019 to 2034

Table 21: East Asia Market Value (US$ Million) Forecast by Application, 2019 to 2034

Table 22: Middle East and Africa Market Value (US$ Million) Forecast by Country, 2019 to 2034

Table 23: Middle East and Africa Market Value (US$ Million) Forecast by Product Type, 2019 to 2034

Table 24: Middle East and Africa Market Value (US$ Million) Forecast by Application, 2019 to 2034
Nikhil Kaitwade
Nikhil Kaitwade

Principal Consultant

Talk to Analyst

Find your sweet spots for generating winning opportunities in this market.

List of Charts

Figure 1: Global Market Value (US$ Million) by Product Type, 2024 to 2034

Figure 2: Global Market Value (US$ Million) by Application, 2024 to 2034

Figure 3: Global Market Value (US$ Million) by Region, 2024 to 2034

Figure 4: Global Market Value (US$ Million) Analysis by Region, 2019 to 2034

Figure 5: Global Market Value Share (%) and BPS Analysis by Region, 2024 to 2034

Figure 6: Global Market Y-o-Y Growth (%) Projections by Region, 2024 to 2034

Figure 7: Global Market Value (US$ Million) Analysis by Product Type, 2019 to 2034

Figure 8: Global Market Value Share (%) and BPS Analysis by Product Type, 2024 to 2034

Figure 9: Global Market Y-o-Y Growth (%) Projections by Product Type, 2024 to 2034

Figure 10: Global Market Value (US$ Million) Analysis by Application, 2019 to 2034

Figure 11: Global Market Value Share (%) and BPS Analysis by Application, 2024 to 2034

Figure 12: Global Market Y-o-Y Growth (%) Projections by Application, 2024 to 2034

Figure 13: Global Market Attractiveness by Product Type, 2024 to 2034

Figure 14: Global Market Attractiveness by Application, 2024 to 2034

Figure 15: Global Market Attractiveness by Region, 2024 to 2034

Figure 16: North America Market Value (US$ Million) by Product Type, 2024 to 2034

Figure 17: North America Market Value (US$ Million) by Application, 2024 to 2034

Figure 18: North America Market Value (US$ Million) by Country, 2024 to 2034

Figure 19: North America Market Value (US$ Million) Analysis by Country, 2019 to 2034

Figure 20: North America Market Value Share (%) and BPS Analysis by Country, 2024 to 2034

Figure 21: North America Market Y-o-Y Growth (%) Projections by Country, 2024 to 2034

Figure 22: North America Market Value (US$ Million) Analysis by Product Type, 2019 to 2034

Figure 23: North America Market Value Share (%) and BPS Analysis by Product Type, 2024 to 2034

Figure 24: North America Market Y-o-Y Growth (%) Projections by Product Type, 2024 to 2034

Figure 25: North America Market Value (US$ Million) Analysis by Application, 2019 to 2034

Figure 26: North America Market Value Share (%) and BPS Analysis by Application, 2024 to 2034

Figure 27: North America Market Y-o-Y Growth (%) Projections by Application, 2024 to 2034

Figure 28: North America Market Attractiveness by Product Type, 2024 to 2034

Figure 29: North America Market Attractiveness by Application, 2024 to 2034

Figure 30: North America Market Attractiveness by Country, 2024 to 2034

Figure 31: Latin America Market Value (US$ Million) by Product Type, 2024 to 2034

Figure 32: Latin America Market Value (US$ Million) by Application, 2024 to 2034

Figure 33: Latin America Market Value (US$ Million) by Country, 2024 to 2034

Figure 34: Latin America Market Value (US$ Million) Analysis by Country, 2019 to 2034

Figure 35: Latin America Market Value Share (%) and BPS Analysis by Country, 2024 to 2034

Figure 36: Latin America Market Y-o-Y Growth (%) Projections by Country, 2024 to 2034

Figure 37: Latin America Market Value (US$ Million) Analysis by Product Type, 2019 to 2034

Figure 38: Latin America Market Value Share (%) and BPS Analysis by Product Type, 2024 to 2034

Figure 39: Latin America Market Y-o-Y Growth (%) Projections by Product Type, 2024 to 2034

Figure 40: Latin America Market Value (US$ Million) Analysis by Application, 2019 to 2034

Figure 41: Latin America Market Value Share (%) and BPS Analysis by Application, 2024 to 2034

Figure 42: Latin America Market Y-o-Y Growth (%) Projections by Application, 2024 to 2034

Figure 43: Latin America Market Attractiveness by Product Type, 2024 to 2034

Figure 44: Latin America Market Attractiveness by Application, 2024 to 2034

Figure 45: Latin America Market Attractiveness by Country, 2024 to 2034

Figure 46: Western Europe Market Value (US$ Million) by Product Type, 2024 to 2034

Figure 47: Western Europe Market Value (US$ Million) by Application, 2024 to 2034

Figure 48: Western Europe Market Value (US$ Million) by Country, 2024 to 2034

Figure 49: Western Europe Market Value (US$ Million) Analysis by Country, 2019 to 2034

Figure 50: Western Europe Market Value Share (%) and BPS Analysis by Country, 2024 to 2034

Figure 51: Western Europe Market Y-o-Y Growth (%) Projections by Country, 2024 to 2034

Figure 52: Western Europe Market Value (US$ Million) Analysis by Product Type, 2019 to 2034

Figure 53: Western Europe Market Value Share (%) and BPS Analysis by Product Type, 2024 to 2034

Figure 54: Western Europe Market Y-o-Y Growth (%) Projections by Product Type, 2024 to 2034

Figure 55: Western Europe Market Value (US$ Million) Analysis by Application, 2019 to 2034

Figure 56: Western Europe Market Value Share (%) and BPS Analysis by Application, 2024 to 2034

Figure 57: Western Europe Market Y-o-Y Growth (%) Projections by Application, 2024 to 2034

Figure 58: Western Europe Market Attractiveness by Product Type, 2024 to 2034

Figure 59: Western Europe Market Attractiveness by Application, 2024 to 2034

Figure 60: Western Europe Market Attractiveness by Country, 2024 to 2034

Figure 61: Eastern Europe Market Value (US$ Million) by Product Type, 2024 to 2034

Figure 62: Eastern Europe Market Value (US$ Million) by Application, 2024 to 2034

Figure 63: Eastern Europe Market Value (US$ Million) by Country, 2024 to 2034

Figure 64: Eastern Europe Market Value (US$ Million) Analysis by Country, 2019 to 2034

Figure 65: Eastern Europe Market Value Share (%) and BPS Analysis by Country, 2024 to 2034

Figure 66: Eastern Europe Market Y-o-Y Growth (%) Projections by Country, 2024 to 2034

Figure 67: Eastern Europe Market Value (US$ Million) Analysis by Product Type, 2019 to 2034

Figure 68: Eastern Europe Market Value Share (%) and BPS Analysis by Product Type, 2024 to 2034

Figure 69: Eastern Europe Market Y-o-Y Growth (%) Projections by Product Type, 2024 to 2034

Figure 70: Eastern Europe Market Value (US$ Million) Analysis by Application, 2019 to 2034

Figure 71: Eastern Europe Market Value Share (%) and BPS Analysis by Application, 2024 to 2034

Figure 72: Eastern Europe Market Y-o-Y Growth (%) Projections by Application, 2024 to 2034

Figure 73: Eastern Europe Market Attractiveness by Product Type, 2024 to 2034

Figure 74: Eastern Europe Market Attractiveness by Application, 2024 to 2034

Figure 75: Eastern Europe Market Attractiveness by Country, 2024 to 2034

Figure 76: South Asia and Pacific Market Value (US$ Million) by Product Type, 2024 to 2034

Figure 77: South Asia and Pacific Market Value (US$ Million) by Application, 2024 to 2034

Figure 78: South Asia and Pacific Market Value (US$ Million) by Country, 2024 to 2034

Figure 79: South Asia and Pacific Market Value (US$ Million) Analysis by Country, 2019 to 2034

Figure 80: South Asia and Pacific Market Value Share (%) and BPS Analysis by Country, 2024 to 2034

Figure 81: South Asia and Pacific Market Y-o-Y Growth (%) Projections by Country, 2024 to 2034

Figure 82: South Asia and Pacific Market Value (US$ Million) Analysis by Product Type, 2019 to 2034

Figure 83: South Asia and Pacific Market Value Share (%) and BPS Analysis by Product Type, 2024 to 2034

Figure 84: South Asia and Pacific Market Y-o-Y Growth (%) Projections by Product Type, 2024 to 2034

Figure 85: South Asia and Pacific Market Value (US$ Million) Analysis by Application, 2019 to 2034

Figure 86: South Asia and Pacific Market Value Share (%) and BPS Analysis by Application, 2024 to 2034

Figure 87: South Asia and Pacific Market Y-o-Y Growth (%) Projections by Application, 2024 to 2034

Figure 88: South Asia and Pacific Market Attractiveness by Product Type, 2024 to 2034

Figure 89: South Asia and Pacific Market Attractiveness by Application, 2024 to 2034

Figure 90: South Asia and Pacific Market Attractiveness by Country, 2024 to 2034

Figure 91: East Asia Market Value (US$ Million) by Product Type, 2024 to 2034

Figure 92: East Asia Market Value (US$ Million) by Application, 2024 to 2034

Figure 93: East Asia Market Value (US$ Million) by Country, 2024 to 2034

Figure 94: East Asia Market Value (US$ Million) Analysis by Country, 2019 to 2034

Figure 95: East Asia Market Value Share (%) and BPS Analysis by Country, 2024 to 2034

Figure 96: East Asia Market Y-o-Y Growth (%) Projections by Country, 2024 to 2034

Figure 97: East Asia Market Value (US$ Million) Analysis by Product Type, 2019 to 2034

Figure 98: East Asia Market Value Share (%) and BPS Analysis by Product Type, 2024 to 2034

Figure 99: East Asia Market Y-o-Y Growth (%) Projections by Product Type, 2024 to 2034

Figure 100: East Asia Market Value (US$ Million) Analysis by Application, 2019 to 2034

Figure 101: East Asia Market Value Share (%) and BPS Analysis by Application, 2024 to 2034

Figure 102: East Asia Market Y-o-Y Growth (%) Projections by Application, 2024 to 2034

Figure 103: East Asia Market Attractiveness by Product Type, 2024 to 2034

Figure 104: East Asia Market Attractiveness by Application, 2024 to 2034

Figure 105: East Asia Market Attractiveness by Country, 2024 to 2034

Figure 106: Middle East and Africa Market Value (US$ Million) by Product Type, 2024 to 2034

Figure 107: Middle East and Africa Market Value (US$ Million) by Application, 2024 to 2034

Figure 108: Middle East and Africa Market Value (US$ Million) by Country, 2024 to 2034

Figure 109: Middle East and Africa Market Value (US$ Million) Analysis by Country, 2019 to 2034

Figure 110: Middle East and Africa Market Value Share (%) and BPS Analysis by Country, 2024 to 2034

Figure 111: Middle East and Africa Market Y-o-Y Growth (%) Projections by Country, 2024 to 2034

Figure 112: Middle East and Africa Market Value (US$ Million) Analysis by Product Type, 2019 to 2034

Figure 113: Middle East and Africa Market Value Share (%) and BPS Analysis by Product Type, 2024 to 2034

Figure 114: Middle East and Africa Market Y-o-Y Growth (%) Projections by Product Type, 2024 to 2034

Figure 115: Middle East and Africa Market Value (US$ Million) Analysis by Application, 2019 to 2034

Figure 116: Middle East and Africa Market Value Share (%) and BPS Analysis by Application, 2024 to 2034

Figure 117: Middle East and Africa Market Y-o-Y Growth (%) Projections by Application, 2024 to 2034

Figure 118: Middle East and Africa Market Attractiveness by Product Type, 2024 to 2034

Figure 119: Middle East and Africa Market Attractiveness by Application, 2024 to 2034

Figure 120: Middle East and Africa Market Attractiveness by Country, 2024 to 2034

Recommendations

Packaging

Surface Protection Film Market

Published : February 2024

Chemicals & Materials

Surface Disinfectant Products Market

Published : August 2023

Explore Automotive Insights

View Reports

Surface Protection Service Market