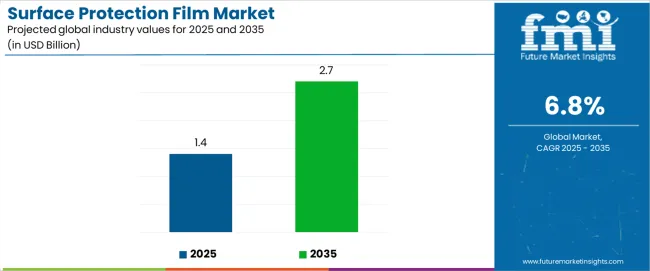
The global surface protection films market is projected to grow from USD 1.56 billion in 2025 to USD 2.46 billion by 2035, reflecting a CAGR of 4.6%. This growth is being driven by the increasing use of surface protection films across construction, automotive, electronics, and interior furnishing industries, where preserving material integrity during manufacturing, storage, and transport is critical.
The interior and construction sectors are expected to account for approximately 44% of market share, fueled by ongoing urbanization, infrastructure investments, and the need for temporary protection of substrates such as metal sheets, PVC profiles, glass, and finished wood.
Leading industry players are actively developing advanced, sustainable product lines to address this evolving demand. Arijit (Bapi) DasGupta, President of Tredegar Surface Protection, emphasized the importance of minimizing material usage without compromising performance, noting, “Our new Optennia product delivers on both commitments. A thinner film requiring 30% less petroleum-based resin than competitive products, Optennia offers an environmentally responsible solution without sacrificing any of the performance that has made us the industry leader.”
Laura Manson, Senior Product Manager at Intertape Polymer Group (IPG), highlighted the company’s latest surface film innovation, stating, “PESP is an exciting new addition to our PE tape line because it offers a low tack, highly conformable product with clean removability for surface protection on a variety of surfaces.” In the nanotechnology segment, Dr. Carolyn Myers, CEO of FendX Technologies, introduced REPELWRAP™ film as the company’s lead innovation: “REPELWRAP™ film is a protective coating film that leverages our award-winning licensed nanotechnology.
It has demonstrated unique repelling properties that prevent the adhesion of bacteria and viruses, reducing their transmission on frequently touched surfaces.” Adoption is rising globally, particularly in the Middle East and Asia-Pacific
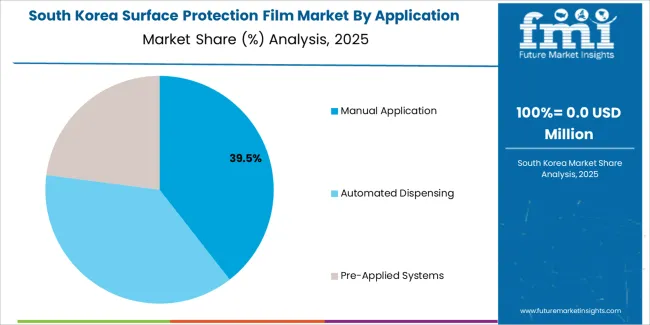
. In the UAE and Saudi Arabia, expanding real estate and industrial construction has led to increased demand for high-performance protection films. Similarly, in markets such as China and South Korea, rapid industrialization and high growth in consumer electronics and automotive sectors are reinforcing the relevance of durable, application-specific surface protection solutions.
Surface Protection Film Industry Forecast
Metric | Value |
---|---|
Industry Size (2025E) | USD 1.56 billion |
Industry Value (2035F) | USD 2.46 billion |
CAGR (2025 to 2035) | 4.6% |
The below table presents the expected CAGR for the global surface protection film market over several semi-annual periods spanning from 2024 to 2034.
Particular | Value CAGR |
---|---|
H1 (2024 to 2034) | 4.5% |
H2 (2024 to 2034) | 4.7% |
H1 (2025 to 2035) | 3.5% |
H2 (2025 to 2035) | 5.7% |
In the first half (H1) of the decade from 2024 to 2034, the business is predicted to surge at a CAGR of 4.5%, followed by a slightly higher growth rate of 4.7% in the second half (H2) of the same decade. Moving into the subsequent period, from H1 2025 to H2 2035, the CAGR is projected to decrease slightly to 3.5% in the first half and remain relatively moderate at 5.7% in the second half. In the first half (H1) the market witnessed a decrease of 100 BPS while in the second half (H2), the market witnessed an increase of 100 BPS.
The global surface protection film market is comprehensively segmented to analyze performance across multiple dimensions. By thickness, the market is categorized into Up to 25 Microns, 25 to 50 Microns, 50 to 100 Microns, 100 to 150 Microns, and Above 150 Microns. In terms of technology, key segments include Adhesion Lamination and Coextrusion Lamination. On the basis of material type, the market is divided into PE, PET, PP, PU, PVC, and Others (which includes biodegradable films, composite films, and hybrid polymer blends).
The color segment comprises Transparent, Translucent, Colored/Tinted, Opaque, and Others (such as matte finish, patterned, and frosted films). By application, it includes Metal Sheets, glass and mirrors, Prepainted Surfaces, Plastic Sheets, PVC Profiles, Furniture Surfaces, and Carpet Protection, along with Others (which account for solar panels, smart devices, and display screens).
Based on end use, the market is segmented into Construction & Interior, Electrical & Electronics, Automotive, Industrial, and Healthcare, with Others covering sectors like aerospace, energy, and marine. Finally, by region, the market spans North America, Latin America, East Asia, South Asia & Pacific, Western Europe, Eastern Europe, and Middle East & Africa.
The 50 to 100 microns thickness range is projected to remain the most lucrative segment in the global surface protection film market through 2035. Estimated to expand at a CAGR of 5.2%, this segment offers an ideal balance between durability and cost-effectiveness, making it a preferred choice across diverse end-use industries such as construction, electronics, and automotive.
Its moderate thickness provides sufficient protection against abrasions, dust, and paint splashes without adding unnecessary weight or cost. Moreover, rising demand for high-end furniture and smart electronics with glass surfaces has further propelled the use of 50-100 micron films. These films are particularly effective for protecting metal sheets, PVC profiles, and pre-painted surfaces during storage and transportation.
Thickness Segment | CAGR (2025 to 2035) |
---|---|
50 to 100 Microns | 5.2% |
Adhesion lamination technology is poised to dominate the surface protection film market, with a projected market share of over 56% in 2025, rising at a CAGR of 4.9%. This technology provides excellent adhesion to a wide range of substrates, including plastics, glass, and metal, and is particularly valued for offering clean removability without surface damage.
Its widespread adoption in electronics and automotive industries stems from the need for temporary yet highly secure protection during component assembly, transit, and installation. Additionally, advancements in solvent-free and water-based adhesives within adhesion lamination processes align with the industry's shift toward sustainability.
Technology Segment | Market Share |
---|---|
Adhesion Lamination | 56% |
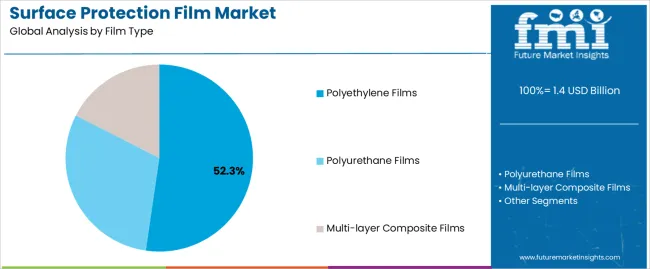
Polyethylene (PE) remains the most extensively used material in surface protection films due to its cost-efficiency, flexibility, and compatibility with various adhesive systems, expanding at a CAGR of 4.4% during the forecast period. PE films are widely deployed for protecting construction materials, metal surfaces, and glass during transport and installation. As industries demand larger volumes of protective solutions for applications like flooring and wall panels, PE continues to serve as a reliable solution.
Though sustainability concerns are gradually pushing the market toward recyclable or biodegradable alternatives, PE is still expected to maintain a significant volume share due to affordability. Enhanced grades of PE with improved mechanical strength and UV resistance are also gaining traction.
Material Segment | CAGR (2025 to 2035) |
---|---|
PE | 4.4% |
Transparent surface protection films are likely to grow at a CAGR of 5.1% from 2025 to 2035, owing to their widespread use in electronics, automotive interiors, and glass surfaces, where visibility is essential during application and inspection. Transparent films allow end users to check for scratches or damage without removing the film, making them a preferred option during quality control stages.
Moreover, these films are also favored in consumer electronics like smartphones, tablets, and displays, where aesthetic appeal is important. The rise of transparent protective solutions with added UV stability and anti-fingerprint features further supports growth in this segment.
Color Segment | CAGR (2025 to 2035) |
---|---|
Transparent | 5.1% |
Surface protection films for metal sheets are gaining prominence as manufacturers seek to protect expensive substrates during fabrication, shipping, and installation. The segment is expected to grow at a CAGR of 5.3% during the forecast period. These films reduce the risk of scratches, stains, and corrosion on metals used in construction, furniture, and automotive assemblies.
With the increasing use of stainless steel and coated metals in architectural designs and luxury interiors, demand for application-specific protection films has surged. Moreover, rising investments in prefabricated buildings and modular construction further amplify the need for durable metal sheet protection during logistics.
Application Segment | CAGR (2025 to 2035) |
---|---|
Metal Sheets | 5.3% |
The construction & interior segment is anticipated to flourish at a CAGR of 5.4% from 2025 to 2035. The consistent boom in real estate, particularly in emerging economies, drives the need for protective films that prevent damage to flooring, glass, marble, and wooden surfaces during construction and renovation.
Luxury interior installations and smart home technologies are pushing developers to rely on high-grade films that ensure substrate preservation until project handover. As cities invest in infrastructure and high-rise developments, the segment is expected to register sustained demand through 2035.
End Use Segment | CAGR (2025 to 2035) |
---|---|
Construction & Interior | 5.4% |
Automobiles and Electronics Sector Accelerate the Market Growth
Surface Protection Films protect screens, metal finishes, and sensitive parts from scratches, dust, and contamination throughout the manufacturing, storage, and transport processes. Mass production of smartphones, tablets, TVs, and laptops has opened up a burgeoning demand in the electronics market for superior-quality protective films offering hardness and scratch resistance.
Similarly, the automotive sector like surface protection films is used for car bodies, headlights, dashboards, and touchscreen displays in order to maintain flawless finish and low maintenance price. The popularity of electric vehicles (EVs) has additionally supported the demand for specialized protection films safeguarding valuable materials like carbon fiber and aluminum panels. The market will experience extremely high growth rates in consumer and industrial uses as a result of ongoing innovations on the film side such as self-healing and anti-fingerprint films.
Construction and Interior Design Industry Growth
The construction and interior design industry triggers surface protection film demand, primarily for glass, marble, wood, and metal surfaces of buildings, houses, and office buildings. These movies shield surfaces from dust, paint spills, and scratches during construction and reconstruction, thus reducing damages and reducing cleaning expenses.
With the growth of luxury interiors, residential and commercial space developers are employing high-quality materials that require temporary protection during installation and maintenance. With the greater application of smart glass and energy-efficient windows, surface protection films need to resist scratches while ensuring clarity in contemporary architecture.
The continuous requirement of biodegradable and environment-friendly options for these types of films is also fuelling the market. Building construction and other industrial development projects in all parts of the globe will guarantee long-term surface protection for costly surfaces and finishes by surface protection films. Demand will hence grow steadily with increased investment of cities in infrastructure developments.
Disposal Issues and Costs of Protective Films
Complexities of High Cost are one of the pillars in the protective film for surface protection business. Self-healing, UV resistance, and fingerprint resistance are the prominent features of developed protective films. Specialized films involve sophisticated processing techniques and also need high quality of raw materials; thus, costs are above the normal protection.
Additionally, most plastics-based surface protection films complicate waste management; they're not readily recyclable and garner intense criticism from governments and the environmental community when it comes to plastic waste manufacture. These factors put pressure on manufacturers to engineer alternative solutions through the creation of eco-friendlier and biodegradable raw materials.
The turn to eco-friendliness usually entails comparatively steep production costs and raw material shortages, thereby making it sluggish in gaining popularity in the market. Removal and residue issues, carried by certain adhesive-backed films, can oftentimes lead to such damage to surfaces as to prevent their use by clients. Overcoming such challenges successfully calls for continuing innovation and investment in cost-efficient and environmentally friendly protective film solutions.
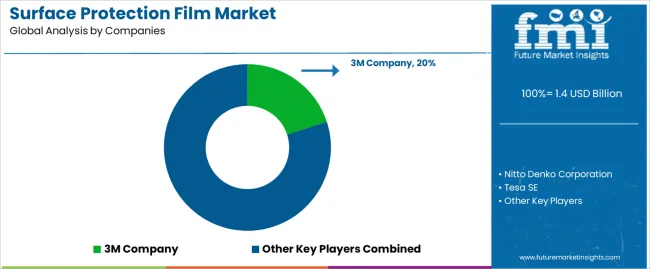
Tier 1 companies comprise market leaders capturing significant market share in global market. These market leaders are characterized by high production capacity and a wide product portfolio. These market leaders are distinguished by their extensive expertise in manufacturing across multiple packaging formats and a broad geographical reach, underpinned by a robust consumer base.
They provide a wide range of series including recycling and manufacturing utilizing the latest technology and meeting the regulatory standards providing the highest quality. Prominent companies within tier 1 include Chargeurs S.A, Nitto Denko Corp, Tredegar Corporation, Polifilm GmbH.
Tier 2 companies include mid-size players having presence in specific regions and highly influencing the local market. These are characterized by a strong presence overseas and strong market knowledge. These market players have good technology and ensure regulatory compliance but may not have advanced technology and wide global reach.
Prominent companies in tier 2 include Bisch of + Klein SE & Co. KG, DUNMORE Corporation, Grafix Plastics, Surface Armor LLC, LAMIN-X Protective Films, Pelloplast OY, MacDermid Autotype Ltd, DUTE Industrial Group.
Tier 3 includes the majority of small-scale companies operating at the local presence and serving niche markets. These companies are notably oriented towards fulfilling local market demands and are consequently classified within the tier 3 share segment.
They are small-scale players and have limited geographical reach. Tier 3, within this context, is recognized as an unorganized market, denoting a sector characterized by a lack of extensive structure and formalization when compared to organized competitors.
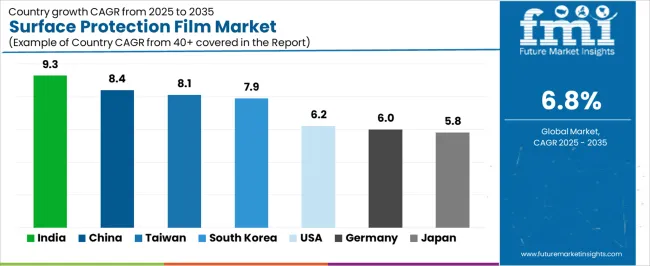
The section below covers the future forecast for the surface protection film market in terms of countries. Information on key countries in several parts of the globe, including North America, Latin America, East Asia, South Asia and Pacific, Western Europe, Eastern Europe and MEA is provided. USA is expected to account for a CAGR of 3.5% through 2035. In Europe, Spain is projected to witness a CAGR of 4.2% by 2035.
Countries | Value CAGR (2025 to 2035) |
---|---|
USA | 3.5% |
Germany | 3.1% |
China | 5.5% |
UK | 3.0% |
Spain | 4.2% |
India | 5.7% |
Canada | 3.3% |
Increasing demand for the semiconductor and consumer electronics sector is functioning as a major driver for surface protection film in the United States. The nation is home to large semiconductor makers and techno-monsters that are fueling the demand for protection films utilized in chip production, electronic display safeguarding, and circuit board shielding.
The spread of fifth-generation technology (5G technology), artificial intelligence (AI), and high-performing computing gadgets have contributed in their own capacity to elevate the production of electronic components with high performance that call for precision preservation from dust, water, and static damage.
Changing applications for protective films following the rapid rise of electric vehicles (EVs) in America offer protection of automotive interiors, battery encasing, and touchscreens. The need for premium surface protection films will thus be continuously on the rise as the USA government invests in local semiconductor manufacturing. The companies are also spending most of their resources on creating eco-friendly and self-healing protective films to meet increasingly strict sustainability requirements and growing consumer expectations.
Germany, as a cutting-edge automotive country, continues to be an important market for surface protection films. BMW, Mercedes Benz, and Volkswagen-protective films are the leaders in automobile manufacturers covering car exteriors, interior panels, and digital screens from scratches, UV rays, and dust.
In the EV and luxury car trends, high-quality, self-healing protective films are becoming more sought after which in turn enhances durability and appearance. Moreover, Germany also has stringent environmental regulations that propel the growth of sustainable protective films, thereby forcing producers to offer biodegradable and recyclable film products.
The building industry also fuels the growth of this market since high-end glass facades, stainless steel surfaces, and wooden interiors need temporary protection while being installed. The German investments in automotive technologies, intelligent factories, and green buildings will thus position the development of surface protection film in progress via technology and environment-friendly material construction.
The Surface Protection Film Market is experiencing significant growth due to rising demand across industries such as automotive, electronics, construction, and packaging. These films provide scratch resistance, impact protection, and contamination prevention, ensuring that surfaces remain in pristine condition during manufacturing, storage, transportation, and installation.
Market growth is fueled by technological advancements in adhesive formulations, increasing demand for high-performance protective coatings, and the shift towards eco-friendly and biodegradable protective films. However, fluctuating raw material costs and concerns about residue after removal are challenges for market players.
Key Developments in Surface Protection Film Market
Report Attributes | Details |
---|---|
Current Total Market Size (2025) | USD 1.56 billion |
Projected Market Size (2035) | USD 2.46 billion |
CAGR (2025 to 2035) | 4.6% |
Base Year for Estimation | 2024 |
Historical Period | 2020 to 2024 |
Projections Period | 2025 to 2035 |
Market Analysis Parameters | Revenue in USD billion |
By Thickness | Up to 25 Microns, 25 to 50 microns, 50 to 100 microns, 100 to 150 microns, Above 150 Microns |
By Technology | Adhesion Lamination, Coextrusion lamination |
By Material | PE, PET, PP, PU, PVC, Others |
By Colour | Transparent, Translucent, Colored/tinted, Opaque, Others |
By Application | Metal sheets, Glass & mirror, Prepainted surfaces, Plastic sheets, PVC Profiles, Furniture surfaces, Carpet Protection, Others |
By End Use | Construction & interior, Electrical & electronics, Automotive, Industrial, Healthcare, Others |
Regions Covered | North America, Latin America, East Asia, South Asia and Pacific, Western Europe, Eastern Europe, Middle East and Africa |
Countries Covered | United States, Japan, Germany, India, United Kingdom, France, Italy, Brazil, Canada, South Korea, Australia, Spain, Netherlands, Saudi Arabia, Switzerland |
Key Players | Chargeurs S.A, Nitto Denko Corp, Tredegar Corporation, Polifilm GmbH, Bischof + Klein SE & Co. KG, DUNMORE Corporation, Grafix Plastics, Surface Armor LLC, LAMIN-X Protective Films, Pelloplast OY |
Additional Attributes | Rising demand for sustainable and eco-friendly materials, Innovations in nanotechnology for enhanced surface protection |
Customization and Pricing | Available upon request |
The surface protection film market is segmented based on thickness, including up to 25 microns, 25 to 50 microns, 50 to 100 microns, 100 to 150 microns, and above 150 microns.
The market is categorized by adhesion lamination and coextrusion lamination. Adhesion lamination is further divided into dry bond lamination, wet bond lamination, energy-curable adhesive lamination, hot melt seal coating, solventless lamination.
Various materials are used in surface protection films, including polyethylene (PE), polyethylene terephthalate (PET), polypropylene (PP), polyurethane (PU), polyvinyl chloride (PVC), and other materials.
Surface protection films are available in different colors, such as transparent, translucent, colored/tinted, and opaque.
These films are widely applied to protect and enhance surfaces, including metal sheets, glass and mirrors, prepainted surfaces, plastic sheets, PVC profiles, furniture surfaces, and carpets, among others.
The key end-use industries for surface protection films include construction and interior, electrical and electronics, automotive, industrial, healthcare, and other sectors.
Key Countries of North America, Latin America, East Asia, South Asia & Pacific, Western Europe, Eastern Europe and Middle East & Africa are covered.
Table 1: Global Market Value (US$ Million) Forecast by Region, 2019 to 2034
Table 2: Global Market Volume (Tons) Forecast by Region, 2019 to 2034
Table 3: Global Market Value (US$ Million) Forecast by Thickness, 2019 to 2034
Table 4: Global Market Volume (Tons) Forecast by Thickness, 2019 to 2034
Table 5: Global Market Value (US$ Million) Forecast by Technology, 2019 to 2034
Table 6: Global Market Volume (Tons) Forecast by Technology, 2019 to 2034
Table 7: Global Market Value (US$ Million) Forecast by Material, 2019 to 2034
Table 8: Global Market Volume (Tons) Forecast by Material, 2019 to 2034
Table 9: Global Market Value (US$ Million) Forecast by Colour, 2019 to 2034
Table 10: Global Market Volume (Tons) Forecast by Colour, 2019 to 2034
Table 11: Global Market Value (US$ Million) Forecast by Application, 2019 to 2034
Table 12: Global Market Volume (Tons) Forecast by Application, 2019 to 2034
Table 13: Global Market Value (US$ Million) Forecast by Industry, 2019 to 2034
Table 14: Global Market Volume (Tons) Forecast by Industry, 2019 to 2034
Table 15: North America Market Value (US$ Million) Forecast by Country, 2019 to 2034
Table 16: North America Market Volume (Tons) Forecast by Country, 2019 to 2034
Table 17: North America Market Value (US$ Million) Forecast by Thickness, 2019 to 2034
Table 18: North America Market Volume (Tons) Forecast by Thickness, 2019 to 2034
Table 19: North America Market Value (US$ Million) Forecast by Technology, 2019 to 2034
Table 20: North America Market Volume (Tons) Forecast by Technology, 2019 to 2034
Table 21: North America Market Value (US$ Million) Forecast by Material, 2019 to 2034
Table 22: North America Market Volume (Tons) Forecast by Material, 2019 to 2034
Table 23: North America Market Value (US$ Million) Forecast by Colour, 2019 to 2034
Table 24: North America Market Volume (Tons) Forecast by Colour, 2019 to 2034
Table 25: North America Market Value (US$ Million) Forecast by Application, 2019 to 2034
Table 26: North America Market Volume (Tons) Forecast by Application, 2019 to 2034
Table 27: North America Market Value (US$ Million) Forecast by Industry, 2019 to 2034
Table 28: North America Market Volume (Tons) Forecast by Industry, 2019 to 2034
Table 29: Latin America Market Value (US$ Million) Forecast by Country, 2019 to 2034
Table 30: Latin America Market Volume (Tons) Forecast by Country, 2019 to 2034
Table 31: Latin America Market Value (US$ Million) Forecast by Thickness, 2019 to 2034
Table 32: Latin America Market Volume (Tons) Forecast by Thickness, 2019 to 2034
Table 33: Latin America Market Value (US$ Million) Forecast by Technology, 2019 to 2034
Table 34: Latin America Market Volume (Tons) Forecast by Technology, 2019 to 2034
Table 35: Latin America Market Value (US$ Million) Forecast by Material, 2019 to 2034
Table 36: Latin America Market Volume (Tons) Forecast by Material, 2019 to 2034
Table 37: Latin America Market Value (US$ Million) Forecast by Colour, 2019 to 2034
Table 38: Latin America Market Volume (Tons) Forecast by Colour, 2019 to 2034
Table 39: Latin America Market Value (US$ Million) Forecast by Application, 2019 to 2034
Table 40: Latin America Market Volume (Tons) Forecast by Application, 2019 to 2034
Table 41: Latin America Market Value (US$ Million) Forecast by Industry, 2019 to 2034
Table 42: Latin America Market Volume (Tons) Forecast by Industry, 2019 to 2034
Table 43: Western Europe Market Value (US$ Million) Forecast by Country, 2019 to 2034
Table 44: Western Europe Market Volume (Tons) Forecast by Country, 2019 to 2034
Table 45: Western Europe Market Value (US$ Million) Forecast by Thickness, 2019 to 2034
Table 46: Western Europe Market Volume (Tons) Forecast by Thickness, 2019 to 2034
Table 47: Western Europe Market Value (US$ Million) Forecast by Technology, 2019 to 2034
Table 48: Western Europe Market Volume (Tons) Forecast by Technology, 2019 to 2034
Table 49: Western Europe Market Value (US$ Million) Forecast by Material, 2019 to 2034
Table 50: Western Europe Market Volume (Tons) Forecast by Material, 2019 to 2034
Table 51: Western Europe Market Value (US$ Million) Forecast by Colour, 2019 to 2034
Table 52: Western Europe Market Volume (Tons) Forecast by Colour, 2019 to 2034
Table 53: Western Europe Market Value (US$ Million) Forecast by Application, 2019 to 2034
Table 54: Western Europe Market Volume (Tons) Forecast by Application, 2019 to 2034
Table 55: Western Europe Market Value (US$ Million) Forecast by Industry, 2019 to 2034
Table 56: Western Europe Market Volume (Tons) Forecast by Industry, 2019 to 2034
Table 57: Eastern Europe Market Value (US$ Million) Forecast by Country, 2019 to 2034
Table 58: Eastern Europe Market Volume (Tons) Forecast by Country, 2019 to 2034
Table 59: Eastern Europe Market Value (US$ Million) Forecast by Thickness, 2019 to 2034
Table 60: Eastern Europe Market Volume (Tons) Forecast by Thickness, 2019 to 2034
Table 61: Eastern Europe Market Value (US$ Million) Forecast by Technology, 2019 to 2034
Table 62: Eastern Europe Market Volume (Tons) Forecast by Technology, 2019 to 2034
Table 63: Eastern Europe Market Value (US$ Million) Forecast by Material, 2019 to 2034
Table 64: Eastern Europe Market Volume (Tons) Forecast by Material, 2019 to 2034
Table 65: Eastern Europe Market Value (US$ Million) Forecast by Colour, 2019 to 2034
Table 66: Eastern Europe Market Volume (Tons) Forecast by Colour, 2019 to 2034
Table 67: Eastern Europe Market Value (US$ Million) Forecast by Application, 2019 to 2034
Table 68: Eastern Europe Market Volume (Tons) Forecast by Application, 2019 to 2034
Table 69: Eastern Europe Market Value (US$ Million) Forecast by Industry, 2019 to 2034
Table 70: Eastern Europe Market Volume (Tons) Forecast by Industry, 2019 to 2034
Table 71: South Asia and Pacific Market Value (US$ Million) Forecast by Country, 2019 to 2034
Table 72: South Asia and Pacific Market Volume (Tons) Forecast by Country, 2019 to 2034
Table 73: South Asia and Pacific Market Value (US$ Million) Forecast by Thickness, 2019 to 2034
Table 74: South Asia and Pacific Market Volume (Tons) Forecast by Thickness, 2019 to 2034
Table 75: South Asia and Pacific Market Value (US$ Million) Forecast by Technology, 2019 to 2034
Table 76: South Asia and Pacific Market Volume (Tons) Forecast by Technology, 2019 to 2034
Table 77: South Asia and Pacific Market Value (US$ Million) Forecast by Material, 2019 to 2034
Table 78: South Asia and Pacific Market Volume (Tons) Forecast by Material, 2019 to 2034
Table 79: South Asia and Pacific Market Value (US$ Million) Forecast by Colour, 2019 to 2034
Table 80: South Asia and Pacific Market Volume (Tons) Forecast by Colour, 2019 to 2034
Table 81: South Asia and Pacific Market Value (US$ Million) Forecast by Application, 2019 to 2034
Table 82: South Asia and Pacific Market Volume (Tons) Forecast by Application, 2019 to 2034
Table 83: South Asia and Pacific Market Value (US$ Million) Forecast by Industry, 2019 to 2034
Table 84: South Asia and Pacific Market Volume (Tons) Forecast by Industry, 2019 to 2034
Table 85: East Asia Market Value (US$ Million) Forecast by Country, 2019 to 2034
Table 86: East Asia Market Volume (Tons) Forecast by Country, 2019 to 2034
Table 87: East Asia Market Value (US$ Million) Forecast by Thickness, 2019 to 2034
Table 88: East Asia Market Volume (Tons) Forecast by Thickness, 2019 to 2034
Table 89: East Asia Market Value (US$ Million) Forecast by Technology, 2019 to 2034
Table 90: East Asia Market Volume (Tons) Forecast by Technology, 2019 to 2034
Table 91: East Asia Market Value (US$ Million) Forecast by Material, 2019 to 2034
Table 92: East Asia Market Volume (Tons) Forecast by Material, 2019 to 2034
Table 93: East Asia Market Value (US$ Million) Forecast by Colour, 2019 to 2034
Table 94: East Asia Market Volume (Tons) Forecast by Colour, 2019 to 2034
Table 95: East Asia Market Value (US$ Million) Forecast by Application, 2019 to 2034
Table 96: East Asia Market Volume (Tons) Forecast by Application, 2019 to 2034
Table 97: East Asia Market Value (US$ Million) Forecast by Industry, 2019 to 2034
Table 98: East Asia Market Volume (Tons) Forecast by Industry, 2019 to 2034
Table 99: Middle East and Africa Market Value (US$ Million) Forecast by Country, 2019 to 2034
Table 100: Middle East and Africa Market Volume (Tons) Forecast by Country, 2019 to 2034
Table 101: Middle East and Africa Market Value (US$ Million) Forecast by Thickness, 2019 to 2034
Table 102: Middle East and Africa Market Volume (Tons) Forecast by Thickness, 2019 to 2034
Table 103: Middle East and Africa Market Value (US$ Million) Forecast by Technology, 2019 to 2034
Table 104: Middle East and Africa Market Volume (Tons) Forecast by Technology, 2019 to 2034
Table 105: Middle East and Africa Market Value (US$ Million) Forecast by Material, 2019 to 2034
Table 106: Middle East and Africa Market Volume (Tons) Forecast by Material, 2019 to 2034
Table 107: Middle East and Africa Market Value (US$ Million) Forecast by Colour, 2019 to 2034
Table 108: Middle East and Africa Market Volume (Tons) Forecast by Colour, 2019 to 2034
Table 109: Middle East and Africa Market Value (US$ Million) Forecast by Application, 2019 to 2034
Table 110: Middle East and Africa Market Volume (Tons) Forecast by Application, 2019 to 2034
Table 111: Middle East and Africa Market Value (US$ Million) Forecast by Industry, 2019 to 2034
Table 112: Middle East and Africa Market Volume (Tons) Forecast by Industry, 2019 to 2034
Figure 1: Global Market Value (US$ Million) by Thickness, 2024 to 2034
Figure 2: Global Market Value (US$ Million) by Technology, 2024 to 2034
Figure 3: Global Market Value (US$ Million) by Material, 2024 to 2034
Figure 4: Global Market Value (US$ Million) by Colour, 2024 to 2034
Figure 5: Global Market Value (US$ Million) by Application, 2024 to 2034
Figure 6: Global Market Value (US$ Million) by Industry, 2024 to 2034
Figure 7: Global Market Value (US$ Million) by Region, 2024 to 2034
Figure 8: Global Market Value (US$ Million) Analysis by Region, 2019 to 2034
Figure 9: Global Market Volume (Tons) Analysis by Region, 2019 to 2034
Figure 10: Global Market Value Share (%) and BPS Analysis by Region, 2024 to 2034
Figure 11: Global Market Y-o-Y Growth (%) Projections by Region, 2024 to 2034
Figure 12: Global Market Value (US$ Million) Analysis by Thickness, 2019 to 2034
Figure 13: Global Market Volume (Tons) Analysis by Thickness, 2019 to 2034
Figure 14: Global Market Value Share (%) and BPS Analysis by Thickness, 2024 to 2034
Figure 15: Global Market Y-o-Y Growth (%) Projections by Thickness, 2024 to 2034
Figure 16: Global Market Value (US$ Million) Analysis by Technology, 2019 to 2034
Figure 17: Global Market Volume (Tons) Analysis by Technology, 2019 to 2034
Figure 18: Global Market Value Share (%) and BPS Analysis by Technology, 2024 to 2034
Figure 19: Global Market Y-o-Y Growth (%) Projections by Technology, 2024 to 2034
Figure 20: Global Market Value (US$ Million) Analysis by Material, 2019 to 2034
Figure 21: Global Market Volume (Tons) Analysis by Material, 2019 to 2034
Figure 22: Global Market Value Share (%) and BPS Analysis by Material, 2024 to 2034
Figure 23: Global Market Y-o-Y Growth (%) Projections by Material, 2024 to 2034
Figure 24: Global Market Value (US$ Million) Analysis by Colour, 2019 to 2034
Figure 25: Global Market Volume (Tons) Analysis by Colour, 2019 to 2034
Figure 26: Global Market Value Share (%) and BPS Analysis by Colour, 2024 to 2034
Figure 27: Global Market Y-o-Y Growth (%) Projections by Colour, 2024 to 2034
Figure 28: Global Market Value (US$ Million) Analysis by Application, 2019 to 2034
Figure 29: Global Market Volume (Tons) Analysis by Application, 2019 to 2034
Figure 30: Global Market Value Share (%) and BPS Analysis by Application, 2024 to 2034
Figure 31: Global Market Y-o-Y Growth (%) Projections by Application, 2024 to 2034
Figure 32: Global Market Value (US$ Million) Analysis by Industry, 2019 to 2034
Figure 33: Global Market Volume (Tons) Analysis by Industry, 2019 to 2034
Figure 34: Global Market Value Share (%) and BPS Analysis by Industry, 2024 to 2034
Figure 35: Global Market Y-o-Y Growth (%) Projections by Industry, 2024 to 2034
Figure 36: Global Market Attractiveness by Thickness, 2024 to 2034
Figure 37: Global Market Attractiveness by Technology, 2024 to 2034
Figure 38: Global Market Attractiveness by Material, 2024 to 2034
Figure 39: Global Market Attractiveness by Colour, 2024 to 2034
Figure 40: Global Market Attractiveness by Application, 2024 to 2034
Figure 41: Global Market Attractiveness by Industry, 2024 to 2034
Figure 42: Global Market Attractiveness by Region, 2024 to 2034
Figure 43: North America Market Value (US$ Million) by Thickness, 2024 to 2034
Figure 44: North America Market Value (US$ Million) by Technology, 2024 to 2034
Figure 45: North America Market Value (US$ Million) by Material, 2024 to 2034
Figure 46: North America Market Value (US$ Million) by Colour, 2024 to 2034
Figure 47: North America Market Value (US$ Million) by Application, 2024 to 2034
Figure 48: North America Market Value (US$ Million) by Industry, 2024 to 2034
Figure 49: North America Market Value (US$ Million) by Country, 2024 to 2034
Figure 50: North America Market Value (US$ Million) Analysis by Country, 2019 to 2034
Figure 51: North America Market Volume (Tons) Analysis by Country, 2019 to 2034
Figure 52: North America Market Value Share (%) and BPS Analysis by Country, 2024 to 2034
Figure 53: North America Market Y-o-Y Growth (%) Projections by Country, 2024 to 2034
Figure 54: North America Market Value (US$ Million) Analysis by Thickness, 2019 to 2034
Figure 55: North America Market Volume (Tons) Analysis by Thickness, 2019 to 2034
Figure 56: North America Market Value Share (%) and BPS Analysis by Thickness, 2024 to 2034
Figure 57: North America Market Y-o-Y Growth (%) Projections by Thickness, 2024 to 2034
Figure 58: North America Market Value (US$ Million) Analysis by Technology, 2019 to 2034
Figure 59: North America Market Volume (Tons) Analysis by Technology, 2019 to 2034
Figure 60: North America Market Value Share (%) and BPS Analysis by Technology, 2024 to 2034
Figure 61: North America Market Y-o-Y Growth (%) Projections by Technology, 2024 to 2034
Figure 62: North America Market Value (US$ Million) Analysis by Material, 2019 to 2034
Figure 63: North America Market Volume (Tons) Analysis by Material, 2019 to 2034
Figure 64: North America Market Value Share (%) and BPS Analysis by Material, 2024 to 2034
Figure 65: North America Market Y-o-Y Growth (%) Projections by Material, 2024 to 2034
Figure 66: North America Market Value (US$ Million) Analysis by Colour, 2019 to 2034
Figure 67: North America Market Volume (Tons) Analysis by Colour, 2019 to 2034
Figure 68: North America Market Value Share (%) and BPS Analysis by Colour, 2024 to 2034
Figure 69: North America Market Y-o-Y Growth (%) Projections by Colour, 2024 to 2034
Figure 70: North America Market Value (US$ Million) Analysis by Application, 2019 to 2034
Figure 71: North America Market Volume (Tons) Analysis by Application, 2019 to 2034
Figure 72: North America Market Value Share (%) and BPS Analysis by Application, 2024 to 2034
Figure 73: North America Market Y-o-Y Growth (%) Projections by Application, 2024 to 2034
Figure 74: North America Market Value (US$ Million) Analysis by Industry, 2019 to 2034
Figure 75: North America Market Volume (Tons) Analysis by Industry, 2019 to 2034
Figure 76: North America Market Value Share (%) and BPS Analysis by Industry, 2024 to 2034
Figure 77: North America Market Y-o-Y Growth (%) Projections by Industry, 2024 to 2034
Figure 78: North America Market Attractiveness by Thickness, 2024 to 2034
Figure 79: North America Market Attractiveness by Technology, 2024 to 2034
Figure 80: North America Market Attractiveness by Material, 2024 to 2034
Figure 81: North America Market Attractiveness by Colour, 2024 to 2034
Figure 82: North America Market Attractiveness by Application, 2024 to 2034
Figure 83: North America Market Attractiveness by Industry, 2024 to 2034
Figure 84: North America Market Attractiveness by Country, 2024 to 2034
Figure 85: Latin America Market Value (US$ Million) by Thickness, 2024 to 2034
Figure 86: Latin America Market Value (US$ Million) by Technology, 2024 to 2034
Figure 87: Latin America Market Value (US$ Million) by Material, 2024 to 2034
Figure 88: Latin America Market Value (US$ Million) by Colour, 2024 to 2034
Figure 89: Latin America Market Value (US$ Million) by Application, 2024 to 2034
Figure 90: Latin America Market Value (US$ Million) by Industry, 2024 to 2034
Figure 91: Latin America Market Value (US$ Million) by Country, 2024 to 2034
Figure 92: Latin America Market Value (US$ Million) Analysis by Country, 2019 to 2034
Figure 93: Latin America Market Volume (Tons) Analysis by Country, 2019 to 2034
Figure 94: Latin America Market Value Share (%) and BPS Analysis by Country, 2024 to 2034
Figure 95: Latin America Market Y-o-Y Growth (%) Projections by Country, 2024 to 2034
Figure 96: Latin America Market Value (US$ Million) Analysis by Thickness, 2019 to 2034
Figure 97: Latin America Market Volume (Tons) Analysis by Thickness, 2019 to 2034
Figure 98: Latin America Market Value Share (%) and BPS Analysis by Thickness, 2024 to 2034
Figure 99: Latin America Market Y-o-Y Growth (%) Projections by Thickness, 2024 to 2034
Figure 100: Latin America Market Value (US$ Million) Analysis by Technology, 2019 to 2034
Figure 101: Latin America Market Volume (Tons) Analysis by Technology, 2019 to 2034
Figure 102: Latin America Market Value Share (%) and BPS Analysis by Technology, 2024 to 2034
Figure 103: Latin America Market Y-o-Y Growth (%) Projections by Technology, 2024 to 2034
Figure 104: Latin America Market Value (US$ Million) Analysis by Material, 2019 to 2034
Figure 105: Latin America Market Volume (Tons) Analysis by Material, 2019 to 2034
Figure 106: Latin America Market Value Share (%) and BPS Analysis by Material, 2024 to 2034
Figure 107: Latin America Market Y-o-Y Growth (%) Projections by Material, 2024 to 2034
Figure 108: Latin America Market Value (US$ Million) Analysis by Colour, 2019 to 2034
Figure 109: Latin America Market Volume (Tons) Analysis by Colour, 2019 to 2034
Figure 110: Latin America Market Value Share (%) and BPS Analysis by Colour, 2024 to 2034
Figure 111: Latin America Market Y-o-Y Growth (%) Projections by Colour, 2024 to 2034
Figure 112: Latin America Market Value (US$ Million) Analysis by Application, 2019 to 2034
Figure 113: Latin America Market Volume (Tons) Analysis by Application, 2019 to 2034
Figure 114: Latin America Market Value Share (%) and BPS Analysis by Application, 2024 to 2034
Figure 115: Latin America Market Y-o-Y Growth (%) Projections by Application, 2024 to 2034
Figure 116: Latin America Market Value (US$ Million) Analysis by Industry, 2019 to 2034
Figure 117: Latin America Market Volume (Tons) Analysis by Industry, 2019 to 2034
Figure 118: Latin America Market Value Share (%) and BPS Analysis by Industry, 2024 to 2034
Figure 119: Latin America Market Y-o-Y Growth (%) Projections by Industry, 2024 to 2034
Figure 120: Latin America Market Attractiveness by Thickness, 2024 to 2034
Figure 121: Latin America Market Attractiveness by Technology, 2024 to 2034
Figure 122: Latin America Market Attractiveness by Material, 2024 to 2034
Figure 123: Latin America Market Attractiveness by Colour, 2024 to 2034
Figure 124: Latin America Market Attractiveness by Application, 2024 to 2034
Figure 125: Latin America Market Attractiveness by Industry, 2024 to 2034
Figure 126: Latin America Market Attractiveness by Country, 2024 to 2034
Figure 127: Western Europe Market Value (US$ Million) by Thickness, 2024 to 2034
Figure 128: Western Europe Market Value (US$ Million) by Technology, 2024 to 2034
Figure 129: Western Europe Market Value (US$ Million) by Material, 2024 to 2034
Figure 130: Western Europe Market Value (US$ Million) by Colour, 2024 to 2034
Figure 131: Western Europe Market Value (US$ Million) by Application, 2024 to 2034
Figure 132: Western Europe Market Value (US$ Million) by Industry, 2024 to 2034
Figure 133: Western Europe Market Value (US$ Million) by Country, 2024 to 2034
Figure 134: Western Europe Market Value (US$ Million) Analysis by Country, 2019 to 2034
Figure 135: Western Europe Market Volume (Tons) Analysis by Country, 2019 to 2034
Figure 136: Western Europe Market Value Share (%) and BPS Analysis by Country, 2024 to 2034
Figure 137: Western Europe Market Y-o-Y Growth (%) Projections by Country, 2024 to 2034
Figure 138: Western Europe Market Value (US$ Million) Analysis by Thickness, 2019 to 2034
Figure 139: Western Europe Market Volume (Tons) Analysis by Thickness, 2019 to 2034
Figure 140: Western Europe Market Value Share (%) and BPS Analysis by Thickness, 2024 to 2034
Figure 141: Western Europe Market Y-o-Y Growth (%) Projections by Thickness, 2024 to 2034
Figure 142: Western Europe Market Value (US$ Million) Analysis by Technology, 2019 to 2034
Figure 143: Western Europe Market Volume (Tons) Analysis by Technology, 2019 to 2034
Figure 144: Western Europe Market Value Share (%) and BPS Analysis by Technology, 2024 to 2034
Figure 145: Western Europe Market Y-o-Y Growth (%) Projections by Technology, 2024 to 2034
Figure 146: Western Europe Market Value (US$ Million) Analysis by Material, 2019 to 2034
Figure 147: Western Europe Market Volume (Tons) Analysis by Material, 2019 to 2034
Figure 148: Western Europe Market Value Share (%) and BPS Analysis by Material, 2024 to 2034
Figure 149: Western Europe Market Y-o-Y Growth (%) Projections by Material, 2024 to 2034
Figure 150: Western Europe Market Value (US$ Million) Analysis by Colour, 2019 to 2034
Figure 151: Western Europe Market Volume (Tons) Analysis by Colour, 2019 to 2034
Figure 152: Western Europe Market Value Share (%) and BPS Analysis by Colour, 2024 to 2034
Figure 153: Western Europe Market Y-o-Y Growth (%) Projections by Colour, 2024 to 2034
Figure 154: Western Europe Market Value (US$ Million) Analysis by Application, 2019 to 2034
Figure 155: Western Europe Market Volume (Tons) Analysis by Application, 2019 to 2034
Figure 156: Western Europe Market Value Share (%) and BPS Analysis by Application, 2024 to 2034
Figure 157: Western Europe Market Y-o-Y Growth (%) Projections by Application, 2024 to 2034
Figure 158: Western Europe Market Value (US$ Million) Analysis by Industry, 2019 to 2034
Figure 159: Western Europe Market Volume (Tons) Analysis by Industry, 2019 to 2034
Figure 160: Western Europe Market Value Share (%) and BPS Analysis by Industry, 2024 to 2034
Figure 161: Western Europe Market Y-o-Y Growth (%) Projections by Industry, 2024 to 2034
Figure 162: Western Europe Market Attractiveness by Thickness, 2024 to 2034
Figure 163: Western Europe Market Attractiveness by Technology, 2024 to 2034
Figure 164: Western Europe Market Attractiveness by Material, 2024 to 2034
Figure 165: Western Europe Market Attractiveness by Colour, 2024 to 2034
Figure 166: Western Europe Market Attractiveness by Application, 2024 to 2034
Figure 167: Western Europe Market Attractiveness by Industry, 2024 to 2034
Figure 168: Western Europe Market Attractiveness by Country, 2024 to 2034
Figure 169: Eastern Europe Market Value (US$ Million) by Thickness, 2024 to 2034
Figure 170: Eastern Europe Market Value (US$ Million) by Technology, 2024 to 2034
Figure 171: Eastern Europe Market Value (US$ Million) by Material, 2024 to 2034
Figure 172: Eastern Europe Market Value (US$ Million) by Colour, 2024 to 2034
Figure 173: Eastern Europe Market Value (US$ Million) by Application, 2024 to 2034
Figure 174: Eastern Europe Market Value (US$ Million) by Industry, 2024 to 2034
Figure 175: Eastern Europe Market Value (US$ Million) by Country, 2024 to 2034
Figure 176: Eastern Europe Market Value (US$ Million) Analysis by Country, 2019 to 2034
Figure 177: Eastern Europe Market Volume (Tons) Analysis by Country, 2019 to 2034
Figure 178: Eastern Europe Market Value Share (%) and BPS Analysis by Country, 2024 to 2034
Figure 179: Eastern Europe Market Y-o-Y Growth (%) Projections by Country, 2024 to 2034
Figure 180: Eastern Europe Market Value (US$ Million) Analysis by Thickness, 2019 to 2034
Figure 181: Eastern Europe Market Volume (Tons) Analysis by Thickness, 2019 to 2034
Figure 182: Eastern Europe Market Value Share (%) and BPS Analysis by Thickness, 2024 to 2034
Figure 183: Eastern Europe Market Y-o-Y Growth (%) Projections by Thickness, 2024 to 2034
Figure 184: Eastern Europe Market Value (US$ Million) Analysis by Technology, 2019 to 2034
Figure 185: Eastern Europe Market Volume (Tons) Analysis by Technology, 2019 to 2034
Figure 186: Eastern Europe Market Value Share (%) and BPS Analysis by Technology, 2024 to 2034
Figure 187: Eastern Europe Market Y-o-Y Growth (%) Projections by Technology, 2024 to 2034
Figure 188: Eastern Europe Market Value (US$ Million) Analysis by Material, 2019 to 2034
Figure 189: Eastern Europe Market Volume (Tons) Analysis by Material, 2019 to 2034
Figure 190: Eastern Europe Market Value Share (%) and BPS Analysis by Material, 2024 to 2034
Figure 191: Eastern Europe Market Y-o-Y Growth (%) Projections by Material, 2024 to 2034
Figure 192: Eastern Europe Market Value (US$ Million) Analysis by Colour, 2019 to 2034
Figure 193: Eastern Europe Market Volume (Tons) Analysis by Colour, 2019 to 2034
Figure 194: Eastern Europe Market Value Share (%) and BPS Analysis by Colour, 2024 to 2034
Figure 195: Eastern Europe Market Y-o-Y Growth (%) Projections by Colour, 2024 to 2034
Figure 196: Eastern Europe Market Value (US$ Million) Analysis by Application, 2019 to 2034
Figure 197: Eastern Europe Market Volume (Tons) Analysis by Application, 2019 to 2034
Figure 198: Eastern Europe Market Value Share (%) and BPS Analysis by Application, 2024 to 2034
Figure 199: Eastern Europe Market Y-o-Y Growth (%) Projections by Application, 2024 to 2034
Figure 200: Eastern Europe Market Value (US$ Million) Analysis by Industry, 2019 to 2034
Figure 201: Eastern Europe Market Volume (Tons) Analysis by Industry, 2019 to 2034
Figure 202: Eastern Europe Market Value Share (%) and BPS Analysis by Industry, 2024 to 2034
Figure 203: Eastern Europe Market Y-o-Y Growth (%) Projections by Industry, 2024 to 2034
Figure 204: Eastern Europe Market Attractiveness by Thickness, 2024 to 2034
Figure 205: Eastern Europe Market Attractiveness by Technology, 2024 to 2034
Figure 206: Eastern Europe Market Attractiveness by Material, 2024 to 2034
Figure 207: Eastern Europe Market Attractiveness by Colour, 2024 to 2034
Figure 208: Eastern Europe Market Attractiveness by Application, 2024 to 2034
Figure 209: Eastern Europe Market Attractiveness by Industry, 2024 to 2034
Figure 210: Eastern Europe Market Attractiveness by Country, 2024 to 2034
Figure 211: South Asia and Pacific Market Value (US$ Million) by Thickness, 2024 to 2034
Figure 212: South Asia and Pacific Market Value (US$ Million) by Technology, 2024 to 2034
Figure 213: South Asia and Pacific Market Value (US$ Million) by Material, 2024 to 2034
Figure 214: South Asia and Pacific Market Value (US$ Million) by Colour, 2024 to 2034
Figure 215: South Asia and Pacific Market Value (US$ Million) by Application, 2024 to 2034
Figure 216: South Asia and Pacific Market Value (US$ Million) by Industry, 2024 to 2034
Figure 217: South Asia and Pacific Market Value (US$ Million) by Country, 2024 to 2034
Figure 218: South Asia and Pacific Market Value (US$ Million) Analysis by Country, 2019 to 2034
Figure 219: South Asia and Pacific Market Volume (Tons) Analysis by Country, 2019 to 2034
Figure 220: South Asia and Pacific Market Value Share (%) and BPS Analysis by Country, 2024 to 2034
Figure 221: South Asia and Pacific Market Y-o-Y Growth (%) Projections by Country, 2024 to 2034
Figure 222: South Asia and Pacific Market Value (US$ Million) Analysis by Thickness, 2019 to 2034
Figure 223: South Asia and Pacific Market Volume (Tons) Analysis by Thickness, 2019 to 2034
Figure 224: South Asia and Pacific Market Value Share (%) and BPS Analysis by Thickness, 2024 to 2034
Figure 225: South Asia and Pacific Market Y-o-Y Growth (%) Projections by Thickness, 2024 to 2034
Figure 226: South Asia and Pacific Market Value (US$ Million) Analysis by Technology, 2019 to 2034
Figure 227: South Asia and Pacific Market Volume (Tons) Analysis by Technology, 2019 to 2034
Figure 228: South Asia and Pacific Market Value Share (%) and BPS Analysis by Technology, 2024 to 2034
Figure 229: South Asia and Pacific Market Y-o-Y Growth (%) Projections by Technology, 2024 to 2034
Figure 230: South Asia and Pacific Market Value (US$ Million) Analysis by Material, 2019 to 2034
Figure 231: South Asia and Pacific Market Volume (Tons) Analysis by Material, 2019 to 2034
Figure 232: South Asia and Pacific Market Value Share (%) and BPS Analysis by Material, 2024 to 2034
Figure 233: South Asia and Pacific Market Y-o-Y Growth (%) Projections by Material, 2024 to 2034
Figure 234: South Asia and Pacific Market Value (US$ Million) Analysis by Colour, 2019 to 2034
Figure 235: South Asia and Pacific Market Volume (Tons) Analysis by Colour, 2019 to 2034
Figure 236: South Asia and Pacific Market Value Share (%) and BPS Analysis by Colour, 2024 to 2034
Figure 237: South Asia and Pacific Market Y-o-Y Growth (%) Projections by Colour, 2024 to 2034
Figure 238: South Asia and Pacific Market Value (US$ Million) Analysis by Application, 2019 to 2034
Figure 239: South Asia and Pacific Market Volume (Tons) Analysis by Application, 2019 to 2034
Figure 240: South Asia and Pacific Market Value Share (%) and BPS Analysis by Application, 2024 to 2034
Figure 241: South Asia and Pacific Market Y-o-Y Growth (%) Projections by Application, 2024 to 2034
Figure 242: South Asia and Pacific Market Value (US$ Million) Analysis by Industry, 2019 to 2034
Figure 243: South Asia and Pacific Market Volume (Tons) Analysis by Industry, 2019 to 2034
Figure 244: South Asia and Pacific Market Value Share (%) and BPS Analysis by Industry, 2024 to 2034
Figure 245: South Asia and Pacific Market Y-o-Y Growth (%) Projections by Industry, 2024 to 2034
Figure 246: South Asia and Pacific Market Attractiveness by Thickness, 2024 to 2034
Figure 247: South Asia and Pacific Market Attractiveness by Technology, 2024 to 2034
Figure 248: South Asia and Pacific Market Attractiveness by Material, 2024 to 2034
Figure 249: South Asia and Pacific Market Attractiveness by Colour, 2024 to 2034
Figure 250: South Asia and Pacific Market Attractiveness by Application, 2024 to 2034
Figure 251: South Asia and Pacific Market Attractiveness by Industry, 2024 to 2034
Figure 252: South Asia and Pacific Market Attractiveness by Country, 2024 to 2034
Figure 253: East Asia Market Value (US$ Million) by Thickness, 2024 to 2034
Figure 254: East Asia Market Value (US$ Million) by Technology, 2024 to 2034
Figure 255: East Asia Market Value (US$ Million) by Material, 2024 to 2034
Figure 256: East Asia Market Value (US$ Million) by Colour, 2024 to 2034
Figure 257: East Asia Market Value (US$ Million) by Application, 2024 to 2034
Figure 258: East Asia Market Value (US$ Million) by Industry, 2024 to 2034
Figure 259: East Asia Market Value (US$ Million) by Country, 2024 to 2034
Figure 260: East Asia Market Value (US$ Million) Analysis by Country, 2019 to 2034
Figure 261: East Asia Market Volume (Tons) Analysis by Country, 2019 to 2034
Figure 262: East Asia Market Value Share (%) and BPS Analysis by Country, 2024 to 2034
Figure 263: East Asia Market Y-o-Y Growth (%) Projections by Country, 2024 to 2034
Figure 264: East Asia Market Value (US$ Million) Analysis by Thickness, 2019 to 2034
Figure 265: East Asia Market Volume (Tons) Analysis by Thickness, 2019 to 2034
Figure 266: East Asia Market Value Share (%) and BPS Analysis by Thickness, 2024 to 2034
Figure 267: East Asia Market Y-o-Y Growth (%) Projections by Thickness, 2024 to 2034
Figure 268: East Asia Market Value (US$ Million) Analysis by Technology, 2019 to 2034
Figure 269: East Asia Market Volume (Tons) Analysis by Technology, 2019 to 2034
Figure 270: East Asia Market Value Share (%) and BPS Analysis by Technology, 2024 to 2034
Figure 271: East Asia Market Y-o-Y Growth (%) Projections by Technology, 2024 to 2034
Figure 272: East Asia Market Value (US$ Million) Analysis by Material, 2019 to 2034
Figure 273: East Asia Market Volume (Tons) Analysis by Material, 2019 to 2034
Figure 274: East Asia Market Value Share (%) and BPS Analysis by Material, 2024 to 2034
Figure 275: East Asia Market Y-o-Y Growth (%) Projections by Material, 2024 to 2034
Figure 276: East Asia Market Value (US$ Million) Analysis by Colour, 2019 to 2034
Figure 277: East Asia Market Volume (Tons) Analysis by Colour, 2019 to 2034
Figure 278: East Asia Market Value Share (%) and BPS Analysis by Colour, 2024 to 2034
Figure 279: East Asia Market Y-o-Y Growth (%) Projections by Colour, 2024 to 2034
Figure 280: East Asia Market Value (US$ Million) Analysis by Application, 2019 to 2034
Figure 281: East Asia Market Volume (Tons) Analysis by Application, 2019 to 2034
Figure 282: East Asia Market Value Share (%) and BPS Analysis by Application, 2024 to 2034
Figure 283: East Asia Market Y-o-Y Growth (%) Projections by Application, 2024 to 2034
Figure 284: East Asia Market Value (US$ Million) Analysis by Industry, 2019 to 2034
Figure 285: East Asia Market Volume (Tons) Analysis by Industry, 2019 to 2034
Figure 286: East Asia Market Value Share (%) and BPS Analysis by Industry, 2024 to 2034
Figure 287: East Asia Market Y-o-Y Growth (%) Projections by Industry, 2024 to 2034
Figure 288: East Asia Market Attractiveness by Thickness, 2024 to 2034
Figure 289: East Asia Market Attractiveness by Technology, 2024 to 2034
Figure 290: East Asia Market Attractiveness by Material, 2024 to 2034
Figure 291: East Asia Market Attractiveness by Colour, 2024 to 2034
Figure 292: East Asia Market Attractiveness by Application, 2024 to 2034
Figure 293: East Asia Market Attractiveness by Industry, 2024 to 2034
Figure 294: East Asia Market Attractiveness by Country, 2024 to 2034
Figure 295: Middle East and Africa Market Value (US$ Million) by Thickness, 2024 to 2034
Figure 296: Middle East and Africa Market Value (US$ Million) by Technology, 2024 to 2034
Figure 297: Middle East and Africa Market Value (US$ Million) by Material, 2024 to 2034
Figure 298: Middle East and Africa Market Value (US$ Million) by Colour, 2024 to 2034
Figure 299: Middle East and Africa Market Value (US$ Million) by Application, 2024 to 2034
Figure 300: Middle East and Africa Market Value (US$ Million) by Industry, 2024 to 2034
Figure 301: Middle East and Africa Market Value (US$ Million) by Country, 2024 to 2034
Figure 302: Middle East and Africa Market Value (US$ Million) Analysis by Country, 2019 to 2034
Figure 303: Middle East and Africa Market Volume (Tons) Analysis by Country, 2019 to 2034
Figure 304: Middle East and Africa Market Value Share (%) and BPS Analysis by Country, 2024 to 2034
Figure 305: Middle East and Africa Market Y-o-Y Growth (%) Projections by Country, 2024 to 2034
Figure 306: Middle East and Africa Market Value (US$ Million) Analysis by Thickness, 2019 to 2034
Figure 307: Middle East and Africa Market Volume (Tons) Analysis by Thickness, 2019 to 2034
Figure 308: Middle East and Africa Market Value Share (%) and BPS Analysis by Thickness, 2024 to 2034
Figure 309: Middle East and Africa Market Y-o-Y Growth (%) Projections by Thickness, 2024 to 2034
Figure 310: Middle East and Africa Market Value (US$ Million) Analysis by Technology, 2019 to 2034
Figure 311: Middle East and Africa Market Volume (Tons) Analysis by Technology, 2019 to 2034
Figure 312: Middle East and Africa Market Value Share (%) and BPS Analysis by Technology, 2024 to 2034
Figure 313: Middle East and Africa Market Y-o-Y Growth (%) Projections by Technology, 2024 to 2034
Figure 314: Middle East and Africa Market Value (US$ Million) Analysis by Material, 2019 to 2034
Figure 315: Middle East and Africa Market Volume (Tons) Analysis by Material, 2019 to 2034
Figure 316: Middle East and Africa Market Value Share (%) and BPS Analysis by Material, 2024 to 2034
Figure 317: Middle East and Africa Market Y-o-Y Growth (%) Projections by Material, 2024 to 2034
Figure 318: Middle East and Africa Market Value (US$ Million) Analysis by Colour, 2019 to 2034
Figure 319: Middle East and Africa Market Volume (Tons) Analysis by Colour, 2019 to 2034
Figure 320: Middle East and Africa Market Value Share (%) and BPS Analysis by Colour, 2024 to 2034
Figure 321: Middle East and Africa Market Y-o-Y Growth (%) Projections by Colour, 2024 to 2034
Figure 322: Middle East and Africa Market Value (US$ Million) Analysis by Application, 2019 to 2034
Figure 323: Middle East and Africa Market Volume (Tons) Analysis by Application, 2019 to 2034
Figure 324: Middle East and Africa Market Value Share (%) and BPS Analysis by Application, 2024 to 2034
Figure 325: Middle East and Africa Market Y-o-Y Growth (%) Projections by Application, 2024 to 2034
Figure 326: Middle East and Africa Market Value (US$ Million) Analysis by Industry, 2019 to 2034
Figure 327: Middle East and Africa Market Volume (Tons) Analysis by Industry, 2019 to 2034
Figure 328: Middle East and Africa Market Value Share (%) and BPS Analysis by Industry, 2024 to 2034
Figure 329: Middle East and Africa Market Y-o-Y Growth (%) Projections by Industry, 2024 to 2034
Figure 330: Middle East and Africa Market Attractiveness by Thickness, 2024 to 2034
Figure 331: Middle East and Africa Market Attractiveness by Technology, 2024 to 2034
Figure 332: Middle East and Africa Market Attractiveness by Material, 2024 to 2034
Figure 333: Middle East and Africa Market Attractiveness by Colour, 2024 to 2034
Figure 334: Middle East and Africa Market Attractiveness by Application, 2024 to 2034
Figure 335: Middle East and Africa Market Attractiveness by Industry, 2024 to 2034
Figure 336: Middle East and Africa Market Attractiveness by Country, 2024 to 2034
The global surface protection film industry is projected to witness CAGR of 4.6% between 2025 and 2035.
The global surface protection film industry stood at USD 1,500 million in 2024.
Global surface protection film industry is anticipated to reach USD 2.46 billion by 2035 end.
East Asia is set to record a CAGR of 5.7% in assessment period.
The key players operating in the global surface protection film industry include Chargeurs S.A, Nitto Denko Corp, Tredegar Corporation, Polifilm GmbH.
Explore Similar Insights
Thank you!
You will receive an email from our Business Development Manager. Please be sure to check your SPAM/JUNK folder too.