The surface printed film market is valued at USD 12,847 million in 2025 and is projected to reach USD 21,532.1 million by 2035, advancing at a CAGR of 5.3%. Growth is driven by the expanding demand for packaging with advanced printing systems, the need for enhanced brand differentiation, and the adoption of sustainable packaging solutions across multiple industries, especially food and beverage. Polyethylene films dominate the market, accounting for 41% of the share, due to their excellent compatibility with printing processes and broad application across consumer goods packaging. The food & beverage packaging segment leads the application category, holding 46% of the market share in 2025, driven by the need for visually appealing and durable packaging that meets safety and branding requirements.
Key growth regions include North America, Europe, and Asia Pacific, with India and China leading regional growth at 6.4% and 6.1% CAGR, respectively, due to rapid packaging modernization and consumer development. The market is moderately competitive, with Amcor plc, Berry Global Inc., Sealed Air Corporation, Constantia Flexibles Group, and Mondi Group driving innovation in printing technologies, material reliability, and packaging versatility to enhance product differentiation and operational efficiency in the global market.
Technological advancements in printing techniques are also contributing to the growth of the surface printed film market. Innovations such as digital printing, high-definition flexographic printing, and gravure printing have improved the quality, speed, and cost-effectiveness of surface printed films. These advancements allow for sharper, more vibrant colors, intricate designs, and the ability to print on various types of films, including polyethylene, polypropylene, and polyester. These improvements are making surface printed films more versatile and appealing to a broader range of industries, further driving their adoption.
The market faces challenges, particularly in terms of material costs and the environmental impact of certain types of packaging. While surface printed films offer many benefits, the rising cost of raw materials, such as petroleum-based plastics, could increase production costs for manufacturers. Moreover, while advancements in sustainable materials are being made, the packaging industry still faces challenges in developing films that are both high-performance and environmentally friendly. The demand for biodegradable or compostable films, while growing, requires ongoing investment in research and development to ensure these alternatives meet the performance standards required for packaging applications.
The competitive landscape of the packaging industry, along with fluctuations in raw material prices and evolving consumer preferences, could impact market dynamics. Manufacturers need to continuously innovate and optimize their production processes to remain competitive in a market that is becoming increasingly focused on sustainability, cost-efficiency, and product differentiation.
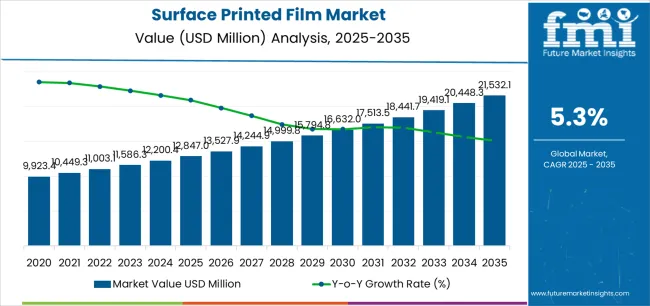
The surface printed film market demonstrates distinct growth phases with varying market characteristics and competitive dynamics. Between 2025 and 2030, the market progresses through its technology adoption phase, expanding from USD 12,847 million to USD 16,428 million with steady annual increments averaging 5.0% growth. This period showcases the transition from basic printed packaging solutions to advanced systems with enhanced printing capabilities and integrated quality monitoring becoming mainstream features.
The 2025-2030 phase adds USD 3,581 million to market value, representing 41% of total decade expansion. Market maturation factors include standardization of printing protocols, declining component costs for production materials, and increasing brand awareness of surface printed film benefits reaching 85-90% effectiveness in packaging applications. Competitive landscape evolution during this period features established manufacturers like Amcor plc and Berry Global Inc. expanding their printed film portfolios while new entrants focus on specialized formulations and enhanced printing efficiency.
From 2030 to 2035, market dynamics shift toward advanced integration and multi-facility deployment, with growth accelerating from USD 16,428 million to USD 21,532.1 million, adding USD 5,135 million or 59% of total expansion. This phase transition logic centers on universal packaging systems, integration with production automation networks, and deployment across diverse commercial scenarios, becoming standard rather than specialized applications. The competitive environment matures with focus shifting from basic printing capability to comprehensive packaging systems and integration with brand management platforms.
| Metric | Value |
|---|---|
| Market Value (2025) | USD 12,847 million |
| Market Forecast (2035) | USD 21,532.1 million |
| Growth Rate | 5.30% CAGR |
| Leading Technology | Polyethylene |
| Primary Application | Food & Beverage Packaging Segment |
The market demonstrates strong fundamentals with polyethylene systems capturing a dominant share through advanced printing compatibility and reliable deployment capabilities. Food and beverage applications drive primary demand, supported by increasing brand spending on advanced packaging systems and visual performance management solutions. Geographic expansion remains concentrated in developed markets with established packaging infrastructure, while emerging economies show accelerating adoption rates driven by brand modernization and rising consumer requirements.
The surface printed film market represents a compelling intersection of packaging innovation, brand differentiation, and quality management. With robust growth projected from USD 12,847 million in 2025 to USD 21,532.1 million by 2035 at a 5.30% CAGR, this market is driven by increasing consumer consciousness, commercial infrastructure upgrades, and regulatory pressures for reliable packaging practices.
The market's expansion reflects a fundamental shift in how packaging manufacturers and brand owners approach decoration infrastructure. Strong growth opportunities exist across diverse applications, from food operations requiring reliable barrier quality to pharmaceutical facilities demanding advanced printing standards. Geographic expansion is particularly pronounced in Asia-Pacific markets, led by India (6.4% CAGR) and China (6.1% CAGR), while established markets in North America and Europe drive premium positioning and technology innovation.
The dominance of polyethylene systems and food packaging applications underscores the importance of proven printing technology and operational reliability in driving adoption. Application complexity and infrastructure compatibility remain key challenges, creating opportunities for companies that can simplify deployment while maintaining performance standards.
Market expansion rests on three fundamental shifts driving adoption across packaging and consumer goods sectors. 1. Advanced decoration demand creates compelling operational advantages through surface printed film systems that provide immediate brand recognition with reliable performance, enabling manufacturers to enhance product appeal while maintaining production efficiency and reducing decoration costs. 2. Packaging modernization programs accelerate as facilities worldwide seek advanced printing systems that complement traditional packaging materials, enabling precise decoration solutions that align with brand goals and quality certification requirements. 3. Consumer engagement drives adoption from retail and brand facilities requiring effective visual solutions that maximize shelf appeal while maintaining package integrity during distribution and retail applications.
However, growth faces headwinds from production complexity challenges that vary across facility types regarding equipment integration and performance requirements, potentially limiting deployment flexibility in certain packaging environments. Technical limitations also persist regarding printing resolution and color consistency that may increase operational costs in high-definition applications with demanding visual standards.
Primary Classification: The market segments by product type into polyethylene, polypropylene, polyester, and polyvinyl chloride categories, representing the evolution from basic packaging films to advanced printing substrates for comprehensive decoration operations.
Secondary Breakdown: Application segmentation divides the market into food & beverage packaging, pharmaceutical packaging, personal care & cosmetics, industrial packaging, and others sectors, reflecting distinct requirements for printing standards, barrier integration, and regulatory compliance.
Regional Classification: Geographic distribution covers North America, Europe, Asia Pacific, Latin America, and the Middle East & Africa, with developed markets leading adoption while emerging economies show accelerating growth patterns driven by packaging modernization programs.
The segmentation structure reveals technology progression from polyethylene printing systems toward integrated multi-material platforms with enhanced decoration and barrier capabilities, while application diversity spans from food operations to pharmaceutical facilities requiring precise quality management solutions.
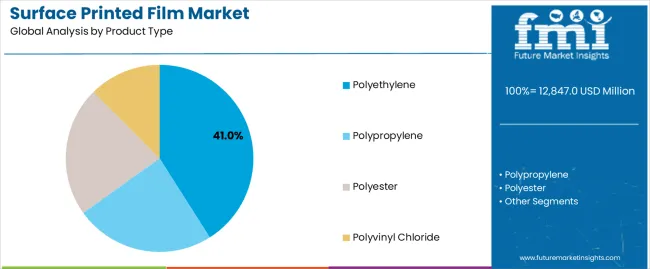
Polyethylene segment is estimated to account for 41% of the surface printed film market share in 2025. The segment's leading position stems from its fundamental role as a critical component in flexible packaging applications and its extensive use across multiple consumer goods sectors. Polyethylene film's dominance is attributed to its superior printing compatibility, including ink adhesion, moisture resistance, and processing flexibility capabilities that make it indispensable for food packaging operations.
Market Position: Polyethylene systems command the leading position in the surface printed film market through advanced printing features, including comprehensive color reproduction, extended shelf life, and reliable performance that enable manufacturers to deploy advanced decoration solutions across diverse packaging environments.
Value Drivers: The segment benefits from brand preference for proven printing technology that provides immediate visual impact without requiring complex production modifications. Reliable design features enable deployment in food packaging environments, retail facilities, and distribution applications where appearance and protection represent critical operational requirements.
Competitive Advantages: Polyethylene systems differentiate through excellent printability, proven barrier performance, and compatibility with standard packaging equipment that enhance brand recognition while maintaining cost-effective operational profiles suitable for diverse packaging applications.
Key market characteristics:
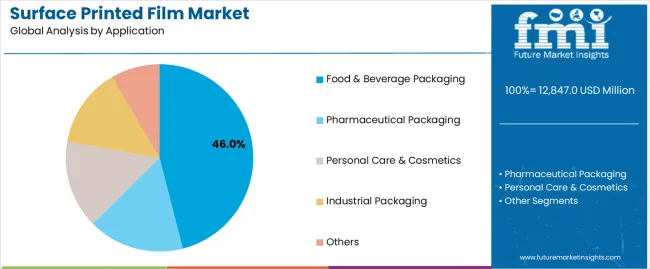
Food & beverage packaging segment is projected to hold 46% of the surface printed film market share in 2025. The segment's market leadership is driven by the extensive use of surface printed film in product wrapping, flexible pouches, label decoration, and container protection, where film serves as both a decorative layer and barrier enhancer. The food industry's consistent demand for high-quality, reliable packaging materials supports the segment's dominant position.
Market Context: Food applications dominate the market due to widespread adoption of advanced printing materials and increasing focus on brand differentiation management, consumer appeal, and shelf presence applications that enhance product recognition while maintaining package integrity.
Appeal Factors: Food customers prioritize material safety, printing consistency, and integration with existing packaging infrastructure that enables coordinated deployment across multiple production systems. The segment benefits from substantial brand budgets and modernization programs that emphasize visual enhancement for food and retail operations.
Growth Drivers: Packaging modernization programs incorporate surface printed film as standard materials for food decoration and brand applications. At the same time, retail industry initiatives are increasing demand for high-quality printing that complies with food safety standards and enhances consumer engagement.
Market Challenges: Production requirements and equipment compatibility issues may limit deployment flexibility in certain facility types or existing infrastructure scenarios.
Application dynamics include:
Growth Accelerators: Packaging modernization drives primary adoption as surface printed film systems provide reliable decoration capabilities that enable brand differentiation without adhesives, supporting regulatory compliance and operational efficiency that require precise visual management. Consumer demand accelerates market expansion as brands seek effective decoration solutions that maximize shelf appeal while maintaining barrier standards during retail display and distribution operations. Marketing spending increases worldwide, creating sustained demand for advanced printing systems that complement traditional packaging materials and provide operational flexibility in complex retail environments.
Growth Inhibitors: Production complexity challenges vary across facility types regarding equipment integration and performance requirements, which may limit deployment flexibility and market penetration in facilities with restrictive infrastructure modifications. Technical performance limitations persist regarding high-speed printing applications and color matching that may increase operational costs in demanding environments with frequent product changeovers. Market fragmentation across multiple packaging standards and printing specifications creates compatibility concerns between different film manufacturers and existing facility infrastructure.
Market Evolution Patterns: Adoption accelerates in food and retail sectors where advanced printing justifies material costs, with geographic concentration in developed markets transitioning toward mainstream adoption in emerging economies driven by brand modernization and consumer development. Technology development focuses on enhanced printing resolution, improved barrier properties, and integration with quality management systems that optimize production scheduling and visual monitoring. The market could face disruption if alternative decoration technologies or regulatory restrictions significantly limit surface printed film deployment in food or pharmaceutical applications.
The surface printed film market demonstrates varied regional dynamics with Growth Leaders including India (6.4% CAGR) and China (6.1% CAGR) driving expansion through packaging modernization and consumer development. Steady Performers encompass the USA (5.8% CAGR), Germany (5.2% CAGR), and Japan (4.8% CAGR), benefiting from established packaging sectors and advanced printing adoption.
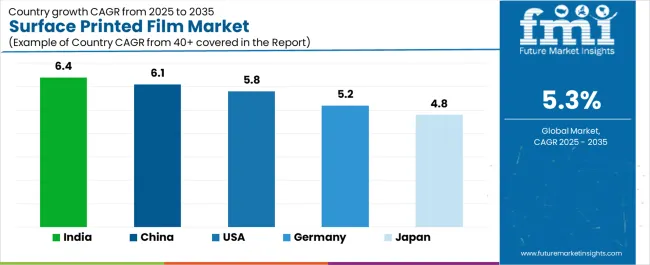
| Country | CAGR (2025-2035) |
|---|---|
| India | 6.4% |
| China | 6.1% |
| USA | 5.8% |
| Germany | 5.2% |
| Japan | 4.8% |
Regional synthesis reveals Asia-Pacific markets leading growth through packaging modernization and consumer development, while European countries maintain steady expansion supported by technology advancement and brand modernization requirements. North American markets show strong growth driven by food applications and retail facility integration trends.
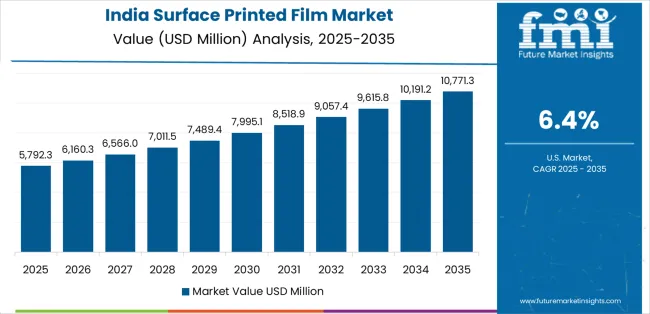
India establishes regional leadership through aggressive packaging modernization programs and comprehensive consumer development, integrating advanced surface printed film systems as standard components in food and retail applications. The country's 6.4% CAGR through 2035 reflects government initiatives promoting packaging technology and domestic manufacturing capabilities that mandate the use of advanced printing systems in food and retail operations. Growth concentrates in major urban centers, including Mumbai, Delhi, and Bangalore, where brand modernization showcases integrated printing systems that appeal to domestic operators seeking advanced decoration solutions and consumer engagement applications.
Indian manufacturers are developing cost-effective surface printed film solutions that combine domestic production advantages with advanced features, including multi-color printing systems and extended barrier capacity.
Strategic Market Indicators:
The Chinese market emphasizes large-scale production deployment, including rapid manufacturing expansion and comprehensive packaging development that increasingly incorporates surface printed film for brand decoration and product protection applications. The country is projected to show a 6.1% CAGR through 2035, driven by massive consumer investments under retail development programs and commercial demand for reliable, cost-effective printing systems. Chinese packaging facilities prioritize operational effectiveness with surface printed film delivering consistent performance through advanced printing properties and production versatility capabilities.
Technology deployment channels include major packaging suppliers, specialized brand companies, and institutional procurement programs that support professional installation for complex manufacturing applications.
Performance Metrics:
The USA market emphasizes advanced surface printed film features, including precision printing systems and integration with comprehensive brand platforms that manage product decoration, quality scheduling, and visual tracking applications through unified packaging systems. The country is projected to show a 5.8% CAGR through 2035, driven by facility modernization under packaging equipment upgrades and commercial demand for reliable, advanced printing systems. American packaging facilities prioritize operational effectiveness with surface printed film delivering consistent performance through advanced material formulations and quality monitoring capabilities.
Technology deployment channels include major packaging distributors, specialized brand providers, and facility procurement programs that support professional production for complex food operations.
Performance Metrics:
In Frankfurt, Munich, and Hamburg, German packaging facilities and brand companies are implementing advanced surface printed film systems to enhance product decoration capabilities and support regulatory compliance that aligns with food safety requirements and operational protocols. The German market demonstrates sustained growth with a 5.2% CAGR through 2035, driven by facility modernization programs and packaging equipment upgrades that emphasize advanced printing systems for food and pharmaceutical applications. German packaging facilities are prioritizing surface printed film systems that provide reliable decoration capabilities while maintaining compliance with food contact standards and minimizing quality failures, particularly important in premium food and pharmaceutical operations.
Market expansion benefits from quality excellence programs that mandate high-performance materials in packaging facility specifications, creating sustained demand across Germany's food and consumer goods sectors, where visual reliability and safety represent critical requirements.
Strategic Market Indicators:
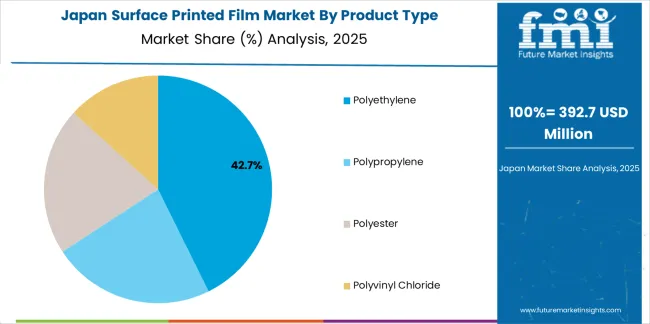
Japan's advanced packaging market demonstrates sophisticated surface printed film deployment, growing at 4.8% CAGR, with documented operational effectiveness in food packaging and consumer goods applications through integration with existing production systems and quality control infrastructure. The country leverages engineering expertise in material technology and precision manufacturing to maintain market leadership. Packaging centers, including Tokyo, Osaka, and Nagoya, showcase premium installations where surface printed film systems integrate with comprehensive brand platforms and quality management systems to optimize product decoration and operational effectiveness.
Japanese packaging facilities prioritize system reliability and material standards in printing material development, creating demand for premium film systems with advanced features, including enhanced color control and integration with automated quality systems. The market benefits from established packaging infrastructure and willingness to invest in advanced material technologies that provide long-term operational benefits and compliance with food regulations.
Market Intelligence Brief:
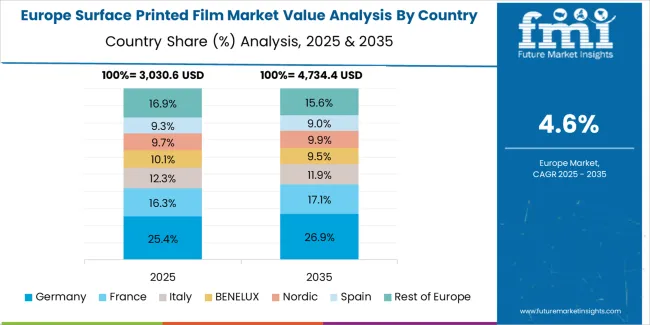
The surface printed film market in Europe is projected to grow from USD 3,782 million in 2025 to USD 6,147 million by 2035, registering a CAGR of 5.0% over the forecast period. Germany is expected to maintain its leadership position with a 31.8% market share in 2025, declining slightly to 31.4% by 2035, supported by its advanced packaging infrastructure and major food centers, including Bavaria and North Rhine-Westphalia.
The United Kingdom follows with a 24.1% share in 2025, projected to reach 24.5% by 2035, driven by comprehensive retail modernization and food packaging development initiatives. France holds a 19.6% share in 2025, expected to maintain 19.8% by 2035 through established consumer goods sectors and printing technology adoption. Italy commands a 14.2% share, while Spain accounts for 9.1% in 2025. The Rest of Europe region is anticipated to gain momentum, expanding its collective share from 1.2% to 1.8% by 2035, attributed to increasing packaging adoption in Nordic countries and emerging Eastern European consumer facilities implementing advanced brand programs.
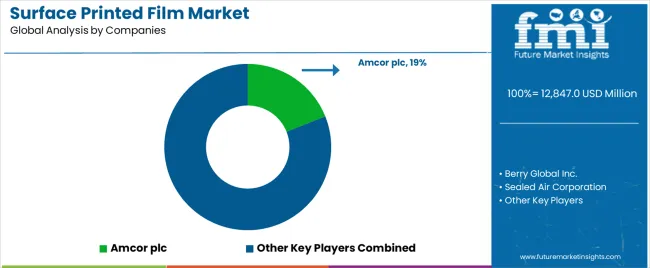
The surface printed film market features 10–15 players with moderate concentration, where the top three companies collectively hold around 45–50% of global market share, driven by their large-scale production capabilities, innovation in print technologies, and strong customer relationships across the food, beverage, personal care, and healthcare industries. The leading company, Amcor plc, commands 19% of the market share, supported by its extensive portfolio of flexible and surface printed film solutions, strong sustainability initiatives, and a global presence. Competition centers on print quality, durability, material performance, customization, and eco-friendly packaging solutions rather than price-based competition.
Market leaders such as Amcor plc, Berry Global Inc., and Sealed Air Corporation maintain their dominant positions by offering high-performance surface printed films that deliver excellent branding opportunities, barrier properties, and adaptability to diverse packaging formats. Their competitive strengths lie in their advanced printing technologies, material versatility, and ability to meet the increasing demand for sustainable and recyclable packaging solutions.
Challenger companies such as Constantia Flexibles Group, Mondi Group, and Huhtamaki Group focus on providing specialized surface printed films for niche markets, including premium food packaging, healthcare, and consumer goods. They emphasize high-quality printing, custom designs, and performance-driven features such as moisture, oxygen, and UV protection.
Additional competition arises from regional players like Coveris Holdings, Sonoco Products Company, Clondalkin Group, and Printpack Inc., which focus on localized production, responsive customer service, and cost-effective solutions tailored to regional demands.
| Item | Value |
|---|---|
| Quantitative Units | USD 12,847 million |
| Product Type | Polyethylene, Polypropylene, Polyester, Polyvinyl Chloride |
| Application | Food & Beverage Packaging, Pharmaceutical Packaging, Personal Care & Cosmetics, Industrial Packaging, Others |
| Regions Covered | North America, Europe, Asia Pacific, Latin America, Middle East & Africa |
| Countries Covered | USA, Germany, Japan, India, China, and 25+ additional countries |
| Key Companies Profiled |
Amcor plc, Berry Global Inc., Sealed Air Corporation, Constantia Flexibles Group, Mondi Group, Huhtamaki Group, Coveris Holdings, Sonoco Products Company, Clondalkin Group, Printpack Inc. |
| Additional Attributes | Dollar sales by product type and application categories, regional adoption trends across North America, Europe, and Asia-Pacific, competitive landscape with material manufacturers and packaging suppliers, brand preferences for reliability and visual performance, integration with quality management platforms and production systems, innovations in printing technology and decoration efficiency, and development of multi-layer solutions with enhanced barrier and visual capabilities |
The global surface printed film market is estimated to be valued at USD 12,847.0 million in 2025.
The market size for the surface printed film market is projected to reach USD 21,532.1 million by 2035.
The surface printed film market is expected to grow at a 5.3% CAGR between 2025 and 2035.
The key product types in surface printed film market are polyethylene, polypropylene, polyester and polyvinyl chloride.
In terms of application, food & beverage packaging segment to command 46.0% share in the surface printed film market in 2025.


Our Research Products

The "Full Research Suite" delivers actionable market intel, deep dives on markets or technologies, so clients act faster, cut risk, and unlock growth.

The Leaderboard benchmarks and ranks top vendors, classifying them as Established Leaders, Leading Challengers, or Disruptors & Challengers.

Locates where complements amplify value and substitutes erode it, forecasting net impact by horizon

We deliver granular, decision-grade intel: market sizing, 5-year forecasts, pricing, adoption, usage, revenue, and operational KPIs—plus competitor tracking, regulation, and value chains—across 60 countries broadly.

Spot the shifts before they hit your P&L. We track inflection points, adoption curves, pricing moves, and ecosystem plays to show where demand is heading, why it is changing, and what to do next across high-growth markets and disruptive tech

Real-time reads of user behavior. We track shifting priorities, perceptions of today’s and next-gen services, and provider experience, then pace how fast tech moves from trial to adoption, blending buyer, consumer, and channel inputs with social signals (#WhySwitch, #UX).

Partner with our analyst team to build a custom report designed around your business priorities. From analysing market trends to assessing competitors or crafting bespoke datasets, we tailor insights to your needs.
Supplier Intelligence
Discovery & Profiling
Capacity & Footprint
Performance & Risk
Compliance & Governance
Commercial Readiness
Who Supplies Whom
Scorecards & Shortlists
Playbooks & Docs
Category Intelligence
Definition & Scope
Demand & Use Cases
Cost Drivers
Market Structure
Supply Chain Map
Trade & Policy
Operating Norms
Deliverables
Buyer Intelligence
Account Basics
Spend & Scope
Procurement Model
Vendor Requirements
Terms & Policies
Entry Strategy
Pain Points & Triggers
Outputs
Pricing Analysis
Benchmarks
Trends
Should-Cost
Indexation
Landed Cost
Commercial Terms
Deliverables
Brand Analysis
Positioning & Value Prop
Share & Presence
Customer Evidence
Go-to-Market
Digital & Reputation
Compliance & Trust
KPIs & Gaps
Outputs
Full Research Suite comprises of:
Market outlook & trends analysis
Interviews & case studies
Strategic recommendations
Vendor profiles & capabilities analysis
5-year forecasts
8 regions and 60+ country-level data splits
Market segment data splits
12 months of continuous data updates
DELIVERED AS:
PDF EXCEL ONLINE
Competitive Overview of Surface Printed Film Companies
Printed Plastic Films Market Insights - Growth & Forecast 2025 to 2035
Surface Protection Film Market Forecast and Outlook 2025 to 2035
Thin Film and Printed Batteries Market Trends - Growth & Forecast 2025 to 2035
Decorative Surface Films Market
Film and TV IP Peripherals Market Size and Share Forecast Outlook 2025 to 2035
Surface Contact Wire Rope Market Size and Share Forecast Outlook 2025 to 2035
Surface Water Sports Equipment Market Size and Share Forecast Outlook 2025 to 2035
Film Wrapped Wire Market Size and Share Forecast Outlook 2025 to 2035
Surface Protection Service Market Size and Share Forecast Outlook 2025 to 2035
Film-Insulated Wire Market Size and Share Forecast Outlook 2025 to 2035
Film Forming Starches Market Size and Share Forecast Outlook 2025 to 2035
Printed Electronics Market Size and Share Forecast Outlook 2025 to 2035
Printed Labels Market Size and Share Forecast Outlook 2025 to 2035
Surface Treatment Chemicals Market Size and Share Forecast Outlook 2025 to 2035
Surface Mounting Distribution Panel Market Size and Share Forecast Outlook 2025 to 2035
Film Formers Market Size and Share Forecast Outlook 2025 to 2035
Printed Chipless RFID Radio Frequency Identification Market Size and Share Forecast Outlook 2025 to 2035
Printed Sensors Market Size and Share Forecast Outlook 2025 to 2035
Surface Mounted Medium Voltage Distribution Panel Market Size and Share Forecast Outlook 2025 to 2035

Thank you!
You will receive an email from our Business Development Manager. Please be sure to check your SPAM/JUNK folder too.
Chat With
MaRIA