The seismic protection device industry stands at the threshold of a decade-long expansion trajectory that promises to reshape structural engineering technology, resilience infrastructure solutions, and advanced building protection applications. The market's journey from USD 3.3 billion in 2025 to USD 4.8 billion by 2035 represents substantial growth, demonstrating the accelerating adoption of advanced damping configurations and isolation technology across infrastructure projects, building retrofits, critical facility protection, and specialty construction sectors.
The first half of the decade (2025-2030) will witness the market climbing from USD 3.3 billion to approximately USD 4 billion, adding USD 0.7 billion in value, which constitutes 47% of the total forecast growth period. This phase will be characterized by the rapid adoption of viscous damper systems, driven by increasing seismic code stringency requirements and the growing need for high-performance structural protection equipment worldwide. Advanced base isolation capabilities and integrated monitoring systems will become standard expectations rather than premium options.
The latter half (2030-2035) will witness sustained growth from USD 4 billion to USD 4.8 billion, representing an addition of USD 0.8 billion or 53% of the decade's expansion. This period will be defined by mass market penetration of specialized tuned mass damper systems, integration with comprehensive building management platforms, and seamless compatibility with existing structural infrastructure. The market trajectory signals fundamental shifts in how construction industries approach seismic resilience optimization and structural safety management, with participants positioned to benefit from sustained demand across multiple device types and application segments.
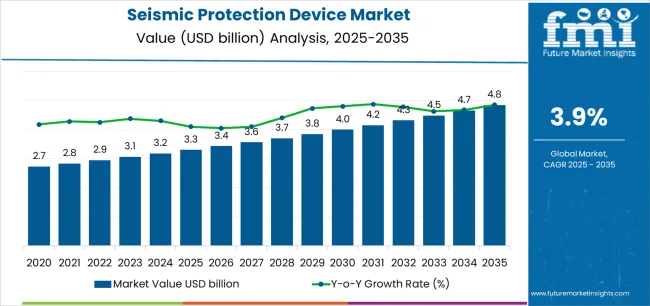
The Seismic Protection Device market demonstrates distinct growth phases with varying market characteristics and competitive dynamics. Between 2025 and 2030, the market progresses through its regulatory compliance adoption phase, expanding from USD 3.3 billion to USD 4 billion with steady annual increments averaging 3.9% growth. This period showcases the transition from conventional structural designs to advanced seismic protection systems with enhanced energy dissipation capabilities and integrated health monitoring systems becoming mainstream features.
The 2025-2030 phase adds USD 0.7 billion to market value, representing 47% of total decade expansion. Market maturation factors include standardization of base isolation and damping protocols, declining component costs for viscous damper systems, and increasing industry awareness of lifecycle protection benefits reaching 75-80% structural performance optimization in seismic applications. Competitive landscape evolution during this period features established device manufacturers like OILES CORPORATION and Taylor Devices expanding their damper technology portfolios while specialty manufacturers focus on advanced friction damper development and enhanced energy dissipation capabilities.
From 2030 to 2035, market dynamics shift toward advanced monitoring integration and global infrastructure resilience expansion, with growth continuing from USD 4 billion to USD 4.8 billion, adding USD 0.8 billion or 53% of total expansion. This phase transition centers on fully integrated structural health monitoring systems, integration with comprehensive facility management networks, and deployment across diverse building types and infrastructure scenarios, becoming standard rather than specialized applications. The competitive environment matures with focus shifting from basic seismic protection capability to comprehensive resilience optimization systems and integration with predictive performance platforms.
| Metric | Value |
|---|---|
| Market Value (2025) | USD 3.3 billion |
| Market Forecast (2035) | USD 4.8 billion |
| Growth Rate | 3.9% CAGR |
| Leading Technology | Dampers Product Type |
| Primary Application | Infrastructure Application Segment |
The market demonstrates strong fundamentals with damper systems capturing a dominant share through advanced energy dissipation and structural protection capabilities. Infrastructure applications drive primary demand, supported by increasing bridge retrofit requirements and critical facility seismic upgrades. Geographic expansion remains concentrated in high-seismicity regions with established building codes, while emerging economies show accelerating adoption rates driven by disaster risk mitigation and rising construction safety standards.
Market expansion rests on three fundamental shifts driving adoption across the construction, infrastructure, and public safety sectors. First, seismic code modernization demand creates compelling structural advantages through seismic protection devices that provide enhanced building resilience without complete reconstruction requirements, enabling facility owners to achieve code compliance while maintaining operational continuity and reducing earthquake damage costs. Second, infrastructure aging and retrofit acceleration as governments worldwide seek advanced protection systems that extend structural lifespan of existing buildings and bridges, enabling safety enhancement that aligns with disaster risk reduction policies and public safety standards.
Third, critical facility protection drives adoption from healthcare operators and government agencies requiring effective seismic isolation solutions that ensure operational continuity during earthquake events while maintaining facility functionality during emergency response operations and post-disaster recovery periods. However, growth faces headwinds from initial capital investment challenges that vary across building owners regarding the procurement of advanced base isolation systems and damping devices, which may limit adoption in budget-constrained construction environments. Installation complexity also persists regarding structural modification requirements and specialized engineering analysis that may reduce effectiveness in heritage buildings and space-constrained retrofit scenarios, which affect project feasibility and implementation timelines.
The seismic protection device market represents a specialized yet critical infrastructure opportunity driven by expanding global urbanization in seismic zones, aging infrastructure modernization, and the need for superior structural resilience in diverse building applications. As construction industries worldwide seek to achieve 75-80% seismic force reduction effectiveness, prevent structural damage by 60-80%, and integrate advanced monitoring systems with real-time performance tracking platforms, seismic protection devices are evolving from specialized engineering solutions to essential safety infrastructure ensuring building resilience and occupant protection.
The market's growth trajectory from USD 3.3 billion in 2025 to USD 4.8 billion by 2035 at a 3.9% CAGR reflects fundamental shifts in building code requirements and disaster risk reduction priorities. Geographic expansion opportunities are particularly pronounced in Asia Pacific markets, while the dominance of damper systems (63% market share) and infrastructure applications (36.3% share) provides clear strategic focus areas.
Strengthening the dominant damper segment (63% market share) through enhanced viscous damper configurations (34% damper share), superior energy dissipation capacity, and temperature-stable performance systems. This pathway focuses on optimizing fluid viscosity formulations, improving piston seal reliability, extending device effectiveness to extreme seismic events, and developing specialized dampers for diverse structural applications. Market leadership consolidation through advanced mechanical engineering and performance validation enables premium positioning while defending competitive advantages against alternative protection technologies. Expected revenue pool: USD 95-125 million
Rapid urbanization and infrastructure development growth across Asia Pacific seismic regions creates substantial expansion opportunities through local device manufacturing capabilities and technology transfer partnerships. Growing building code enforcement and government retrofit mandates drive sustained demand for comprehensive seismic protection systems. Regional manufacturing strategies reduce import costs, enable faster project support, and position companies advantageously for public infrastructure programs while accessing growing construction markets. Expected revenue pool: USD 82-108 million
Expansion within the dominant infrastructure segment (36.3% market share) through specialized devices addressing bridge bearing replacement standards (12.5% infrastructure share) and critical facility requirements. This pathway encompasses seismic isolation bearings, expansion joint dampers, and compatibility with diverse bridge and viaduct retrofits. Premium positioning reflects superior operational reliability and comprehensive safety compliance supporting modern transportation infrastructure and emergency facility protection. Expected revenue pool: USD 70-92 million
Strategic advancement in retrofit installation segment adoption (54% market share) requires specialized devices addressing existing building constraints and non-invasive installation techniques. This pathway addresses critical facility retrofits (18% retrofit share), public building upgrades, and historical structure protection with minimal structural intervention requirements. Premium pricing reflects engineering complexity and project management expertise while enabling seismic compliance without complete reconstruction. Expected revenue pool: USD 61-80 million
Development of specialized base isolation and damping systems for healthcare facilities (8.2% infrastructure share), addressing operational continuity requirements and life-safety protection demands. This pathway encompasses low-profile isolation systems, equipment vibration control, and continuous operation alternatives for mission-critical medical facilities. Technology differentiation through proprietary isolation platforms enables diversified revenue streams while reducing dependency on commercial building applications. Expected revenue pool: USD 52-68 million
Expansion targeting high-rise building occupant comfort (7% damper share) through specialized tuned mass damper configurations for wind-induced motion control. This pathway encompasses pendulum-based systems, auxiliary mass dampers, and hybrid control solutions for slender tower applications. Market development through performance-based design enables differentiated positioning while accessing growing urban high-rise markets requiring comfort optimization solutions. Expected revenue pool: USD 45-59 million
Development of comprehensive device monitoring systems addressing performance verification and maintenance optimization requirements across seismic protection installations. This pathway encompasses IoT sensor integration, real-time displacement tracking, and comprehensive structural health management platforms. Premium positioning reflects operational excellence and lifecycle performance optimization while enabling access to digitalization-focused facility operators and smart building partnerships. Expected revenue pool: USD 38-50 million
Primary Classification: The market segments by product type into Dampers and Base Isolators categories, representing the evolution from basic structural reinforcement to specialized energy dissipation solutions for comprehensive seismic protection optimization.
Secondary Classification: Application segmentation divides the market into Infrastructure, Buildings (residential and commercial), and Industrial facilities, reflecting distinct requirements for structural performance, protection levels, and seismic design standards.
Tertiary Classification: Installation segmentation covers Retrofit and New Construction, with retrofit applications leading adoption while new building integration shows accelerating growth patterns driven by stringent building code programs.
The segmentation structure reveals technology progression from conventional structural strengthening toward advanced energy dissipation and base isolation systems with enhanced monitoring and performance verification capabilities, while application diversity spans from critical hospital protection to bridge bearing replacement requiring advanced seismic engineering solutions.
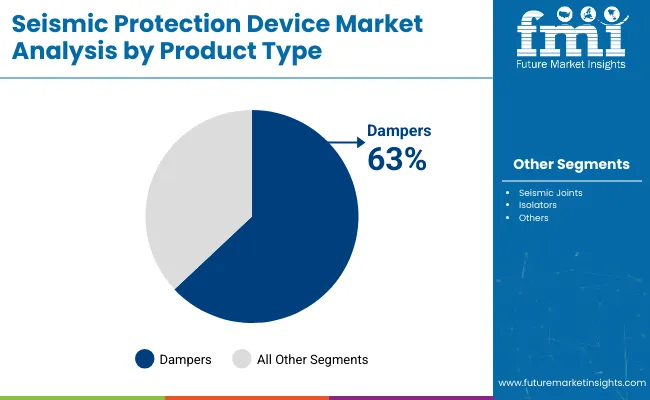
Market Position: Damper systems command the leading position in the Seismic Protection Device market with approximately 63% market share through advanced energy dissipation characteristics, including superior force reduction, velocity-dependent performance, and installation flexibility that enable structural engineers to achieve optimal seismic protection across diverse building and infrastructure configurations.
Value Drivers: The segment benefits from engineering community preference for versatile damping systems that provide reliable energy dissipation performance, reduced structural stress, and seismic force attenuation without requiring extensive foundation modifications. Advanced damper features enable adjustable damping coefficients, multi-directional protection, and integration with existing structural framing, where performance reliability and design flexibility represent critical engineering requirements.
Competitive Advantages: Damper systems differentiate through proven seismic testing validation, optimal force-displacement characteristics, and integration with standard structural steel connections that enhance implementation effectiveness while maintaining equipment costs suitable for diverse construction applications and project budgets.
Key market characteristics:
Base isolation systems maintain significant market presence through foundation-level seismic decoupling capabilities in critical facility applications requiring near-complete seismic force isolation and horizontal displacement accommodation for essential building protection.
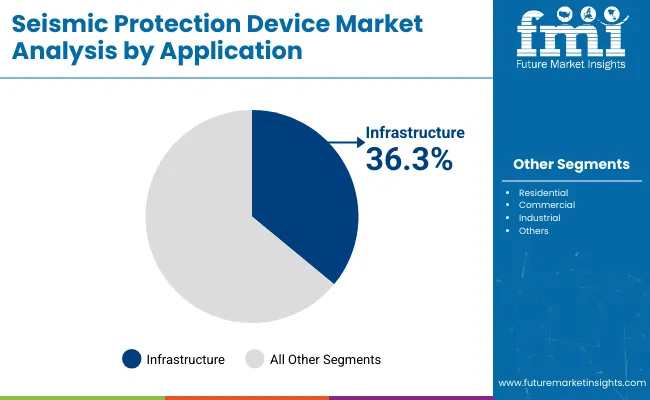
Market Context: Infrastructure applications dominate the Seismic Protection Device market with approximately 36.3% market share due to widespread adoption in bridge retrofit programs and increasing focus on transportation network resilience, emergency facility protection, and critical utility infrastructure applications that maximize structural safety while maintaining operational functionality standards.
Appeal Factors: Infrastructure owners prioritize structural reliability, long-term durability, and integration with existing bridge and facility designs that enable coordinated protection across multiple structural elements. The segment benefits from substantial government infrastructure investment and disaster resilience programs that emphasize the acquisition of proven seismic devices for bridge bearing replacement (12.5% infrastructure share), hospital seismic upgrades (8.2% share), and rail infrastructure protection (7.1% share).
Growth Drivers: Bridge retrofit programs incorporate specialized seismic bearings and dampers as essential components for transportation network resilience, while hospital seismic upgrade mandates increase demand for base isolation capabilities that comply with operational continuity standards and optimize patient safety during earthquake events.
Market Challenges: Complex coordination requirements and extended project timelines may limit retrofit implementation across aging infrastructure portfolios.
Application dynamics include:
Commercial and residential building applications maintain substantial demand through high-rise construction, office tower projects, and multi-family residential developments requiring seismic protection. Industrial facility applications capture significant portions through process plant protection, data center resilience, and manufacturing facility continuity requirements.
Growth Accelerators: Seismic building code stringency drives primary adoption as protection devices provide enhanced structural resilience that enables facility owners to meet modern seismic design standards without excessive construction costs, supporting life-safety compliance requirements and disaster risk reduction missions that demand advanced structural protection applications. Infrastructure aging and retrofit demand accelerates market expansion as governments seek cost-effective seismic upgrade solutions that extend bridge service life while maintaining traffic operations during phased retrofit implementation and structural improvement programs. Critical facility protection spending increases worldwide, creating sustained demand for specialized base isolation systems that complement hospital operational continuity requirements and provide structural protection enabling post-disaster facility functionality in emergency response scenarios.
Growth Inhibitors: Capital cost challenges vary across building owners regarding the procurement of base isolation systems and advanced damper technologies, which may limit project feasibility and market penetration in regions with constrained construction budgets or price-sensitive development environments. Engineering complexity persists regarding specialized structural analysis requirements, performance-based design procedures, and certification documentation that may reduce adoption effectiveness in markets lacking seismic engineering expertise, qualified installation contractors, or comprehensive technical support infrastructure, affecting implementation rates and project success. Market awareness limitations across building owner communities and design professional understanding create adoption barriers between different construction market segments and regional building practices.
Market Evolution Patterns: Adoption accelerates in high-seismicity regions and critical infrastructure projects where code compliance requirements justify advanced protection system costs, with geographic concentration in developed earthquake-prone markets transitioning toward mainstream adoption in emerging seismic zones driven by disaster experience and regulatory enforcement strengthening. Technology development focuses on enhanced monitoring capabilities, improved long-term reliability, and integration with structural health monitoring platforms that optimize device performance and maintenance planning. The market could face disruption if alternative structural systems or advanced construction materials significantly reduce the need for supplemental seismic protection devices in building applications, though the industry's fundamental requirement for energy dissipation and force isolation continues to make specialized seismic devices irreplaceable in critical infrastructure protection.
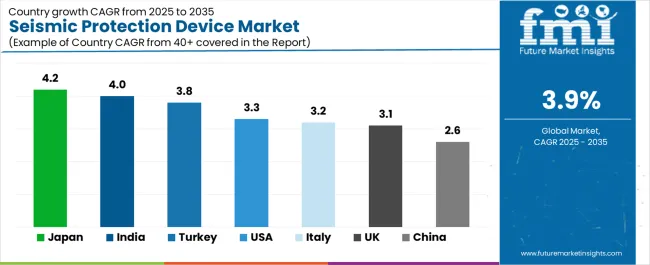
The seismic protection device market demonstrates varied regional dynamics with Growth Leaders including Japan (4.2% CAGR) and India (4% CAGR) driving expansion through mature seismic protection adoption and infrastructure retrofit programs. Strong Performers encompass Turkey (3.8% CAGR) and the United States (3.3% CAGR), benefiting from established engineering practices and post-disaster reconstruction investment. Steady Markets feature Italy (3.2% CAGR), the United Kingdom (3.1% CAGR), and China (2.6% CAGR), where retrofit incentive programs and new construction codes support consistent growth patterns.
| Country | CAGR (2025-2035) |
|---|---|
| Japan | 4.2% |
| India | 4% |
| Turkey | 3.8% |
| United States | 3.3% |
| Italy | 3.2% |
| United Kingdom | 3.1% |
| China | 2.6% |
Regional synthesis reveals Asia Pacific markets leading adoption through building code enforcement acceleration and public infrastructure retrofit programs, while North American countries maintain steady expansion supported by critical facility protection requirements and bridge modernization initiatives. European markets show moderate growth driven by national seismic bonus programs and infrastructure resilience trends.
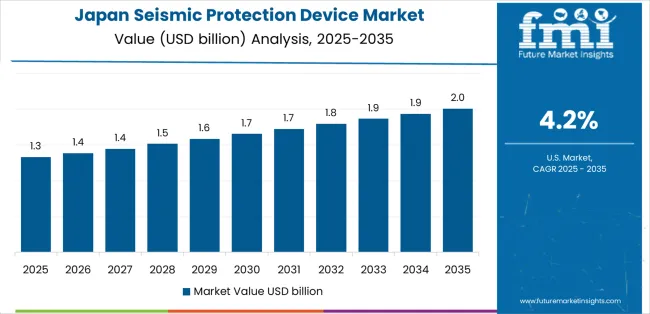
Japan leads growth momentum with a 4.2% CAGR, driven by high seismicity environment, mature adoption of base isolation and dampers across high-rise buildings and hospitals, and continuous public programs for school and bridge retrofits across major metropolitan regions including Tokyo, Osaka, Nagoya, and Fukuoka. Domestic seismic protection industry maturity and established regulatory frameworks drive primary device demand, while growing earthquake preparedness awareness supports comprehensive retrofit programs. Government disaster mitigation investment through national resilience initiatives, school seismic upgrade mandates, and critical infrastructure protection programs support sustained expansion.
The convergence of advanced seismic engineering expertise, strong domestic OEM manufacturing capacity accelerating deployment, and stringent building code enforcement following major earthquake experiences positions Japan as the leading technology market for seismic protection devices. High-rise building construction in urban centers and hospital seismic isolation retrofits accelerate device procurement, while bridge bearing replacement programs on major transportation corridors create sustained infrastructure demand.
Performance Metrics:
India demonstrates strong expansion at 4% CAGR through building code upgrades, urban metro and airport infrastructure programs, and high stock of pre-code buildings driving retrofit demand across major seismic zones including Delhi NCR, Gujarat, Himachal Pradesh, and northeastern states. Metro rail construction projects and airport terminal expansion drive primary seismic device adoption, while growing awareness of earthquake risk in urban areas supports building retrofit initiatives. Government disaster-risk financing supporting state infrastructure projects through World Bank programs, smart city development schemes, and critical facility upgrade initiatives support sustained device procurement.
The market benefits from metro construction including Delhi Metro expansion, Mumbai Metro development, and regional metro projects requiring comprehensive seismic protection for elevated viaducts and underground stations. Hospital and school retrofit programs funded by state disaster management authorities create additional demand for cost-effective seismic upgrade solutions.
Market Intelligence Brief:
Turkey maintains strong growth at 3.8% CAGR through post-earthquake reconstruction programs, hospital safety mandates, and bridge retrofits on trans-Anatolian transportation corridors following recent seismic events. Government emergency response and reconstruction initiatives drive substantial device demand for public building retrofits and critical infrastructure protection. Hospital seismic upgrade programs mandated following earthquake damage assessments require comprehensive base isolation and damping systems for operational continuity assurance.
Bridge retrofit programs on major highway corridors including trans-Anatolian routes and seismic zone crossings drive specialized bearing and damper procurement. Strong local contractor ecosystem and growing engineering expertise support rapid implementation of seismic protection projects across reconstruction zones.
Performance Metrics:
The USA market emphasizes advanced seismic protection features, including comprehensive performance testing and integration with building management platforms that manage structural health monitoring, maintenance scheduling, and performance verification through unified facility systems. The country demonstrates steady growth at 3.3% CAGR driven by IBC and ASCE code stringency, hospital and data-center resilience requirements, and West Coast retrofit cycles supporting infrastructure modernization. American structural engineers prioritize validated performance with seismic devices delivering reliable protection through advanced testing protocols and comprehensive quality assurance procedures. Device deployment channels include specialty seismic contractors, structural engineering firms, and building owners that support professional installations for complex hospital retrofits and bridge protection applications.
West Coast seismic retrofit programs in California, Oregon, and Washington drive sustained device demand for bridge bearing replacement and building upgrades. Data center seismic protection requirements and tall building tuned mass damper installations create additional market opportunities for specialized damping systems.
Strategic Development Indicators:
Italy maintains moderate growth at 3.2% CAGR through national seismic-bonus incentive programs, viaduct bearing replacement initiatives, and school upgrade projects across seismic regions including Apennine mountain zones, southern Italy, and northeastern areas. Government seismic retrofit subsidies through Sismabonus tax incentive programs drive residential and public building upgrades, while infrastructure safety programs address aging bridge and viaduct protection requirements. Heritage-friendly isolation solutions enable seismic protection of historical buildings without compromising architectural integrity.
Viaduct bearing replacement programs on major highway networks including Autostrada infrastructure address structural safety concerns following bridge collapse incidents. School seismic upgrade initiatives funded by regional authorities create sustained demand for public facility protection systems.
Market Characteristics:
The UK market emphasizes seismic protection in critical infrastructure including transport networks and healthcare facilities, with growing adoption of performance-based design approaches at 3.1% CAGR. Critical infrastructure resilience programs for rail networks, healthcare facilities, and emergency services drive device demand despite moderate seismicity levels. Performance-based design adoption in new campus developments, laboratory facilities, and research institutions incorporates seismic protection for equipment vibration control and structural performance optimization.
Tall building construction in London and major cities drives tuned mass damper installations for occupant comfort addressing wind-induced motion. Healthcare facility seismic protection programs address operational continuity requirements for NHS hospitals and private medical centers.
Performance Metrics:
China demonstrates moderate growth at 2.6% CAGR through steady new-build demand in western seismic belts, code enforcement expansion to tier-2 and tier-3 cities, and domestic isolator production scale advantages. Seismic building code implementation in Sichuan, Yunnan, Xinjiang, and other western provinces drives new construction device adoption, while urban development in seismically active regions requires comprehensive structural protection. Domestic manufacturing capacity expansion by Chinese isolator producers enables competitive pricing and rapid project deployment.
New construction in seismic zones including hospitals, schools, and government buildings incorporates base isolation and damping systems meeting national building code requirements. Bridge construction on transportation corridors through mountainous seismic regions requires specialized bearing and expansion joint systems.
Market Intelligence Brief:
Australia exhibits targeted growth at 3.1% CAGR through critical infrastructure development in moderate seismicity regions, performance-based design adoption in major urban centers, and specialized mining facility protection requirements. Building code evolution in Perth, Adelaide, and Melbourne drives selective seismic device implementation, while mining infrastructure in Western Australia and South Australia requires comprehensive structural protection systems. Local engineering expertise development enables advanced seismic design solutions and project-specific system optimization.
Critical facility construction including hospitals, data centers, and emergency response facilities incorporates base isolation and damping systems exceeding minimum code requirements for operational continuity. High-rise construction in Sydney, Melbourne, and Perth implements tuned mass dampers and supplemental damping systems for wind and seismic performance optimization.
Market Intelligence Brief:
Chile maintains robust growth at 4.2% CAGR through comprehensive building code enforcement, established seismic engineering practices, and continuous infrastructure resilience improvement programs. Stringent seismic design requirements following major earthquake experiences drive routine base isolation and damping system adoption across Santiago and coastal urban centers. Advanced engineering capabilities and established supply chains enable cost-effective seismic protection implementation.
New construction projects including residential high-rises, commercial buildings, and industrial facilities incorporate comprehensive seismic protection systems meeting world-class design standards. Bridge construction and retrofit programs throughout the country require specialized bearing systems and energy dissipation devices for infrastructure network resilience.
Market Intelligence Brief:
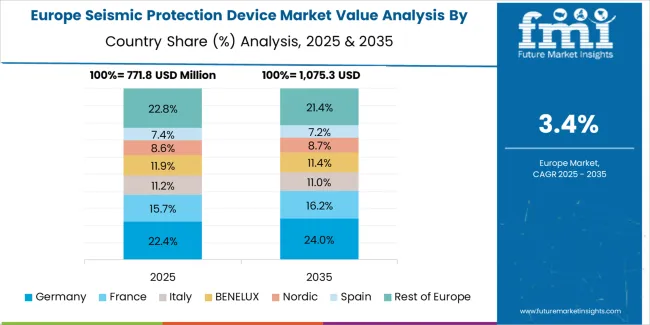
Europe accounted for 29% of the global seismic protection device revenue in 2025 (USD 1 billion) and is projected to reach 30% share by 2035 (USD 1.4 billion), registering a CAGR of approximately 3.7% over the forecast period. Within Europe's regional distribution in 2025, Germany holds approximately 19% of European market share, supported by chemical processing facility upgrades and infrastructure modernization programs across major industrial regions.
The United Kingdom follows with approximately 18.5% share, driven by critical infrastructure resilience programs for transport and healthcare facilities, and tall building comfort damping installations in major urban centers. Italy commands approximately 16.5% share through national Sismabonus seismic retrofit incentive programs, viaduct bearing replacements on Autostrada networks, and heritage-friendly isolation solutions for historical buildings. France accounts for approximately 15.5% share, aided by public building retrofit initiatives and nuclear facility protection programs. Spain holds approximately 9.5% share with moderate seismic zone construction and infrastructure modernization projects. The Nordic region represents approximately 7% share through selective critical facility protection and performance-based design applications. Rest of Europe collectively accounts for approximately 14% share, reflecting contributions from Eastern European seismic zones, Balkan region reconstruction programs, and emerging building code enforcement.
Growth is anchored by bridge bearing replacement programs addressing aging infrastructure across major transportation networks, hospital and school retrofits incentivized by national subsidy programs, and increased adoption of tuned mass dampers for occupant comfort in tall building construction. Environmental product declarations and CE/UKCA conformity requirements continue to shape procurement practices, favoring suppliers with proven lifecycle performance and structural health monitoring capabilities.
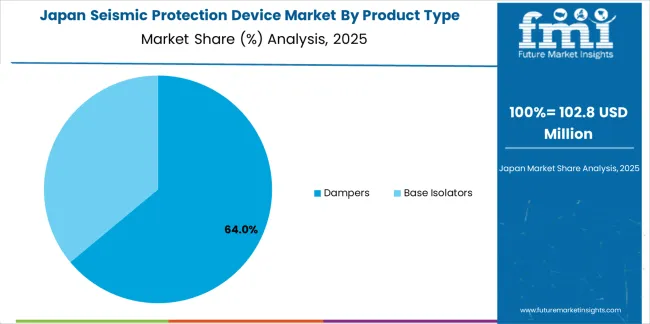
Japan demonstrates specialized market characteristics focused on comprehensive seismic protection integration and advanced device technology preferences that emphasize proven performance, long-term reliability, and extensive testing validation. The Japanese market focuses on mature base isolation adoption across high-rise buildings, established damper technology deployment in hospital facilities, and continuous public infrastructure retrofit programs requiring premium device specifications that reflect the country's world-leading seismic engineering standards. Seismic protection device procurement emphasizes technological sophistication, integration with comprehensive structural health monitoring systems, and multi-decade reliability requirements that align with Japanese construction quality expectations. The market benefits from domestic device manufacturers including OILES CORPORATION, THK Co., and Kawakin Core-Tech maintaining strong technology development capabilities and expanding production capacity to support domestic retrofit programs and export demand.
Market Development Factors:
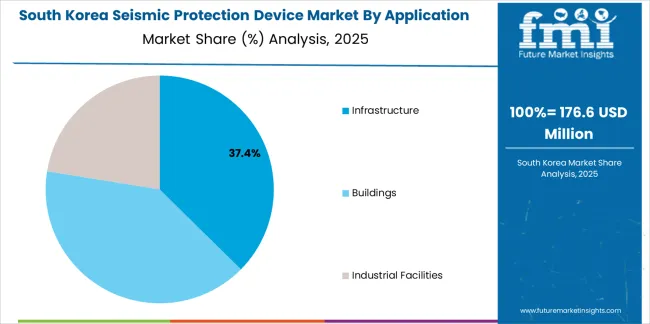
South Korea demonstrates advanced market characteristics focused on semiconductor fabrication facility vibration control, precision manufacturing equipment protection, and critical infrastructure seismic resilience with sophisticated monitoring systems and comprehensive performance features. The Korean market emphasizes high-technology facility protection, data center seismic isolation, and smart building integration requiring high-specification seismic devices with advanced control capabilities and real-time performance monitoring features. Korean construction companies and facility operators prioritize technology integration, predictive maintenance programs, and digital transformation initiatives that reflect the country's leadership in smart infrastructure systems. The market benefits from government support for critical infrastructure resilience, industrial facility safety programs, and technology development initiatives supporting advanced seismic protection deployment.
Strategic Development Indicators:
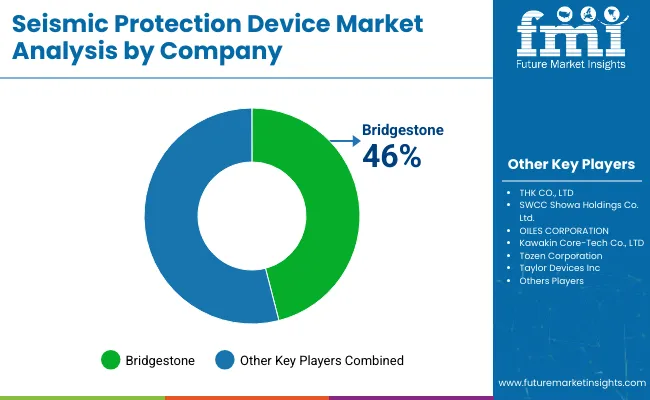
The Seismic Protection Device market operates with moderate concentration, featuring approximately 30-40 meaningful participants, where leading companies control roughly 30-35% of global market share through established engineering relationships and proven device performance. Competition emphasizes technical validation, installation expertise, and long-term reliability rather than price-based rivalry. Tier 1 companies including OILES CORPORATION, Taylor Devices, and Kawakin Core-Tech collectively command approximately 18-22% market share through comprehensive seismic protection device portfolios and extensive global project presence.
Market Leaders encompass OILES CORPORATION, Taylor Devices, and Kawakin Core-Tech, which maintain competitive advantages through extensive seismic engineering expertise, proven device performance records, and comprehensive technical support capabilities that create engineering community preference and support premium positioning. OILES CORPORATION alone holds approximately 9.5% market share through its lead-rubber and high-damping rubber bearing technology leadership and Japanese infrastructure relationships. The company announced capacity expansion for bearing production in Japan during 2025 to support domestic public-works retrofits and export demand.
Technology Innovators include THK Co., Bridgestone, and Mageba, which compete through specialized device development and innovative damping technologies appealing to structural engineers seeking advanced performance characteristics. Regional Specialists feature companies with specific geographic presence including MAURER SE and Freyssinet in Europe, and Earthquake Protection Systems (EPS) in North America focusing on critical facility applications. Recent developments include MAURER SE introducing upgraded bridge seismic devices and spherical bearings with enhanced low-friction sliding systems to improve retrofit program performance across Europe in 2024, and EPS delivering triple-pendulum base isolators for new USA hospital and courthouse projects expanding installed base in essential facilities during 2024.
| Item | Value |
|---|---|
| Quantitative Units | USD 3.3 billion |
| Product Type | Dampers (Viscous, Friction, Tuned Mass, Other Types), Base Isolators |
| Application | Infrastructure (Bridges & Viaducts, Hospitals & Emergency Facilities, Rail & Tunnels, Utilities, Airports & Ports), Buildings, Industrial Facilities |
| Installation | Retrofit (Critical Facilities, Public Buildings, Transport Structures, Industrial & Commercial), New Construction |
| Regions Covered | Asia Pacific, North America, Europe, Middle East & Africa, Latin America |
| Countries Covered | Japan, India, United States, Turkey, Italy, United Kingdom, China, Germany, France, Spain, and 25+ additional countries |
| Key Companies Profiled | OILES CORPORATION, Taylor Devices Inc., Kawakin Core-Tech Co., Ltd., THK Co., Ltd., Bridgestone, Mageba, MAURER SE, Freyssinet, Earthquake Protection Systems (EPS), FIP Industriale SpA |
| Additional Attributes | Dollar sales by product type, application, and installation categories, regional adoption trends across Asia Pacific, North America, and Europe, competitive landscape with device manufacturers and seismic engineering specialists, structural engineer preferences for performance reliability and testing validation, integration with structural health monitoring platforms and building management systems, innovations in damping technologies and base isolation configurations, and development of monitoring solutions with enhanced lifecycle performance and maintenance optimization capabilities. |
The global seismic protection device market is estimated to be valued at USD 3.3 billion in 2025.
The market size for the seismic protection device market is projected to reach USD 4.8 billion by 2035.
The seismic protection device market is expected to grow at a 3.9% CAGR between 2025 and 2035.
The key product types in seismic protection device market are dampers and base isolators.
In terms of application, infrastructure segment to command 36.3% share in the seismic protection device market in 2025.


Our Research Products

The "Full Research Suite" delivers actionable market intel, deep dives on markets or technologies, so clients act faster, cut risk, and unlock growth.

The Leaderboard benchmarks and ranks top vendors, classifying them as Established Leaders, Leading Challengers, or Disruptors & Challengers.

Locates where complements amplify value and substitutes erode it, forecasting net impact by horizon

We deliver granular, decision-grade intel: market sizing, 5-year forecasts, pricing, adoption, usage, revenue, and operational KPIs—plus competitor tracking, regulation, and value chains—across 60 countries broadly.

Spot the shifts before they hit your P&L. We track inflection points, adoption curves, pricing moves, and ecosystem plays to show where demand is heading, why it is changing, and what to do next across high-growth markets and disruptive tech

Real-time reads of user behavior. We track shifting priorities, perceptions of today’s and next-gen services, and provider experience, then pace how fast tech moves from trial to adoption, blending buyer, consumer, and channel inputs with social signals (#WhySwitch, #UX).

Partner with our analyst team to build a custom report designed around your business priorities. From analysing market trends to assessing competitors or crafting bespoke datasets, we tailor insights to your needs.
Supplier Intelligence
Discovery & Profiling
Capacity & Footprint
Performance & Risk
Compliance & Governance
Commercial Readiness
Who Supplies Whom
Scorecards & Shortlists
Playbooks & Docs
Category Intelligence
Definition & Scope
Demand & Use Cases
Cost Drivers
Market Structure
Supply Chain Map
Trade & Policy
Operating Norms
Deliverables
Buyer Intelligence
Account Basics
Spend & Scope
Procurement Model
Vendor Requirements
Terms & Policies
Entry Strategy
Pain Points & Triggers
Outputs
Pricing Analysis
Benchmarks
Trends
Should-Cost
Indexation
Landed Cost
Commercial Terms
Deliverables
Brand Analysis
Positioning & Value Prop
Share & Presence
Customer Evidence
Go-to-Market
Digital & Reputation
Compliance & Trust
KPIs & Gaps
Outputs
Full Research Suite comprises of:
Market outlook & trends analysis
Interviews & case studies
Strategic recommendations
Vendor profiles & capabilities analysis
5-year forecasts
8 regions and 60+ country-level data splits
Market segment data splits
12 months of continuous data updates
DELIVERED AS:
PDF EXCEL ONLINE
Seismic Survey Market Size and Share Forecast Outlook 2025 to 2035
Seismic Services Market Size and Share Forecast Outlook 2025 to 2035
Seismic Reinforcement Material Market Size and Share Forecast Outlook 2025 to 2035
Seismic Sensors Market Size and Share Forecast Outlook 2025 to 2035
Seismic Monitoring Equipment Market Size and Share Forecast Outlook 2025 to 2035
Seismic Survey Equipment Market Size and Share Forecast Outlook 2025 to 2035
Flu Protection Kits Market Size and Share Forecast Outlook 2025 to 2035
Eye Protection Equipment Market Size and Share Forecast Outlook 2025 to 2035
Teleprotection Market Growth – Trends & Forecast 2025 to 2035
ESD Protection Devices Market Insights – Trends & Demand 2023-2033
Head Protection Equipment Market Forecast Outlook 2025 to 2035
Fire Protection Materials Market Size and Share Forecast Outlook 2025 to 2035
Fall Protection Market Size and Share Forecast Outlook 2025 to 2035
CBRN Protection Equipment Market Size and Share Forecast Outlook 2025 to 2035
Fire Protection System Pipes Market Size and Share Forecast Outlook 2025 to 2035
DDoS Protection Market Size and Share Forecast Outlook 2025 to 2035
Fire Protection Systems for Industrial Cooking Market Growth - Trends & Forecast 2025 to 2035
DDoS Protection & Mitigation Security Market Growth - Trends & Forecast through 2034
Data Protection as a Service (DPaaS) Market
Brand Protection Tools Market Analysis - Size, Share, and Forecast 2025 to 2035

Thank you!
You will receive an email from our Business Development Manager. Please be sure to check your SPAM/JUNK folder too.
Chat With
MaRIA