Reports

- Global Locations -

Headquarters

Future Market Insights, Inc.

Christiana Corporate, 200
Continental Drive, Suite 401,
Newark, Delaware - 19713,
United States

T: +1-845-579-5705

Americas

Future Market Insights, Inc.

616 Corporate Way, Suite 2-9018,
Valley Cottage, NY 10989, United States

T: +1-347-918-3531

MEA

Future Market Insights

1602-6 Jumeirah Bay X2 Tower, Plot No: JLT-PH2-X2A,
Jumeirah Lakes Towers, Dubai,
United Arab Emirates

Europe

Future Market Insights

3rd Floor, 207 Regent Street,
W1B 3HH London
United Kingdom

T: + 44 (0) 20 8123 9659
D: +44 (0) 20 3287 4268

Asia Pacific

Future Market Insights

IndiaLand Global Tech Park, Unit UG-1, Behind Grand HighStreet, Phase 1, Hinjawadi, MH, Pune – 411057, India

Seismic Survey Equipment Market Overview (2022 to 2032)

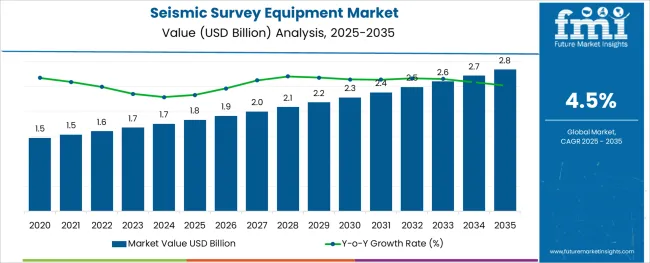
[250 Pages Report] Newly-released Seismic Survey Equipment Market analysis report by Future Market Insights reveals that global sales of the Seismic Survey Equipment Market in 2022 are estimated at US$ 1.6 Billion. With 3.8% projected growth from 2022 to 2032, the market is expected to reach a valuation of US$ 2.2 Billion by the end of the forecast period. Hardware being the top revenue generator of the Seismic Survey Equipment Market is projected to grow at a CAGR of over 3.9% from 2022 to 2032.

Attributes Details
Global Seismic Survey Equipment Market Size (2022) US$ 1.6 Billion
Global Seismic Survey Equipment Market Size (2032) US$ 2.2 Billion
Global Seismic Survey Equipment Market CAGR (2022 to 2032) 3.8%
USA Seismic Survey Equipment Market CAGR (2022 to 2032) 4.5%
Key Companies Covered
  • CCG
  • Geospace Technologies
  • Ion Geophysical
  • Mitcham
  • Wireless Seismic, Inc
  • Petroleum Geo-Services
  • Compagnie Generale de Geophysique
  • Polarcus Limited
  • Norwegian Petroleum Exploration Consultants

Don't pay for what you don't need

Customize your report by selecting specific countries or regions and save 30%!

Revenue of Seismic Survey Equipment Market from 2018 to 2021 Compared to Demand Outlook for 2022 to 2032

As per the Global Seismic Survey Equipment Market research by Future Market Insights - a market research and competitive intelligence provider, historically, from 2018 to 2021, the value of the Seismic Survey Equipment Market increased at around 4.3% CAGR. With an absolute dollar opportunity of US$ 702 Million, the market is projected to reach a valuation of US$ 2.3 Billion by 2032.

The key revenue drivers which affect the Seismic Survey Equipment demand include growing investment in risk management and the need for modern land survey equipment.

It is projected that the advantages of using electronic tools when conducting land surveys will expand the market. One of the most efficient methods for investigating rocks and subsoil is seismic surveying. It is well-suited for looking for underground mineral deposits, oil, and water. Subsoil depth, site study, geotechnical features, groundwater exploration, and hydrocarbon and coal exploration are typical uses for seismic studies. With the technical advanced, the market will soon have the opportunity to create terrestrial laser scanners with land survey equipment.

The demand for global seismic survey equipment is being driven by its usage in hydraulic fracturing for environmental research. The fracking fluid contains chemicals, and the flow back water is contaminated. The need for seismic exploration equipment is predicted to rise as a result of the necessity to measure dangers in gas exploration.

One of the biggest risks associated with hydraulic fracturing is earthquakes, Seismic surveys produce a CAT scan of the Earth's subsurface using reflected sound waves. This investigation is carried out to find groundwater, look for landfills, and assess how the region will tremble in the event of an earthquake. Monitoring of induced seismicity is crucial during hydraulic fracturing, and the operator should maintain a proper log. Injecting backwater into deep wells necessitates monitoring as well. The market for seismic survey equipment is driven by the two main concerns for induced seismicity.

The market growth for seismic survey equipment is also rising as a result of rising urbanization and industrialization activities accelerating. The urban population will account for 56.15% of the total population by the end of 2020, according to World Bank statistics. Additionally, the requirement for oil and gas firms to boost their production volume is growing due to the rising global demand for energy, particularly for oil and gas. In order to meet the anticipated demand for seismic exploration services, these companies are concentrating on discovering new reserves.

What Factors Are Propelling Seismic Survey Equipment Demand?

The key factors which are propelling Seismic Survey Equipment sales are an increase in demand from the oil and gas sector and marine surveys. Throughout the projection period, it is anticipated that the oil and gas industry will continue to dominate the market. The recent slump in the oil and gas industry has had a significant effect on the market for geophysical equipment and services. After mid-2016, the oil and gas market began to revive, and it really took off in 2017. The price of oil was US$ 75 per barrel in 2018. To fulfill the rising demand for oil and gas on a worldwide scale, investors are anticipated to invest in the exploration of unconventional deposits.

In 2018, the world consumed 4662.1 and 3309.4 Million tonnes of oil equivalent as fuel according to the report of British Petroleum. In a carbon-constrained environment, it is anticipated that demand for lithium-ion batteries, and solar and wind energy storage systems will increase. This factor is also anticipated to fuel a significant increase in demand for a broad range of minerals and metals. The necessity to discover new hydrocarbon sources is crucial and valuable due to the oil and gas resource’s constant depletion.

The instrumentation for land-based or maritime surveys typically consists of a towed transmitter, several geophones, and a variety of tools like water cannons, air guns, sparklers, boomers, and chirping devices.

As a result, it is anticipated that the need for geophysical services in the oil and gas sector would rise. Seismic technology is anticipated to be extensively utilized in the mining and oil and gas sectors. As a result, it is anticipated that during the forecast period, there will be an increase in demand for geophysical equipment and services.

Sudip Saha
Sudip Saha

Principal Consultant

Talk to Analyst

Find your sweet spots for generating winning opportunities in this market.

Which Factors are restraining the growth of the Seismic Survey Equipment Market?

The factors restraining the growth of the Seismic Survey Equipment Market include that several local businesses provide rental and leasing options for ground equipment, forcing direct end users to buy their own tools. As some end users only require the equipment for a brief time, leasing and renting land surveying equipment is an economical choice that also saves on maintenance costs. The market for surveying equipment is further constrained by a lack of experienced labor and technical expertise needed to run the machinery and its software. Oil & Gas businesses have decreased their investments globally as a result of factors like the downturn in oil prices, which is also impacting the market expansion.

Which Region is projected to offer the Largest Seismic Survey Equipment Market Opportunity?

During the projection period, the market in the Asia Pacific is expected to be the largest for Seismic Survey Equipment. The Asia Pacific is anticipated to experience the fastest growth. This development is linked to China's expanding usage of small unmanned aerial vehicles (UAVs) for oil and gas exploration, mining inspection, and construction assessment. The market for seismic survey equipment is also being driven by rising government investments in smart city initiatives. Besides, the market is also being propelled as a result of the growing use of 3D laser scanners in India.

After the Asia Pacific, North America is expected to be the highest revenue-generating region. Investments in exploration efforts are the key factors for this.

The number of geophysical surveys being conducted in the USA is rising, which is helping to expand the market in this country. The amount of oil produced in Mexico has decreased. To solve this, the government launched energy reforms in 2014 to eliminate PEMEX, the state oil and gas company 75 - years monopoly. Over the past few years, the Mexican government has made a number of blocks available for exploration. After numerous bids for blocks, 70 oil and gas operators entered the nation as a result of the mining sector's deregulation. Due to this, there is now greater demand for geophysical equipment to carry out various tasks. Therefore, during the projected period, these factors are anticipated to present lucrative avenues for the expansion of the geophysical equipment and services market.
Get the data you need at a Fraction of the cost

Personalize your report by choosing insights you need
and save 40%!

Country-wise Analysis

Which Country Lies at the Center stage for Seismic Survey Equipment Market Revenue?

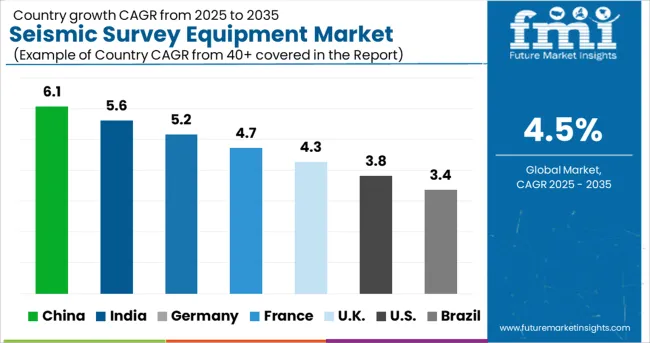
The USA is expected to account for the highest market of US$ 393.8 Million by the end of 2032. It is expected to be projected to have an absolute dollar growth of US$ 141.4 Million. The country’s large market is also being supported by the presence of multinational companies in the country such as Geostuff, Baker Hughes, Throop Rock Bit, Geospace Technologies, Ion Geophysical, and Wireless Seismic, Inc.

Category-wise Insights

Why Hardware usage as a component of the Seismic Survey Equipment Market is projected to Witness the Fastest Growth?

The highest used component in Seismic Survey Equipment Market globally is hardware. Demand growth for Hardware as a Component for Seismic Survey Equipment was recorded at 4.3% from 2018 to 2021, while it is expected to grow at a CAGR of 3.8% from 2022 to 2023. Due to advancing equipment technology and an increase in global oil and gas exploration activity, the hardware sector held the largest market share.

Equipment for seismic surveys includes different seismic sources, such as:

  • Vibroseis are portable and provide rapid and effective illumination of subsurface targets from a variety of shot point positions. Additionally, a vibrator signal's frequency content can frequently be changed to better satisfy the target's resolution needs. Besides, by adjusting the size, number, or output drive of individual vibrators, the amplitude of the energy input into the Earth can be adjusted for the best signal-to-noise ratio.
  • Air guns are the key energy sources employed in offshore seismic profiling. Chemical explosives are no longer employed due to safety concerns and the harm they do to marine life. Modern seismic vessels pull numerous air gun arrays, sometimes with ten or more air guns in each array.
  • Seismic detectors, such as hydrophones and geophones.

Which Technology of Seismic Survey Equipment Market is expected to be Most Lucrative?

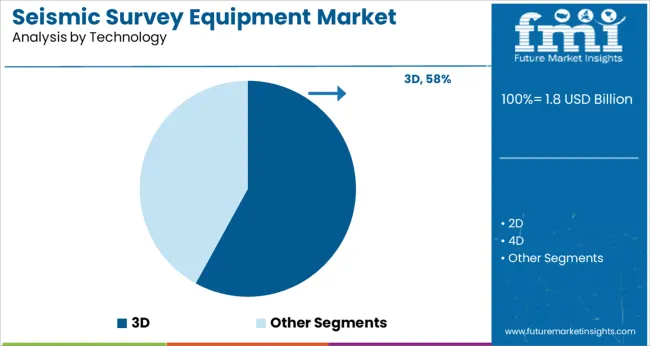
3D Technology is the most widely utilized technology of Seismic Survey Equipment. Demand growth for 3D technology was recorded at 4.4% from 2018 to 2021, while it is expected to grow at a CAGR of 4% from 2022 to 2023. As oil and gas businesses employ 3D seismic technology to resolve issues and minimize uncertainties in exploration, development, and production operations, demand for this technology has grown. Additionally, the method is used to obtain more precise photographs of geological features. Additionally, it speeds up the process of gathering, analyzing, and interpreting data. Companies can invest in new oil and gas deposits as 3D imaging gives a clear representation of the earth's surface.
Competitive Analysis

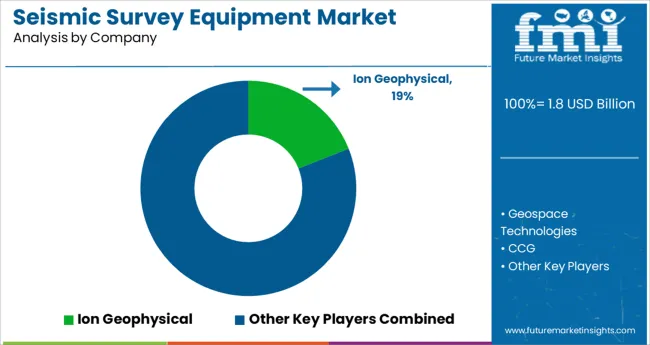
Players in the market are constantly developing improved analytical solutions as well as extending their product offerings. The companies in the Seismic Survey Equipment market are focused on their alliances, technology collaborations, and product launch strategies. The Tier 2 Players in the market are targeting to increase their Seismic Survey Equipment market share.

Some of the recent developments in the Seismic Survey Equipment market are:

  • In July 2022, Geospace Technologies Corporation announced a long-term rental deal with SAExploration, a key supplier of maritime geophysical services. The OBX-750E seabed ocean bottom wireless seismic data collection nodes will be rented by SAExploration. Based on the terms of the existing contract, the value of the agreement is estimated to be US$ 12 Million.
  • In February 2022, in the Asia-Pacific region, an Ocean Bed Nodes (OBN) resource contract with an anticipated length of around 5 months had approved, according to a statement from SeaBird Exploration. The company intends to use the Voyager Explorer on the contract, which would prolong the charter of the unmanned vessel, and the contract is scheduled to begin in April 2020.
  • In September 2020, Trimble unveiled the new and improved R12i GNSS receiver, which will enable users to complete tasks more quickly and precisely.

Seismic Survey Equipment Market Segmentation

By Component:

  • Hardware
  • Software
  • Services

By Technology:

  • 2D
  • 3D
  • 4D

By Location:

  • Onshore
  • Offshore

By Industry:

  • Oil & Gas
  • Others

By Region:

  • North America
  • Latin America
  • Europe
  • Asia-Pacific (APAC)
  • Middle East and Africa (MEA)

Frequently Asked Questions

What is the current worth of the Seismic Survey Equipment Market?

The global Seismic Survey Equipment Market is worth more than US$ 1.6 Billion at present.

What is the sales forecast for Seismic Survey Equipment Market?

The value of the Seismic Survey Equipment Market is projected to increase at a CAGR of around 3.8% from 2022 to 2032.

What was the last 5 year’s market CAGR?

The value of Seismic Survey Equipment Market increased at a CAGR of around 4.3% from 2018 to 2021.

What are the key Seismic Survey Equipment Market Trends?

The global demand for Seismic Survey Equipment is being fueled by a considerable increase in growing investment and awareness about risk management.

At what percentage is sales of the Seismic Survey Equipment Market expected to register growth in China?

The growth of the market for Seismic Survey Equipment in China is projected to expand at a CAGR of around 4.3% from 2022 to 2032.

At what percentage is sales of Seismic Survey Equipment Market going to register growth in the United States?

The growth of the market for Seismic Survey Equipment in the United States is projected to expand at a CAGR of around 4.5% from 2022 to 2032.

What do statistics for India and Indonesia reveal?

While the market in India is expected to grow at nearly 3.8%, the market in Indonesia is projected to register a CAGR of nearly 3.7% from 2022 to 2032.

Table of Content

1. Executive Summary | Seismic Survey Equipment Market

    1.1. Global Market Outlook

    1.2. Demand-side Trends

    1.3. Supply-side Trends

    1.4. Technology Roadmap Analysis

    1.5. Analysis and Recommendations

2. Market Overview

    2.1. Market Coverage / Taxonomy

    2.2. Market Definition / Scope / Limitations

3. Market Background

    3.1. Market Dynamics

        3.1.1. Drivers

        3.1.2. Restraints

        3.1.3. Opportunity

        3.1.4. Trends

    3.2. Scenario Forecast

        3.2.1. Demand in Optimistic Scenario

        3.2.2. Demand in Likely Scenario

        3.2.3. Demand in Conservative Scenario

    3.3. Opportunity Map Analysis

    3.4. Investment Feasibility Matrix

    3.5. PESTLE and Porter’s Analysis

    3.6. Regulatory Landscape

        3.6.1. By Key Regions

        3.6.2. By Key Countries

4. Global Market Analysis 2017 to 2021 and Forecast, 2022 to 2032

    4.1. Historical Market Size Value (US$ Million) Analysis, 2017 to 2021

    4.2. Current and Future Market Size Value (US$ Million) Projections, 2022 to 2032

        4.2.1. Y-o-Y Growth Trend Analysis

        4.2.2. Absolute $ Opportunity Analysis

5. Global Market Analysis 2017 to 2021 and Forecast 2022 to 2032, By Component

    5.1. Introduction / Key Findings

    5.2. Historical Market Size Value (US$ Million) Analysis By Component, 2017 to 2021

    5.3. Current and Future Market Size Value (US$ Million) Analysis and Forecast By Component, 2022 to 2032

        5.3.1. Hardware

        5.3.2. Software

        5.3.3. Services

    5.4. Y-o-Y Growth Trend Analysis By Component, 2017 to 2021

    5.5. Absolute $ Opportunity Analysis By Component, 2022 to 2032

6. Global Market Analysis 2017 to 2021 and Forecast 2022 to 2032, By Technology

    6.1. Introduction / Key Findings

    6.2. Historical Market Size Value (US$ Million) Analysis By Technology, 2017 to 2021

    6.3. Current and Future Market Size Value (US$ Million) Analysis and Forecast By Technology, 2022 to 2032

        6.3.1. 2D

        6.3.2. 3D

        6.3.3. 4D

    6.4. Y-o-Y Growth Trend Analysis By Technology, 2017 to 2021

    6.5. Absolute $ Opportunity Analysis By Technology, 2022 to 2032

7. Global Market Analysis 2017 to 2021 and Forecast 2022 to 2032, By Location

    7.1. Introduction / Key Findings

    7.2. Historical Market Size Value (US$ Million) Analysis By Location, 2017 to 2021

    7.3. Current and Future Market Size Value (US$ Million) Analysis and Forecast By Location, 2022 to 2032

        7.3.1. On-shore

        7.3.2. Off-shore

    7.4. Y-o-Y Growth Trend Analysis By Location, 2017 to 2021

    7.5. Absolute $ Opportunity Analysis By Location, 2022 to 2032

8. Global Market Analysis 2017 to 2021 and Forecast 2022 to 2032, By Industry

    8.1. Introduction / Key Findings

    8.2. Historical Market Size Value (US$ Million) Analysis By Industry, 2017 to 2021

    8.3. Current and Future Market Size Value (US$ Million) Analysis and Forecast By Industry, 2022 to 2032

        8.3.1. Oil & Gas

        8.3.2. Others

    8.4. Y-o-Y Growth Trend Analysis By Industry, 2017 to 2021

    8.5. Absolute $ Opportunity Analysis By Industry, 2022 to 2032

9. Global Market Analysis 2017 to 2021 and Forecast 2022 to 2032, By Region

    9.1. Introduction

    9.2. Historical Market Size Value (US$ Million) Analysis By Region, 2017 to 2021

    9.3. Current Market Size Value (US$ Million) Analysis and Forecast By Region, 2022 to 2032

        9.3.1. North America

        9.3.2. Latin America

        9.3.3. Europe

        9.3.4. Asia Pacific

        9.3.5. Middle East and Africa (MEA)

    9.4. Market Attractiveness Analysis By Region

10. North America Market Analysis 2017 to 2021 and Forecast 2022 to 2032, By Country

    10.1. Historical Market Size Value (US$ Million) Trend Analysis By Market Taxonomy, 2017 to 2021

    10.2. Market Size Value (US$ Million) Forecast By Market Taxonomy, 2022 to 2032

        10.2.1. By Country

            10.2.1.1. United States of America

            10.2.1.2. Canada

        10.2.2. By Component

        10.2.3. By Technology

        10.2.4. By Location

        10.2.5. By Industry

    10.3. Market Attractiveness Analysis

        10.3.1. By Country

        10.3.2. By Component

        10.3.3. By Technology

        10.3.4. By Location

        10.3.5. By Industry

    10.4. Key Takeaways

11. Latin America Market Analysis 2017 to 2021 and Forecast 2022 to 2032, By Country

    11.1. Historical Market Size Value (US$ Million) Trend Analysis By Market Taxonomy, 2017 to 2021

    11.2. Market Size Value (US$ Million) Forecast By Market Taxonomy, 2022 to 2032

        11.2.1. By Country

            11.2.1.1. Brazil

            11.2.1.2. Mexico

            11.2.1.3. Rest of Latin America

        11.2.2. By Component

        11.2.3. By Technology

        11.2.4. By Location

        11.2.5. By Industry

    11.3. Market Attractiveness Analysis

        11.3.1. By Country

        11.3.2. By Component

        11.3.3. By Technology

        11.3.4. By Location

        11.3.5. By Industry

    11.4. Key Takeaways

12. Europe Market Analysis 2017 to 2021 and Forecast 2022 to 2032, By Country

    12.1. Historical Market Size Value (US$ Million) Trend Analysis By Market Taxonomy, 2017 to 2021

    12.2. Market Size Value (US$ Million) Forecast By Market Taxonomy, 2022 to 2032

        12.2.1. By Country

            12.2.1.1. Germany

            12.2.1.2. Italy

            12.2.1.3. France

            12.2.1.4. United Kingdom

            12.2.1.5. Spain

            12.2.1.6. Russia

            12.2.1.7. BENELUX

            12.2.1.8. Rest of Europe

        12.2.2. By Component

        12.2.3. By Technology

        12.2.4. By Location

        12.2.5. By Industry

    12.3. Market Attractiveness Analysis

        12.3.1. By Country

        12.3.2. By Component

        12.3.3. By Technology

        12.3.4. By Location

        12.3.5. By Industry

    12.4. Key Takeaways

13. Asia Pacific Market Analysis 2017 to 2021 and Forecast 2022 to 2032, By Country

    13.1. Historical Market Size Value (US$ Million) Trend Analysis By Market Taxonomy, 2017 to 2021

    13.2. Market Size Value (US$ Million) Forecast By Market Taxonomy, 2022 to 2032

        13.2.1. By Country

            13.2.1.1. China

            13.2.1.2. Japan

            13.2.1.3. South Korea

            13.2.1.4. India

            13.2.1.5. Rest of Asia Pacific

        13.2.2. By Component

        13.2.3. By Technology

        13.2.4. By Location

        13.2.5. By Industry

    13.3. Market Attractiveness Analysis

        13.3.1. By Country

        13.3.2. By Component

        13.3.3. By Technology

        13.3.4. By Location

        13.3.5. By Industry

    13.4. Key Takeaways

14. MEA Market Analysis 2017 to 2021 and Forecast 2022 to 2032, By Country

    14.1. Historical Market Size Value (US$ Million) Trend Analysis By Market Taxonomy, 2017 to 2021

    14.2. Market Size Value (US$ Million) Forecast By Market Taxonomy, 2022 to 2032

        14.2.1. By Country

            14.2.1.1. GCC Countries

            14.2.1.2. Rest of MEA

        14.2.2. By Component

        14.2.3. By Technology

        14.2.4. By Location

        14.2.5. By Industry

    14.3. Market Attractiveness Analysis

        14.3.1. By Country

        14.3.2. By Component

        14.3.3. By Technology

        14.3.4. By Location

        14.3.5. By Industry

    14.4. Key Takeaways

15. Key Countries Market Analysis

    15.1. United States of America

        15.1.1. Pricing Analysis

        15.1.2. Market Share Analysis, 2021

            15.1.2.1. By Component

            15.1.2.2. By Technology

            15.1.2.3. By Location

            15.1.2.4. By Industry

    15.2. Canada

        15.2.1. Pricing Analysis

        15.2.2. Market Share Analysis, 2021

            15.2.2.1. By Component

            15.2.2.2. By Technology

            15.2.2.3. By Location

            15.2.2.4. By Industry

    15.3. Brazil

        15.3.1. Pricing Analysis

        15.3.2. Market Share Analysis, 2021

            15.3.2.1. By Component

            15.3.2.2. By Technology

            15.3.2.3. By Location

            15.3.2.4. By Industry

    15.4. Mexico

        15.4.1. Pricing Analysis

        15.4.2. Market Share Analysis, 2021

            15.4.2.1. By Component

            15.4.2.2. By Technology

            15.4.2.3. By Location

            15.4.2.4. By Industry

    15.5. Argentina

        15.5.1. Pricing Analysis

        15.5.2. Market Share Analysis, 2021

            15.5.2.1. By Component

            15.5.2.2. By Technology

            15.5.2.3. By Location

            15.5.2.4. By Industry

    15.6. Germany

        15.6.1. Pricing Analysis

        15.6.2. Market Share Analysis, 2021

            15.6.2.1. By Component

            15.6.2.2. By Technology

            15.6.2.3. By Location

            15.6.2.4. By Industry

    15.7. Italy

        15.7.1. Pricing Analysis

        15.7.2. Market Share Analysis, 2021

            15.7.2.1. By Component

            15.7.2.2. By Technology

            15.7.2.3. By Location

            15.7.2.4. By Industry

    15.8. France

        15.8.1. Pricing Analysis

        15.8.2. Market Share Analysis, 2021

            15.8.2.1. By Component

            15.8.2.2. By Technology

            15.8.2.3. By Location

            15.8.2.4. By Industry

    15.9. United Kingdom

        15.9.1. Pricing Analysis

        15.9.2. Market Share Analysis, 2021

            15.9.2.1. By Component

            15.9.2.2. By Technology

            15.9.2.3. By Location

            15.9.2.4. By Industry

    15.10. Spain

        15.10.1. Pricing Analysis

        15.10.2. Market Share Analysis, 2021

            15.10.2.1. By Component

            15.10.2.2. By Technology

            15.10.2.3. By Location

            15.10.2.4. By Industry

    15.11. Russia

        15.11.1. Pricing Analysis

        15.11.2. Market Share Analysis, 2021

            15.11.2.1. By Component

            15.11.2.2. By Technology

            15.11.2.3. By Location

            15.11.2.4. By Industry

    15.12. BENELUX

        15.12.1. Pricing Analysis

        15.12.2. Market Share Analysis, 2021

            15.12.2.1. By Component

            15.12.2.2. By Technology

            15.12.2.3. By Location

            15.12.2.4. By Industry

    15.13. China

        15.13.1. Pricing Analysis

        15.13.2. Market Share Analysis, 2021

            15.13.2.1. By Component

            15.13.2.2. By Technology

            15.13.2.3. By Location

            15.13.2.4. By Industry

    15.14. Japan

        15.14.1. Pricing Analysis

        15.14.2. Market Share Analysis, 2021

            15.14.2.1. By Component

            15.14.2.2. By Technology

            15.14.2.3. By Location

            15.14.2.4. By Industry

    15.15. South Korea

        15.15.1. Pricing Analysis

        15.15.2. Market Share Analysis, 2021

            15.15.2.1. By Component

            15.15.2.2. By Technology

            15.15.2.3. By Location

            15.15.2.4. By Industry

    15.16. India

        15.16.1. Pricing Analysis

        15.16.2. Market Share Analysis, 2021

            15.16.2.1. By Component

            15.16.2.2. By Technology

            15.16.2.3. By Location

            15.16.2.4. By Industry

    15.17. GCC Countries

        15.17.1. Pricing Analysis

        15.17.2. Market Share Analysis, 2021

            15.17.2.1. By Component

            15.17.2.2. By Technology

            15.17.2.3. By Location

            15.17.2.4. By Industry

16. Market Structure Analysis

    16.1. Competition Dashboard

    16.2. Competition Benchmarking

    16.3. Market Share Analysis of Top Players

        16.3.1. By Regional

        16.3.2. By Component

        16.3.3. By Technology

        16.3.4. By Location

        16.3.5. By Industry

17. Competition Analysis

    17.1. Competition Deep Dive

        17.1.1. CCG

            17.1.1.1. Overview

            17.1.1.2. Product Portfolio

            17.1.1.3. Profitability by Market Segment

            17.1.1.4. Sales Footprint

            17.1.1.5. Strategy Overview

                17.1.1.5.1. Marketing Strategy

                17.1.1.5.2. Product Strategy

        17.1.2. Geospace Technologies

            17.1.2.1. Overview

            17.1.2.2. Product Portfolio

            17.1.2.3. Profitability by Market Segment

            17.1.2.4. Sales Footprint

            17.1.2.5. Strategy Overview

                17.1.2.5.1. Marketing Strategy

                17.1.2.5.2. Product Strategy

        17.1.3. Ion Geophysical

            17.1.3.1. Overview

            17.1.3.2. Product Portfolio

            17.1.3.3. Profitability by Market Segment

            17.1.3.4. Sales Footprint

            17.1.3.5. Strategy Overview

                17.1.3.5.1. Marketing Strategy

                17.1.3.5.2. Product Strategy

        17.1.4. Mitcham

            17.1.4.1. Overview

            17.1.4.2. Product Portfolio

            17.1.4.3. Profitability by Market Segment

            17.1.4.4. Sales Footprint

            17.1.4.5. Strategy Overview

                17.1.4.5.1. Marketing Strategy

                17.1.4.5.2. Product Strategy

        17.1.5. Wireless Seismic, Inc

            17.1.5.1. Overview

            17.1.5.2. Product Portfolio

            17.1.5.3. Profitability by Market Segment

            17.1.5.4. Sales Footprint

            17.1.5.5. Strategy Overview

                17.1.5.5.1. Marketing Strategy

                17.1.5.5.2. Product Strategy

        17.1.6. Petroleum Geo-Services

            17.1.6.1. Overview

            17.1.6.2. Product Portfolio

            17.1.6.3. Profitability by Market Segment

            17.1.6.4. Sales Footprint

            17.1.6.5. Strategy Overview

                17.1.6.5.1. Marketing Strategy

                17.1.6.5.2. Product Strategy

        17.1.7. Compagnie Generale de Geophysique

            17.1.7.1. Overview

            17.1.7.2. Product Portfolio

            17.1.7.3. Profitability by Market Segment

            17.1.7.4. Sales Footprint

            17.1.7.5. Strategy Overview

                17.1.7.5.1. Marketing Strategy

                17.1.7.5.2. Product Strategy

        17.1.8. Polarcus Limited

            17.1.8.1. Overview

            17.1.8.2. Product Portfolio

            17.1.8.3. Profitability by Market Segment

            17.1.8.4. Sales Footprint

            17.1.8.5. Strategy Overview

                17.1.8.5.1. Marketing Strategy

                17.1.8.5.2. Product Strategy

        17.1.9. Norwegian Petroleum Exploration Consultants

            17.1.9.1. Overview

            17.1.9.2. Product Portfolio

            17.1.9.3. Profitability by Market Segment

            17.1.9.4. Sales Footprint

            17.1.9.5. Strategy Overview

                17.1.9.5.1. Marketing Strategy

                17.1.9.5.2. Product Strategy

18. Assumptions & Acronyms Used

19. Research Methodology

List of Tables

Table 1: Global Market Value (US$ Million) Forecast by Region, 2017 to 2032

Table 2: Global Market Value (US$ Million) Forecast by Component, 2017 to 2032

Table 3: Global Market Value (US$ Million) Forecast by Technology, 2017 to 2032

Table 4: Global Market Value (US$ Million) Forecast by Location, 2017 to 2032

Table 5: Global Market Value (US$ Million) Forecast by Industry, 2017 to 2032

Table 6: North America Market Value (US$ Million) Forecast by Country, 2017 to 2032

Table 7: North America Market Value (US$ Million) Forecast by Component, 2017 to 2032

Table 8: North America Market Value (US$ Million) Forecast by Technology, 2017 to 2032

Table 9: North America Market Value (US$ Million) Forecast by Location, 2017 to 2032

Table 10: North America Market Value (US$ Million) Forecast by Industry, 2017 to 2032

Table 11: Latin America Market Value (US$ Million) Forecast by Country, 2017 to 2032

Table 12: Latin America Market Value (US$ Million) Forecast by Component, 2017 to 2032

Table 13: Latin America Market Value (US$ Million) Forecast by Technology, 2017 to 2032

Table 14: Latin America Market Value (US$ Million) Forecast by Location, 2017 to 2032

Table 15: Latin America Market Value (US$ Million) Forecast by Industry, 2017 to 2032

Table 16: Europe Market Value (US$ Million) Forecast by Country, 2017 to 2032

Table 17: Europe Market Value (US$ Million) Forecast by Component, 2017 to 2032

Table 18: Europe Market Value (US$ Million) Forecast by Technology, 2017 to 2032

Table 19: Europe Market Value (US$ Million) Forecast by Location, 2017 to 2032

Table 20: Europe Market Value (US$ Million) Forecast by Industry, 2017 to 2032

Table 21: Asia Pacific Market Value (US$ Million) Forecast by Country, 2017 to 2032

Table 22: Asia Pacific Market Value (US$ Million) Forecast by Component, 2017 to 2032

Table 23: Asia Pacific Market Value (US$ Million) Forecast by Technology, 2017 to 2032

Table 24: Asia Pacific Market Value (US$ Million) Forecast by Location, 2017 to 2032

Table 25: Asia Pacific Market Value (US$ Million) Forecast by Industry, 2017 to 2032

Table 26: MEA Market Value (US$ Million) Forecast by Country, 2017 to 2032

Table 27: MEA Market Value (US$ Million) Forecast by Component, 2017 to 2032

Table 28: MEA Market Value (US$ Million) Forecast by Technology, 2017 to 2032

Table 29: MEA Market Value (US$ Million) Forecast by Location, 2017 to 2032

Table 30: MEA Market Value (US$ Million) Forecast by Industry, 2017 to 2032

List of Charts

Figure 1: Global Market Value (US$ Million) by Component, 2022 to 2032

Figure 2: Global Market Value (US$ Million) by Technology, 2022 to 2032

Figure 3: Global Market Value (US$ Million) by Location, 2022 to 2032

Figure 4: Global Market Value (US$ Million) by Industry, 2022 to 2032

Figure 5: Global Market Value (US$ Million) by Region, 2022 to 2032

Figure 6: Global Market Value (US$ Million) Analysis by Region, 2017 to 2032

Figure 7: Global Market Value Share (%) and BPS Analysis by Region, 2022 to 2032

Figure 8: Global Market Y-o-Y Growth (%) Projections by Region, 2022 to 2032

Figure 9: Global Market Value (US$ Million) Analysis by Component, 2017 to 2032

Figure 10: Global Market Value Share (%) and BPS Analysis by Component, 2022 to 2032

Figure 11: Global Market Y-o-Y Growth (%) Projections by Component, 2022 to 2032

Figure 12: Global Market Value (US$ Million) Analysis by Technology, 2017 to 2032

Figure 13: Global Market Value Share (%) and BPS Analysis by Technology, 2022 to 2032

Figure 14: Global Market Y-o-Y Growth (%) Projections by Technology, 2022 to 2032

Figure 15: Global Market Value (US$ Million) Analysis by Location, 2017 to 2032

Figure 16: Global Market Value Share (%) and BPS Analysis by Location, 2022 to 2032

Figure 17: Global Market Y-o-Y Growth (%) Projections by Location, 2022 to 2032

Figure 18: Global Market Value (US$ Million) Analysis by Industry, 2017 to 2032

Figure 19: Global Market Value Share (%) and BPS Analysis by Industry, 2022 to 2032

Figure 20: Global Market Y-o-Y Growth (%) Projections by Industry, 2022 to 2032

Figure 21: Global Market Attractiveness by Component, 2022 to 2032

Figure 22: Global Market Attractiveness by Technology, 2022 to 2032

Figure 23: Global Market Attractiveness by Location, 2022 to 2032

Figure 24: Global Market Attractiveness by Industry, 2022 to 2032

Figure 25: Global Market Attractiveness by Region, 2022 to 2032

Figure 26: North America Market Value (US$ Million) by Component, 2022 to 2032

Figure 27: North America Market Value (US$ Million) by Technology, 2022 to 2032

Figure 28: North America Market Value (US$ Million) by Location, 2022 to 2032

Figure 29: North America Market Value (US$ Million) by Industry, 2022 to 2032

Figure 30: North America Market Value (US$ Million) by Country, 2022 to 2032

Figure 31: North America Market Value (US$ Million) Analysis by Country, 2017 to 2032

Figure 32: North America Market Value Share (%) and BPS Analysis by Country, 2022 to 2032

Figure 33: North America Market Y-o-Y Growth (%) Projections by Country, 2022 to 2032

Figure 34: North America Market Value (US$ Million) Analysis by Component, 2017 to 2032

Figure 35: North America Market Value Share (%) and BPS Analysis by Component, 2022 to 2032

Figure 36: North America Market Y-o-Y Growth (%) Projections by Component, 2022 to 2032

Figure 37: North America Market Value (US$ Million) Analysis by Technology, 2017 to 2032

Figure 38: North America Market Value Share (%) and BPS Analysis by Technology, 2022 to 2032

Figure 39: North America Market Y-o-Y Growth (%) Projections by Technology, 2022 to 2032

Figure 40: North America Market Value (US$ Million) Analysis by Location, 2017 to 2032

Figure 41: North America Market Value Share (%) and BPS Analysis by Location, 2022 to 2032

Figure 42: North America Market Y-o-Y Growth (%) Projections by Location, 2022 to 2032

Figure 43: North America Market Value (US$ Million) Analysis by Industry, 2017 to 2032

Figure 44: North America Market Value Share (%) and BPS Analysis by Industry, 2022 to 2032

Figure 45: North America Market Y-o-Y Growth (%) Projections by Industry, 2022 to 2032

Figure 46: North America Market Attractiveness by Component, 2022 to 2032

Figure 47: North America Market Attractiveness by Technology, 2022 to 2032

Figure 48: North America Market Attractiveness by Location, 2022 to 2032

Figure 49: North America Market Attractiveness by Industry, 2022 to 2032

Figure 50: North America Market Attractiveness by Country, 2022 to 2032

Figure 51: Latin America Market Value (US$ Million) by Component, 2022 to 2032

Figure 52: Latin America Market Value (US$ Million) by Technology, 2022 to 2032

Figure 53: Latin America Market Value (US$ Million) by Location, 2022 to 2032

Figure 54: Latin America Market Value (US$ Million) by Industry, 2022 to 2032

Figure 55: Latin America Market Value (US$ Million) by Country, 2022 to 2032

Figure 56: Latin America Market Value (US$ Million) Analysis by Country, 2017 to 2032

Figure 57: Latin America Market Value Share (%) and BPS Analysis by Country, 2022 to 2032

Figure 58: Latin America Market Y-o-Y Growth (%) Projections by Country, 2022 to 2032

Figure 59: Latin America Market Value (US$ Million) Analysis by Component, 2017 to 2032

Figure 60: Latin America Market Value Share (%) and BPS Analysis by Component, 2022 to 2032

Figure 61: Latin America Market Y-o-Y Growth (%) Projections by Component, 2022 to 2032

Figure 62: Latin America Market Value (US$ Million) Analysis by Technology, 2017 to 2032

Figure 63: Latin America Market Value Share (%) and BPS Analysis by Technology, 2022 to 2032

Figure 64: Latin America Market Y-o-Y Growth (%) Projections by Technology, 2022 to 2032

Figure 65: Latin America Market Value (US$ Million) Analysis by Location, 2017 to 2032

Figure 66: Latin America Market Value Share (%) and BPS Analysis by Location, 2022 to 2032

Figure 67: Latin America Market Y-o-Y Growth (%) Projections by Location, 2022 to 2032

Figure 68: Latin America Market Value (US$ Million) Analysis by Industry, 2017 to 2032

Figure 69: Latin America Market Value Share (%) and BPS Analysis by Industry, 2022 to 2032

Figure 70: Latin America Market Y-o-Y Growth (%) Projections by Industry, 2022 to 2032

Figure 71: Latin America Market Attractiveness by Component, 2022 to 2032

Figure 72: Latin America Market Attractiveness by Technology, 2022 to 2032

Figure 73: Latin America Market Attractiveness by Location, 2022 to 2032

Figure 74: Latin America Market Attractiveness by Industry, 2022 to 2032

Figure 75: Latin America Market Attractiveness by Country, 2022 to 2032

Figure 76: Europe Market Value (US$ Million) by Component, 2022 to 2032

Figure 77: Europe Market Value (US$ Million) by Technology, 2022 to 2032

Figure 78: Europe Market Value (US$ Million) by Location, 2022 to 2032

Figure 79: Europe Market Value (US$ Million) by Industry, 2022 to 2032

Figure 80: Europe Market Value (US$ Million) by Country, 2022 to 2032

Figure 81: Europe Market Value (US$ Million) Analysis by Country, 2017 to 2032

Figure 82: Europe Market Value Share (%) and BPS Analysis by Country, 2022 to 2032

Figure 83: Europe Market Y-o-Y Growth (%) Projections by Country, 2022 to 2032

Figure 84: Europe Market Value (US$ Million) Analysis by Component, 2017 to 2032

Figure 85: Europe Market Value Share (%) and BPS Analysis by Component, 2022 to 2032

Figure 86: Europe Market Y-o-Y Growth (%) Projections by Component, 2022 to 2032

Figure 87: Europe Market Value (US$ Million) Analysis by Technology, 2017 to 2032

Figure 88: Europe Market Value Share (%) and BPS Analysis by Technology, 2022 to 2032

Figure 89: Europe Market Y-o-Y Growth (%) Projections by Technology, 2022 to 2032

Figure 90: Europe Market Value (US$ Million) Analysis by Location, 2017 to 2032

Figure 91: Europe Market Value Share (%) and BPS Analysis by Location, 2022 to 2032

Figure 92: Europe Market Y-o-Y Growth (%) Projections by Location, 2022 to 2032

Figure 93: Europe Market Value (US$ Million) Analysis by Industry, 2017 to 2032

Figure 94: Europe Market Value Share (%) and BPS Analysis by Industry, 2022 to 2032

Figure 95: Europe Market Y-o-Y Growth (%) Projections by Industry, 2022 to 2032

Figure 96: Europe Market Attractiveness by Component, 2022 to 2032

Figure 97: Europe Market Attractiveness by Technology, 2022 to 2032

Figure 98: Europe Market Attractiveness by Location, 2022 to 2032

Figure 99: Europe Market Attractiveness by Industry, 2022 to 2032

Figure 100: Europe Market Attractiveness by Country, 2022 to 2032

Figure 101: Asia Pacific Market Value (US$ Million) by Component, 2022 to 2032

Figure 102: Asia Pacific Market Value (US$ Million) by Technology, 2022 to 2032

Figure 103: Asia Pacific Market Value (US$ Million) by Location, 2022 to 2032

Figure 104: Asia Pacific Market Value (US$ Million) by Industry, 2022 to 2032

Figure 105: Asia Pacific Market Value (US$ Million) by Country, 2022 to 2032

Figure 106: Asia Pacific Market Value (US$ Million) Analysis by Country, 2017 to 2032

Figure 107: Asia Pacific Market Value Share (%) and BPS Analysis by Country, 2022 to 2032

Figure 108: Asia Pacific Market Y-o-Y Growth (%) Projections by Country, 2022 to 2032

Figure 109: Asia Pacific Market Value (US$ Million) Analysis by Component, 2017 to 2032

Figure 110: Asia Pacific Market Value Share (%) and BPS Analysis by Component, 2022 to 2032

Figure 111: Asia Pacific Market Y-o-Y Growth (%) Projections by Component, 2022 to 2032

Figure 112: Asia Pacific Market Value (US$ Million) Analysis by Technology, 2017 to 2032

Figure 113: Asia Pacific Market Value Share (%) and BPS Analysis by Technology, 2022 to 2032

Figure 114: Asia Pacific Market Y-o-Y Growth (%) Projections by Technology, 2022 to 2032

Figure 115: Asia Pacific Market Value (US$ Million) Analysis by Location, 2017 to 2032

Figure 116: Asia Pacific Market Value Share (%) and BPS Analysis by Location, 2022 to 2032

Figure 117: Asia Pacific Market Y-o-Y Growth (%) Projections by Location, 2022 to 2032

Figure 118: Asia Pacific Market Value (US$ Million) Analysis by Industry, 2017 to 2032

Figure 119: Asia Pacific Market Value Share (%) and BPS Analysis by Industry, 2022 to 2032

Figure 120: Asia Pacific Market Y-o-Y Growth (%) Projections by Industry, 2022 to 2032

Figure 121: Asia Pacific Market Attractiveness by Component, 2022 to 2032

Figure 122: Asia Pacific Market Attractiveness by Technology, 2022 to 2032

Figure 123: Asia Pacific Market Attractiveness by Location, 2022 to 2032

Figure 124: Asia Pacific Market Attractiveness by Industry, 2022 to 2032

Figure 125: Asia Pacific Market Attractiveness by Country, 2022 to 2032

Figure 126: MEA Market Value (US$ Million) by Component, 2022 to 2032

Figure 127: MEA Market Value (US$ Million) by Technology, 2022 to 2032

Figure 128: MEA Market Value (US$ Million) by Location, 2022 to 2032

Figure 129: MEA Market Value (US$ Million) by Industry, 2022 to 2032

Figure 130: MEA Market Value (US$ Million) by Country, 2022 to 2032

Figure 131: MEA Market Value (US$ Million) Analysis by Country, 2017 to 2032

Figure 132: MEA Market Value Share (%) and BPS Analysis by Country, 2022 to 2032

Figure 133: MEA Market Y-o-Y Growth (%) Projections by Country, 2022 to 2032

Figure 134: MEA Market Value (US$ Million) Analysis by Component, 2017 to 2032

Figure 135: MEA Market Value Share (%) and BPS Analysis by Component, 2022 to 2032

Figure 136: MEA Market Y-o-Y Growth (%) Projections by Component, 2022 to 2032

Figure 137: MEA Market Value (US$ Million) Analysis by Technology, 2017 to 2032

Figure 138: MEA Market Value Share (%) and BPS Analysis by Technology, 2022 to 2032

Figure 139: MEA Market Y-o-Y Growth (%) Projections by Technology, 2022 to 2032

Figure 140: MEA Market Value (US$ Million) Analysis by Location, 2017 to 2032

Figure 141: MEA Market Value Share (%) and BPS Analysis by Location, 2022 to 2032

Figure 142: MEA Market Y-o-Y Growth (%) Projections by Location, 2022 to 2032

Figure 143: MEA Market Value (US$ Million) Analysis by Industry, 2017 to 2032

Figure 144: MEA Market Value Share (%) and BPS Analysis by Industry, 2022 to 2032

Figure 145: MEA Market Y-o-Y Growth (%) Projections by Industry, 2022 to 2032

Figure 146: MEA Market Attractiveness by Component, 2022 to 2032

Figure 147: MEA Market Attractiveness by Technology, 2022 to 2032

Figure 148: MEA Market Attractiveness by Location, 2022 to 2032

Figure 149: MEA Market Attractiveness by Industry, 2022 to 2032

Figure 150: MEA Market Attractiveness by Country, 2022 to 2032

Explore Technology Insights

View Reports

Seismic Survey Equipment Market