3D Scanners Market
Market Insights on 3D Scanners covering sales outlook, demand forecast & up-to-date key trends
3D Scanners Market By Component (3D Scanners /Hardware, 3D Scanning Software, Services), Type (Portable/Handheld, Desktop-based, Fixed-mount, Robot-mount), Range (Short Range, Medium Range, Long Range), End User (Automotive, Aerospace & Defense, Civil and Architecture, Healthcare, Education) & Region - Forecast to 2022 - 2030
3D Scanners Market Outlook (2022-2030)
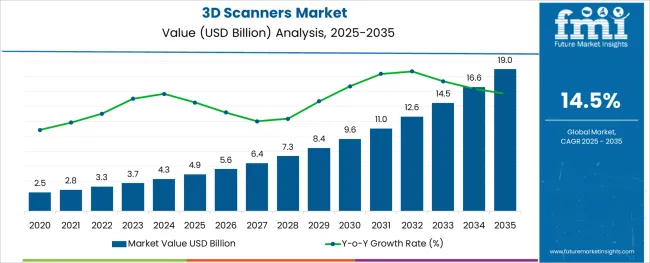
[330 Pages Report] Expanding at a high CAGR of 14.5%, the global 3D scanners market is projected to increase from a valuation of US$ 3.26 Bn in 2022 to US$ 9.65 Bn by 2030.
3D Scanners Market Size (2022) |
US$ 3.26 Bn |
Sales Forecast (2030) |
US$ 9.65 Bn |
Global Market Growth Rate (2022 to 2030) |
14.5% CAGR |
Share of Top 5 Players |
50% |
3D scanner sales accounted for 55% share of the global scanning devices market in 2021.
Let us know your requirement to get
100% FREE customization
How The Market Progressed Till June 2022?
Market Statistics |
Details |
H1,2021 (A) |
14.0% |
H1,2022 Projected (P) |
14.2% |
H1,2022 Outlook (O) |
14.5% |
BPS Change : H1,2022 (O) - H1,2022 (P) |
(+) 31 ↑ |
BPS Change : H1,2022 (O) - H1,2021 (A) |
(+) 54 ↑ |
Future Market Insights predict a comparison and review analysis for the dynamics of the 3D scanners market, which is predominantly subjected to an array of industry factors along with a few certain influences concerning the growth of the market.
According to FMI analysis, the variation between the BPS values observed in the 3D scanners market in H1, 2022 - Outlook over H1, 2022 Projected reflects a spike of 31 units. 3D scanning has become one of the significant tool in product lifecycle management (PLM) process. At every stage of the PLM process which include concept, design, manufacturing and servicing stage the 3D scanning is used.
In the gaming industry, 3D scanning have completely revolutionized the way company design, model and envision the real environment. Thus, increase in the use of 3D scanning is one of the main reasons for this change in growth rate.
Moreover, compared to H1, 2021, the market is expected to spike by 54 BPS in H1 -2022. The growing awareness of the advanced medical treatments which involves 3D scanners is also responsible for this change in growth rate. Advancement in the scanning process have improved and simplified the measuring and documenting process in various verticals from manufacturing to healthcare.
Demand Analysis of 3D Scanners from 2015 to 2021 Vs Market Projections for 2022 to 2030
“Increasing Technological Advancements in 3D Scanning Technology”
From 2015 to 2021, global sales of 3D scanners surged at a CAGR of around 13.3%
3D scanning is a method of capturing an object's three-dimensional properties as well as data such as color and texture. This technology aids in the reduction of time, cost, and effort in the production process while improving the output quality. It supports the clear visualization of a component as well as the accurate visualization of the particle.
Numerous technologically-advanced imaging applications are being introduced in the market. To support printing applications and imaging, 3D scanners are an important part of the overall value chain.
3D scanning is excessively used in healthcare applications and is increasingly being adopted in the media and entertainment industry. In addition, technological advancements have helped end users perform in-depth scanning across various industry verticals with such technologies.
Sales of 3D scanners are expected to reach US$ 9.65 Bn by registering a CAGR of 14.5% over the forecast period (2022-2030).
What is Driving Substantial Demand for 3D Scanners?
“Evolution of New 3D Scanner Software & Services”
Improved hardware performance along with better Internet connectivity has allowed increased user access to advanced tools from remote locations, particularly hospitals/clinics or research institute departments.
Advanced 3D scanner software is moving towards more specialized applications requiring unique post-processing. This includes apps for chronic obstructive pulmonary disease, surgical planning, oncology management, radiation treatment, and liver analysis.
Customers of advanced 3D scanner software and services now use cloud-computing-based services to host these various applications over the web. Therefore, technological advancements are likely to offer significant opportunities in the 3D scanners market in the near future.
3D metrology software has been making gradual progress, as manufacturing is a crucial aspect of several sectors such as automotive and healthcare, and requires quality assurance, although it accents high infrastructure expense. In addition, the technology finds extensive usage in industries - media & entertainment, aerospace & defense, healthcare, oil & gas, energy, automotive, and manufacturing.
Major providers of 3D scanning equipment, such as FARO and Hexagon, have introduced new 3D scanners with automation, high speed, and user-friendly features to gain a major share of the market over the coming years. Thus, the introduction of advanced technologies and the industry 4.0 revolution are significant factors driving growth of the market for 3D scanning products.
Find your sweet spots for generating winning opportunities in this market.
Talk to AnalystWhat Challenges are Expected to Hamper Market Growth?
“High Initial Cost Associated with 3D Scanning Solutions to Hinder Adoption”
One of the primary challenges that could slow demand growth of the 3D scanning solutions market is that the innovation is still in its early stages of commercial acceptance around the world. High costs of 3D scanners have been a great obstacle to their widespread adoption.
Furthermore, the 3D scanning devices market is constrained by fierce competition among existing 3D orthopedic scanner system makers, advancement of alternate scanning technologies, and product defects.
Which Region is a Lucrative Market for 3D Scanner Manufacturers?
“Rising R&D Investments for Development of 3D Scanning Technology Driving North America Market”
North America continues to capture a leading tranche of the total 3D scanners market size. Upswing in R&D expenditure in tandem with at-scale deployment of 3D scanning technology in the automotive sector and environmental scanning and modeling operations are driving the regional market growth.
Growing demand for handheld scanning devices and companies' increasing attention on 3D scanning technology and 3D machine vision are also contributing to the market growth of 3D scanning solutions in North America.
An unified Market Research Subscription Platform, built for today’s disparate research needs.
Country-wise Analysis
What is the Growth Outlook for 3D Scanners in the U.S.?
“Rising Popularity of Animation and Entertainment Industry to Boost Sales of Optical 3D Scanners”
The U.S. 3D scanners market is being driven by end-user sectors such as aviation, military, healthcare, and media. Furthermore, animation film production in the United States has increased as production firms have demonstrated an increasing interest in investing in animation films.
Furthermore, businesses in the U.S. are spending on optical 3D scanners since they reduce time and enhance product manufacturing rates.
How Lucrative is the Market for 3D Scanners in China?
“Automation and Infrastructure Sectors Creating Opportunities for Laser 3D Scanners”
The 3D scanning equipment market in China will experience demand growth from several use cases such as reverse engineering, civil surveying, architecture, and urban topography.
Rapidly growing automation and infrastructure industries are driving up the need for laser 3D scanners. China is the world's largest automobile manufacturer, with a lion's share of the global automotive market.
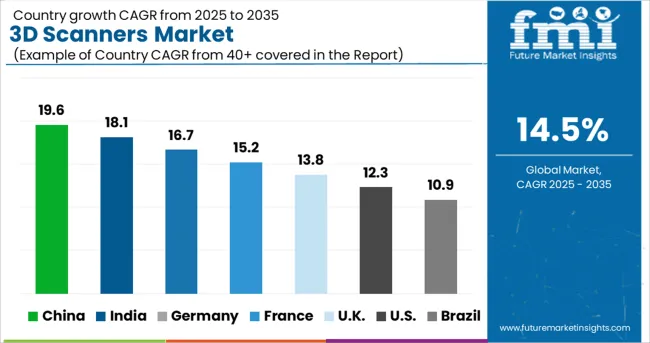
Due to manufacturing disruptions, rising research and development efforts, and increased regulatory support from government bodies, the 3D scanning products market in China is expected to grow at the fastest rate during the forecast period.
Category-wise Insights
Which Type of 3D Scanners is Likely to be Most Sought-after?
“Portable/Handheld 3D Scanners are Most Preferred Owing to Their Flexibility”
Portable/handheld 3D scanners are expected to account 37% share of the 3D scanners market in 2022. Demand for portable/handheld 3D scanners is likely to increase as these scanners enable in reaching difficult-to-reach locations.
In comparison to fixed 3D scanners, these scanners are more versatile and flexible. These scanners can take three-dimensional images of things of varied sizes. Handheld scanners can catch items of varying sizes, ranging from little objects to vehicles.
Moreover, portable/handheld 3D scanners are used to capture the interiors of damaged automobiles, enabling for the recording, measurement, and analysis of internal defects. Handheld 3D scanners check all boxes in terms of safety, speed, and adaptability, allowing for complete obstacle detection while also reducing traffic flow impact.
Which End User of 3D Scanners Leads the Market?
“Implementation of Advanced 3D Scanners in Healthcare Industry Enabling Professionals to Precisely Measure Patients’ Anatomy”
3D scanners have been triggering step-change transformations in the healthcare sector, owing to increasing scope of applications. They help healthcare organizations upgrade their existing processes accurately and effectively.
Integration of advanced 3D scanners and mixed reality (MR) in healthcare spaces incorporates real-time interactive imaging for aiding medical students and professionals in their medical practice.
Moreover, because advanced 3D scanners enable medical experts to analyze body parts in depth before surgical treatment, the healthcare industry is predicted to have the highest CAGR over the coming years.
COVID-19 Impact on 3D Scanner Sales
Manufacturing and automotive industries are major contributors to the growth of the 3D scanners market, but the coronavirus pandemic has impacted these industries significantly. Thus, a significant drop has been seen in demand for 3D scanners market from these industries.
The use of 3D scanning as a non-contact approach aids COVID-19 thoracic chest scanning. Following the outbreak of this respiratory ailment, 3D scanning technology was found to be a valuable technique for detecting and quantifying COVID 19 virus. Some manufacturers such as Canon Medical Systems are delivering materials and parts needed to take care of patients.
Competitive Landscape
Leading players in the 3D scanners market are distributing their products majorly via direct sales channels. Moreover, they are leveraging value added resellers (VAR), original equipment manufacturers (OEMs), and system integrators to market their product offerings.
For instance,
- In July 2021, Topcon Co. Ltd declared the acquisition of VISIA Imaging S. This deal will aid the company's production and advancement of fundus imaging equipment.
Report Scope
Attribute |
Details |
Forecast Period |
2022-2030 |
Historical Data Available for |
2015-2021 |
Market Analysis |
Value in US$ Mn, Volume in Units |
Key Regions Covered |
|
Key Countries Covered |
|
Key Market Segments Covered |
|
Key Companies Profiled |
|
Pricing |
Available upon Request |
Key Segments of 3D Scanners Industry Survey
3D Scanners Market By Component :
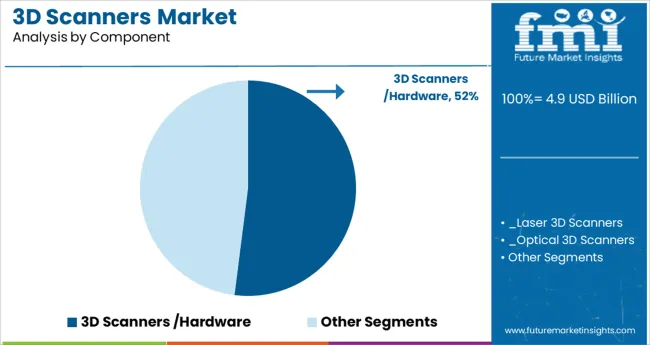
- 3D Scanners /Hardware
- Laser 3D Scanners
- Optical 3D Scanners
- Structured-light 3D Scanners
- 3D Scanning Software
- Services
- 3D Design & Modelling
- Integration & Deployment
- Consulting
- Support & Maintenance
3D Scanners Market By Type :
- Portable/Handheld 3D Scanners
- Desktop-based 3D Scanners
- Fixed-mount 3D Scanners
- Robot-mount 3D Scanners
3D Scanners Market By Range :
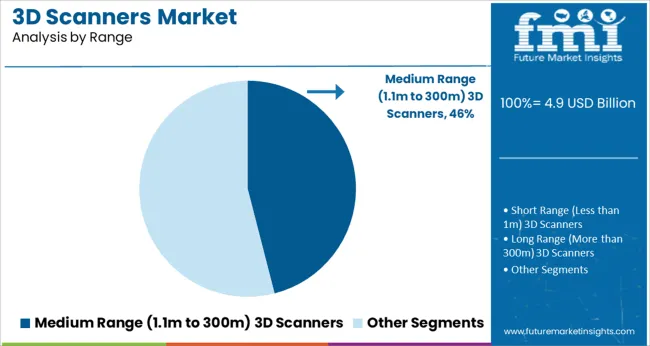
- Short Range (Less than 1m) 3D Scanners
- Medium Range (1.1m to 300m) 3D Scanners
- Long Range (More than 300m) 3D Scanners
3D Scanners Market By End User :
- Automotive
- Aerospace & Defense
- Civil and Architecture
- Healthcare
- Education
- Manufacturing
- Media & Entertainment
- Others
3D Scanners Market By Region :
- North America 3D Scanners Market
- Latin America 3D Scanners Market
- Europe 3D Scanners Market
- East Asia 3D Scanners Market
- South Asia & Pacific 3D Scanners Market
- Middle East & Africa (MEA) 3D Scanners Market
Frequently Asked Questions
In 2022, the market for 3D scanners is likely to reach US$ 3.26 Bn.
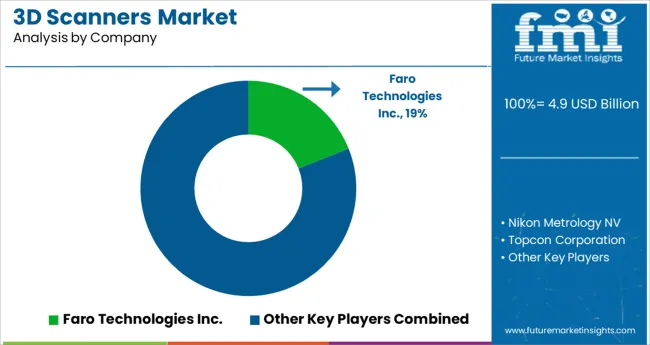
Hexagon AB, Faro Technologies Inc., Nikon Metrology NV, Topcon Corporation, and Trimble Inc. are key 3D scanner manufacturers.
Increasing R&D expenditure, tech-enabled advances, and rise of structured light technology are key factors fueling market growth.
Portable/handheld 3D scanners are estimated to hold 37% share in the global market.
The 3D scanning equipment market is expected to reach nearly US$ 9.65 Bn by 2030
1. Executive Summary
1.1. Global Market Outlook
1.2. Demand Side Trends
1.3. Supply Side Trends
1.4. Analysis and Recommendations
2. Market Overview
2.1. Market Coverage / Taxonomy
2.2. Market Definition / Scope / Limitations
3. Key Market Trends
3.1. Key Trends Impacting the Market
3.2. Innovation / Development Trends
3.3. Key Success Factors
4. Impact Analysis of Pandemic Crisis & Economic Slowdown
4.1. Impact of crisis (such as SARs/ 2008 Recession/COVID-19) on IT industry
4.2. Future Market Impact Trends
4.3. Recovery Scenario (Short Term/Mid Term/Long Term Impact on 3D Scanners Market)
4.4. Current Economic Projections and Probable Impact of COVID-19 on GDP
5. Market Structure Analysis
5.1. Market Analysis by Tier of Companies
5.2. Market Concentration
5.3. Market Share Analysis of Top Players
5.4. Market Presence Analysis
5.4.1. Regional footprint by Players
5.4.2. Product footprint by Players
5.4.3. Channel footprint by Players
6. Global Wireless Mouse Market Demand (in Volume Mn Units) Analysis 2015-2021 and Forecast, 2022-2030
6.1. Historical Market Volume (Mn Units) Analysis, 2015-2021
6.2. Current and Future Market Volume (Mn Units) Projections, 2022-2030
6.3. Y-o-Y Growth Trend Analysis
7. Global 3D Scanners Market Demand (in Value in US$ Mn) Analysis 2015 - 2021 and Forecast, 2022 - 2030
7.1. Historical Market Value (US$ Mn) Analysis, 2015 - 2021
7.2. Current and Future Market Value (US$ Mn) Projections, 2022 - 2030
7.2.1. Y-o-Y Growth Trend Analysis
7.2.2. Absolute $ Opportunity Analysis
8. Market Background
8.1. Macro-Economic Factors
8.1.1. Global GDP Growth Outlook
8.1.2. Global ICT Spending
8.1.3. Adoption Of IT Services In Healthcare Industry
8.2. Forecast Factors - Relevance & Impact
8.3. Value Chain Analysis
8.4. Market Dynamics
8.4.1. Drivers
8.4.2. Restraints
8.4.3. Opportunities
9. Global 3D Scanners Market Analysis 2015 - 2021 and Forecast 2022 - 2030, by Component
9.1. Introduction / Key Findings
9.2. Historical Market Size (US$ Mn) Analysis By Component, 2015 - 2021
9.3. Current and Future Market Size (US$ Mn) Analysis and Forecast By Component, 2022 - 2030
9.3.1. 3D Scanner/Hardware
9.3.1.1. Laser 3D Scanners
9.3.1.2. Optical 3D Scanners
9.3.1.3. Structured-light 3D Scanners
9.3.2. 3D Scanning Software
9.3.3. Services
9.3.3.1. 3D Design & Modelling
9.3.3.2. Integration & Deployment
9.3.3.3. Consulting
9.3.3.4. Support & Maintenance
9.4. Market Attractiveness Analysis By Component
10. Global 3D Scanners Market Analysis 2015 - 2021 and Forecast 2022 - 2030, by Type
10.1. Introduction / Key Findings
10.2. Historical Market Size (US$ Mn) Analysis By Type, 2015 - 2021
10.3. Current and Future Market Size (US$ Mn) Analysis and Forecast By Type, 2022 - 2030
10.3.1. Portable/Handheld
10.3.2. Desktop-based
10.3.3. Fixed-mount
10.3.4. Robot-mount
10.4. Market Attractiveness Analysis By Type
11. Global 3D Scanners Market Analysis 2015 - 2021 and Forecast 2022 - 2030, by Range
11.1. Introduction / Key Findings
11.2. Historical Market Size (US$ Mn) Analysis By Range, 2015 - 2021
11.3. Current and Future Market Size (US$ Mn) Analysis and Forecast By Range, 2022 - 2030
11.3.1. Short Range (Less than 1m)
11.3.2. Medium Range (1.1m to 300m)
11.3.3. Long Range (More than 300.1m)
11.4. Market Attractiveness Analysis By Range
12. Global 3D Scanners Market Analysis 2015 - 2021 and Forecast 2022 - 2030, by End-user
12.1. Introduction / Key Findings
12.2. Historical Market Size (US$ Mn) Analysis By End-user, 2015 - 2021
12.3. Current and Future Market Size (US$ Mn) Analysis and Forecast By End-user, 2022 - 2030
12.3.1. Automotive
12.3.2. Aerospace & Defense
12.3.3. Civil and Architecture
12.3.4. Healthcare
12.3.5. Education
12.3.6. Manufacturing
12.3.7. Media & Entertainment
12.3.8. Others
12.4. Market Attractiveness Analysis By End-user
13. Global 3D Scanners Market Analysis 2015 - 2021 and Forecast 2022 - 2030, by Region
13.1. Introduction / Key Findings
13.2. Historical Market Size (US$ Mn) Analysis By Region, 2015 - 2021
13.3. Current Market Size (US$ Mn) Analysis and Forecast By Region, 2022 - 2030
13.3.1. North America
13.3.2. Latin America
13.3.3. Europe
13.3.4. East Asia
13.3.5. South Asia & Pacific
13.3.6. Middle East & Africa
13.4. Market Attractiveness Analysis By Region
14. North America 3D Scanners Market Analysis 2015 - 2021 and Forecast 2022 - 2030
14.1. Introduction
14.2. Historical Market Size (US$ Mn) Trend Analysis By Market Taxonomy, 2015 - 2021
14.3. Market Size (US$ Mn) Forecast By Market Taxonomy, 2022 - 2030
14.3.1. By Component
14.3.2. By Type
14.3.3. By Range
14.3.4. By End-user
14.3.5. By Country
14.3.5.1. U.S.
14.3.5.2. Canada
14.4. Market Attractiveness Analysis
14.4.1. By Component
14.4.2. By Type
14.4.3. By Range
14.4.4. By End-user
14.4.5. By Country
14.5. Market Trends
14.6. Key Market Participants - Intensity Mapping
15. Latin America 3D Scanners Market Analysis 2015 - 2021 and Forecast 2022 - 2030
15.1. Introduction
15.2. Historical Market Size (US$ Mn) Trend Analysis By Market Taxonomy, 2015 - 2021
15.3. Market Size (US$ Mn) Forecast By Market Taxonomy, 2022 - 2030
15.3.1. By Component
15.3.2. By Type
15.3.3. By Range
15.3.4. By End-user
15.3.5. By Country
15.3.5.1. Brazil
15.3.5.2. Mexico
15.3.5.3. Rest of Latin America
15.4. Market Attractiveness Analysis
15.4.1. By Component
15.4.2. By Type
15.4.3. By Range
15.4.4. By End-user
15.4.5. By Country
15.5. Market Trends
15.6. Key Market Participants - Intensity Mapping
16. Europe 3D Scanners Market Analysis 2015 - 2021 and Forecast 2022 - 2030
16.1. Introduction
16.2. Historical Market Size (US$ Mn) Trend Analysis By Market Taxonomy, 2015 - 2021
16.3. Market Size (US$ Mn) Forecast By Market Taxonomy, 2022 - 2030
16.3.1. By Component
16.3.2. By Type
16.3.3. By Range
16.3.4. By End-user
16.3.5. By Country
16.3.5.1. Germany
16.3.5.2. Italy
16.3.5.3. France
16.3.5.4. U.K.
16.3.5.5. Spain
16.3.5.6. BENELUX
16.3.5.7. Russia
16.3.5.8. Rest of Europe
16.4. Market Attractiveness Analysis
16.4.1. By Component
16.4.2. By Type
16.4.3. By Range
16.4.4. By End-user
16.4.5. By Country
16.5. Market Trends
16.6. Key Market Participants - Intensity Mapping
17. East Asia 3D Scanners Market Analysis 2015 - 2021 and Forecast 2022 - 2030
17.1. Introduction
17.2. Historical Market Size (US$ Mn) Trend Analysis By Market Taxonomy, 2015 - 2021
17.3. Market Size (US$ Mn) Forecast By Market Taxonomy, 2022 - 2030
17.3.1. By Component
17.3.2. By Type
17.3.3. By Range
17.3.4. By End-user
17.3.5. By Country
17.3.5.1. China
17.3.5.2. Japan
17.3.5.3. South Korea
17.4. Market Attractiveness Analysis
17.4.1. By Component
17.4.2. By Type
17.4.3. By Range
17.4.4. By End-user
17.4.5. By Country
17.5. Market Trends
17.6. Key Market Participants - Intensity Mapping
18. South Asia & Pacific 3D Scanners Market Analysis 2015 - 2021 and Forecast 2022 - 2030
18.1. Introduction
18.2. Historical Market Size (US$ Mn) Trend Analysis By Market Taxonomy, 2015 - 2021
18.3. Market Size (US$ Mn) Forecast By Market Taxonomy, 2022 - 2030
18.3.1. By Component
18.3.2. By Type
18.3.3. By Range
18.3.4. By End-user
18.3.5. By Country
18.3.5.1. India
18.3.5.2. Thailand
18.3.5.3. Indonesia
18.3.5.4. Malaysia
18.3.5.5. Oceania
18.3.5.6. Rest of South Asia & Pacific
18.4. Market Attractiveness Analysis
18.4.1. By Component
18.4.2. By Type
18.4.3. By Range
18.4.4. By End-user
18.4.5. By Country
18.5. Market Trends
18.6. Key Market Participants - Intensity Mapping
19. Middle East and Africa 3D Scanners Market Analysis 2015 - 2021 and Forecast 2022 - 2030
19.1. Introduction
19.2. Historical Market Size (US$ Mn) Trend Analysis By Market Taxonomy, 2015 - 2021
19.3. Market Size (US$ Mn) Forecast By Market Taxonomy, 2022 - 2030
19.3.1. By Component
19.3.2. By Type
19.3.3. By Range
19.3.4. By End-user
19.3.5. By Country
19.3.5.1. GCC Countries
19.3.5.2. Turkey
19.3.5.3. Northern Africa
19.3.5.4. South Africa
19.3.5.5. Rest of Middle East and Africa
19.4. Market Attractiveness Analysis
19.4.1. By Component
19.4.2. By Type
19.4.3. By Range
19.4.4. By End-user
19.4.5. By Country
19.5. Market Trends
19.6. Key Market Participants - Intensity Mapping
20. Key and Emerging Countries Analysis- 3D Scanners Market
20.1. U.S. 3D Scanners Market Analysis
20.1.1. By Component
20.1.2. By Type
20.1.3. By Range
20.1.4. By End-user
20.2. Canada Market Analysis
20.2.1. By Component
20.2.2. By Type
20.2.3. By Range
20.2.4. By End-user
20.3. Mexico 3D Scanners Market Analysis
20.3.1. By Component
20.3.2. By Type
20.3.3. By Range
20.3.4. By End-user
20.4. Brazil 3D Scanners Market Analysis
20.4.1. By Component
20.4.2. By Type
20.4.3. By Range
20.4.4. By End-user
20.5. Germany 3D Scanners Market Analysis
20.5.1. By Component
20.5.2. By Type
20.5.3. By Range
20.5.4. By End-user
20.6. Italy 3D Scanners Market Analysis
20.6.1. By Component
20.6.2. By Type
20.6.3. By Range
20.6.4. By End-user
20.7. France 3D Scanners Market Analysis
20.7.1. By Component
20.7.2. By Type
20.7.3. By Range
20.7.4. By End-user
20.8. U.K. 3D Scanners Market Analysis
20.8.1. By Component
20.8.2. By Type
20.8.3. By Range
20.8.4. By End-user
20.9. Spain 3D Scanners Market Analysis
20.9.1. By Component
20.9.2. By Type
20.9.3. By Range
20.9.4. By End-user
20.10. BENELUX 3D Scanners Market Analysis
20.10.1. By Component
20.10.2. By Type
20.10.3. By Range
20.10.4. By End-user
20.11. Russia 3D Scanners Market Analysis
20.11.1. By Component
20.11.2. By Type
20.11.3. By Range
20.11.4. By End-user
20.12. China 3D Scanners Market Analysis
20.12.1. By Component
20.12.2. By Type
20.12.3. By Range
20.12.4. By End-user
20.13. Japan 3D Scanners Market Analysis
20.13.1. By Component
20.13.2. By Type
20.13.3. By Range
20.13.4. By End-user
20.14. South Korea 3D Scanners Market Analysis
20.14.1. By Component
20.14.2. By Type
20.14.3. By Range
20.14.4. By End-user
20.15. India 3D Scanners Market Analysis
20.15.1. By Component
20.15.2. By Type
20.15.3. By Range
20.15.4. By End-user
20.16. ASEAN 3D Scanners Market Analysis
20.16.1. By Component
20.16.2. By Type
20.16.3. By Range
20.16.4. By End-user
20.17. Australia and New Zealand 3D Scanners Market Analysis
20.17.1. By Component
20.17.2. By Type
20.17.3. By Range
20.17.4. By End-user
20.18. GCC Countries 3D Scanners Market Analysis
20.18.1. By Component
20.18.2. By Type
20.18.3. By Range
20.18.4. By End-user
20.19. Turkey 3D Scanners Market Analysis
20.19.1. By Component
20.19.2. By Type
20.19.3. By Range
20.19.4. By End-user
20.20. South Africa 3D Scanners Market Analysis
20.20.1. By Component
20.20.2. By Type
20.20.3. By Range
20.20.4. By End-user
21. Competition Analysis
21.1. Competition Dashboard
21.2. Pricing Analysis, by Competition
21.3. Competition Deep Dive
21.3.1. Faro Technologies Inc.
21.3.1.1. Business Overview
21.3.1.2. Product & End-users Portfolio
21.3.1.3. Profitability by Market Segments (Product/Channel/Region)
21.3.1.4. Sales Footprint
21.3.1.5. Strategy Overview
21.3.1.5.1. Marketing Strategy
21.3.1.5.2. Product Strategy
21.3.1.5.3. Channel Strategy
21.3.2. Nikon Metrology NV
21.3.2.1. Business Overview
21.3.2.2. Product & End-users Portfolio
21.3.2.3. Profitability by Market Segments (Product/Channel/Region)
21.3.2.4. Sales Footprint
21.3.2.5. Strategy Overview
21.3.2.5.1. Marketing Strategy
21.3.2.5.2. Product Strategy
21.3.2.5.3. Channel Strategy
21.3.3. Topcon Corporation
21.3.3.1. Business Overview
21.3.3.2. Product & End-users Portfolio
21.3.3.3. Profitability by Market Segments (Product/Channel/Region)
21.3.3.4. Sales Footprint
21.3.3.5. Strategy Overview
21.3.3.5.1. Marketing Strategy
21.3.3.5.2. Product Strategy
21.3.3.5.3. Channel Strategy
21.3.4. Trimble Inc.
21.3.4.1. Business Overview
21.3.4.2. Product & End-users Portfolio
21.3.4.3. Profitability by Market Segments (Product/Channel/Region)
21.3.4.4. Sales Footprint
21.3.4.5. Strategy Overview
21.3.4.5.1. Marketing Strategy
21.3.4.5.2. Product Strategy
21.3.4.5.3. Channel Strategy
21.3.5. Creaform, Inc.
21.3.5.1. Business Overview
21.3.5.2. Product & End-users Portfolio
21.3.5.3. Profitability by Market Segments (Product/Channel/Region)
21.3.5.4. Sales Footprint
21.3.5.5. Strategy Overview
21.3.5.5.1. Marketing Strategy
21.3.5.5.2. Product Strategy
21.3.5.5.3. Channel Strategy
21.3.6. 3D Digital Corporation
21.3.6.1. Business Overview
21.3.6.2. Product & End-users Portfolio
21.3.6.3. Profitability by Market Segments (Product/Channel/Region)
21.3.6.4. Sales Footprint
21.3.6.5. Strategy Overview
21.3.6.5.1. Marketing Strategy
21.3.6.5.2. Product Strategy
21.3.6.5.3. Channel Strategy
21.3.7. Perceptron, Inc.
21.3.7.1. Business Overview
21.3.7.2. Product & End-users Portfolio
21.3.7.3. Profitability by Market Segments (Product/Channel/Region)
21.3.7.4. Sales Footprint
21.3.7.5. Strategy Overview
21.3.7.5.1. Marketing Strategy
21.3.7.5.2. Product Strategy
21.3.7.5.3. Channel Strategy
21.3.8. Autodesk, Inc.
21.3.8.1. Business Overview
21.3.8.2. Product & End-users Portfolio
21.3.8.3. Profitability by Market Segments (Product/Channel/Region)
21.3.8.4. Sales Footprint
21.3.8.5. Strategy Overview
21.3.8.5.1. Marketing Strategy
21.3.8.5.2. Product Strategy
21.3.8.5.3. Channel Strategy
21.3.9. 3D Systems, Inc.
21.3.9.1. Business Overview
21.3.9.2. Product & End-users Portfolio
21.3.9.3. Profitability by Market Segments (Product/Channel/Region)
21.3.9.4. Sales Footprint
21.3.9.5. Strategy Overview
21.3.9.5.1. Marketing Strategy
21.3.9.5.2. Product Strategy
21.3.9.5.3. Channel Strategy
21.3.10. ShapeGrabber
21.3.10.1. Business Overview
21.3.10.2. Product & End-users Portfolio
21.3.10.3. Profitability by Market Segments (Product/Channel/Region)
21.3.10.4. Sales Footprint
21.3.10.5. Strategy Overview
21.3.10.5.1. Marketing Strategy
21.3.10.5.2. Product Strategy
21.3.10.5.3. Channel Strategy
22. Assumptions and Acronyms Used
23. Research Methodology
Let us know your requirement to get
100% FREE customization
Table 01: Global 3D Scanners Market Size (US$ Mn) Forecast by Component, 2015-2030
Table 02: Global 3D Scanners Market Size (‘000 Units) Forecast by Component, 2015-2030
Table 03: Global 3D Scanners Market Size (US$ Mn) Forecast by Type, 2015-2030
Table 04: Global 3D Scanners Market Size (US$ Mn) Forecast by Range, 2015-2030
Table 05: Global 3D Scanners Market Size (US$ Mn) Forecast by End-user, 2015-2030
Table 06: Global 3D Scanners Market Size (US$ Mn) Forecast by Region, 2015-2030
Table 07: North America 3D Scanners Market Size (US$ Mn) Forecast by Component, 2015-2030
Table 08: North America 3D Scanners Market Size (US$ Mn) Forecast by Type, 2015-2030
Table 09: North America 3D Scanners Market Size (US$ Mn) Forecast by Range, 2015-2030
Table 10: Global 3D Scanners Market: Market Share Analysis by Type - 2020-2030
Table 11: North America 3D Scanners Market Size (US$ Mn) Forecast by Country, 2015-2030
Table 12: Latin America 3D Scanners Market Size (US$ Mn) Forecast by Component, 2015-2030
Table 13: Latin America 3D Scanners Market Size (US$ Mn) Forecast by Type, 2015-2030
Table 14: Latin America 3D Scanners Market Size (US$ Mn) Forecast by Range, 2015-2030
Table 15: Latin America 3D Scanners Market Size (US$ Mn) Forecast by End-user, 2015-2030
Table 16: Latin America 3D Scanners Market Size (US$ Mn) Forecast by Country, 2015-2030
Table 17: Europe 3D Scanners Market Size (US$ Mn) Forecast by Component, 2015-2030
Table 18: Europe 3D Scanners Market Size (US$ Mn) Forecast by Type, 2015-2030
Table 19: Europe 3D Scanners Market Size (US$ Mn) Forecast by Range, 2015-2030
Table 20: Europe 3D Scanners Market Size (US$ Mn) Forecast by End-user, 2015-2030
Table 21: Europe 3D Scanners Market Size (US$ Mn) Forecast by Country, 2015-2030
Table 22: East Asia 3D Scanners Market Size (US$ Mn) Forecast by Component, 2015-2030
Table 23: East Asia 3D Scanners Market Size (US$ Mn) Forecast by Type, 2015-2030
Table 24: East Asia 3D Scanners Market Size (US$ Mn) Forecast by Range, 2015-2030
Table 25: East Asia 3D Scanners Market Size (US$ Mn) Forecast by End-user, 2015-2030
Table 26: East Asia 3D Scanners Market Size (US$ Mn) Forecast by Country, 2015-2030
Table 27: South Asia & Pacific 3D Scanners Market Size (US$ Mn) Forecast by Component, 2015-2030
Table 28: South Asia & Pacific 3D Scanners Market Size (US$ Mn) Forecast by Type, 2015-2030
Table 29: South Asia & Pacific 3D Scanners Market Size (US$ Mn) Forecast by Range, 2015-2030
Table 30: South Asia & Pacific 3D Scanners Market Size (US$ Mn) Forecast by End-user, 2015-2030
Table 31: South Asia & Pacific 3D Scanners Market Size (US$ Mn) Forecast by Country, 2015-2030
Table 32: Middle East & Africa 3D Scanners Market Size (US$ Mn) Forecast by Component, 2015-2030
Table 33: Middle East & Africa 3D Scanners Market Size (US$ Mn) Forecast by Type, 2015-2030
Table 34: Middle East & Africa 3D Scanners Market Size (US$ Mn) Forecast by Range, 2015-2030
Table 35: Middle East & Africa 3D Scanners Market Size (US$ Mn) Forecast by End-user, 2015-2030
Table 36: Middle East & Africa 3D Scanners Market Size (US$ Mn) Forecast by Region, 2015-2030
Find your sweet spots for generating winning opportunities in this market.
Talk to AnalystFigure 01: Worldwide ICT Spending
Figure 02: Historical GDP Growth
Figure 03: Worldwide Healthcare IT spending
Figure 04: Global IoT Spending
Figure 05: Global 3D Scanners Market Value (US$ Mn), 2015-2021
Figure 06: Global 3D Scanners Market Value (US$ Mn), 2022-2030
Figure 07: Global 3D Scanners Market: Market Share Analysis by Component - 2022-2030
Figure 08: Global 3D Scanners Market: Y-o-Y Growth Comparison by Component, 2022-2030
Figure 09: Global 3D Scanners Market: Market Attractiveness by Component
Figure 10: Global 3D Scanners Market: Market Share Analysis by Type - 2022-2030
Figure 11: Global 3D Scanners Market: Y-o-Y Growth Comparison by Type, 2022-2030
Figure 12: Global 3D Scanners Market: Market Attractiveness by Type
Figure 13: Global 3D Scanners Market: Market Share Analysis by Range - 2022-2030
Figure 14: Global 3D Scanners Market: Y-o-Y Growth Comparison by Range, 2022-2030
Figure 15: Global 3D Scanners Market: Market Attractiveness by Range
Figure 16: Global 3D Scanners Market: Market Share Analysis by End-user - 2022-2030
Figure 17: Global 3D Scanners Market: Y-o-Y Growth Comparison by End-user, 2022-2030
Figure 18: Global 3D Scanners Market: Market Attractiveness by End-user
Figure 19: Global 3D Scanners Market: Market Share Analysis by Region - 2022-2030
Figure 20: Global 3D Scanners Market: Y-o-Y Growth Comparison by Region, 2022-2030
Figure 21: North America 3D Scanners Market Absolute $ Opportunity (US$ Mn), 2015 - 2030
Figure 22: Latin America 3D Scanners Market Absolute $ Opportunity (US$ Mn), 2015 - 2030
Figure 23: Europe 3D Scanners Market Absolute $ Opportunity (US$ Mn), 2015 - 2030
Figure 24: East Asia 3D Scanners Market Absolute $ Opportunity (US$ Mn), 2015 - 2030
Figure 25: South Asia & Pacific 3D Scanners Market Absolute $ Opportunity (US$ Mn), 2015 - 2030
Figure 26: Middle East & Africa 3D Scanners Market Absolute $ Opportunity (US$ Mn), 2015 - 2030
Figure 27: Global 3D Scanners Market: Market Attractiveness by Region
Figure 28: North America 3D Scanners Market Value (US$ Mn), 2015-2021
Figure 29: North America 3D Scanners Market Value (US$ Mn), 2022-2030
Figure 30: North America 3D Scanners Market: Market Share Analysis by Component - 2022-2030
Figure 31: North America 3D Scanners Market: Y-o-Y Growth Comparison by Component, 2022-2030
Figure 32: North America 3D Scanners Market: Market Attractiveness by Component
Figure 33: North America 3D Scanners Market: Market Share Analysis by Type - 2022-2030
Figure 34: North America 3D Scanners Market: Y-o-Y Growth Comparison by Type, 2022-2030
Figure 35: North America 3D Scanners Market: Market Attractiveness by Type
Figure 36: North America 3D Scanners Market: Market Share Analysis by Range - 2022-2030
Figure 37: North America 3D Scanners Market: Y-o-Y Growth Comparison by Range, 2022-2030
Figure 38: North America 3D Scanners Market: Market Attractiveness by Range
Figure 39: North America 3D Scanners Market: Market Share Analysis by End-user - 2022-2030
Figure 40: North America 3D Scanners Market: Y-o-Y Growth Comparison by End-user, 2022-2030
Figure 41: North America 3D Scanners Market: Market Attractiveness by End-user
Figure 42: North America 3D Scanners Market: Market Share Analysis by Country - 2022-2030
Figure 43: North America 3D Scanners Market: Y-o-Y Growth Comparison by Country, 2022-2030
Figure 44: U.S. 3D Scanners Market Absolute $ Opportunity (US$ Mn), 2015 - 2030
Figure 45: Canada 3D Scanners Market Absolute $ Opportunity (US$ Mn), 2015 - 2030
Figure 46: North America 3D Scanners Market: Market Attractiveness by Country
Figure 47: Latin America 3D Scanners Market Value (US$ Mn), 2015-2021
Figure 48: Latin America 3D Scanners Market Value (US$ Mn), 2022-2030
Figure 49: Latin America 3D Scanners Market: Market Share Analysis by Component - 2022-2030
Figure 50: Latin America 3D Scanners Market: Y-o-Y Growth Comparison by Component, 2022-2030
Figure 51: Latin America 3D Scanners Market: Market Attractiveness by Component
Figure 52: Latin America 3D Scanners Market: Market Share Analysis by Type - 2022-2030
Figure 53: Latin America 3D Scanners Market: Y-o-Y Growth Comparison by Type, 2022-2030
Figure 54: Latin America 3D Scanners Market: Market Attractiveness by Type
Figure 55: Latin America 3D Scanners Market: Market Share Analysis by Range - 2022-2030
Figure 56: Latin America 3D Scanners Market: Y-o-Y Growth Comparison by Range, 2022-2030
Figure 57: Latin America 3D Scanners Market: Market Attractiveness by Range
Figure 58: Latin America 3D Scanners Market: Market Share Analysis by End-user - 2022-2030
Figure 59: Latin America 3D Scanners Market: Y-o-Y Growth Comparison by End-user, 2022-2030
Figure 60: Latin America 3D Scanners Market: Market Attractiveness by End-user
Figure 61: Latin America 3D Scanners Market: Market Share Analysis by Country - 2022-2030
Figure 62: Latin America 3D Scanners Market: Y-o-Y Growth Comparison by Country, 2022-2030
Figure 63: Brazil 3D Scanners Market Absolute $ Opportunity (US$ Mn), 2015 - 2030
Figure 64: Mexico 3D Scanners Market Absolute $ Opportunity (US$ Mn), 2015 - 2030
Figure 65: Rest of Latin America 3D Scanners Market Absolute $ Opportunity (US$ Mn), 2015 - 2030
Figure 66: Latin America 3D Scanners Market: Market Attractiveness by Country
Figure 67: Europe 3D Scanners Market Value (US$ Mn), 2015-2021
Figure 68: Europe 3D Scanners Market Value (US$ Mn), 2022-2030
Figure 69: Europe 3D Scanners Market: Market Share Analysis by Component - 2022-2030
Figure 70: Europe 3D Scanners Market: Y-o-Y Growth Comparison by Component, 2022-2030
Figure 71: Europe 3D Scanners Market: Market Attractiveness by Component
Figure 72: Europe 3D Scanners Market: Market Share Analysis by Type - 2022-2030
Figure 73: Europe 3D Scanners Market: Y-o-Y Growth Comparison by Type, 2022-2030
Figure 74: Europe 3D Scanners Market: Market Attractiveness by Type
Figure 75: Europe 3D Scanners Market: Market Share Analysis by Range - 2022-2030
Figure 76: Europe 3D Scanners Market: Y-o-Y Growth Comparison by Range, 2022-2030
Figure 77: Europe 3D Scanners Market: Market Attractiveness by Range
Figure 78: Europe 3D Scanners Market: Market Share Analysis by End-user - 2022-2030
Figure 79: Europe 3D Scanners Market: Y-o-Y Growth Comparison by End-user, 2022-2030
Figure 80: Europe 3D Scanners Market: Market Attractiveness by End-user
Figure 81: Europe 3D Scanners Market: Market Share Analysis by Country - 2022-2030
Figure 82: Europe 3D Scanners Market: Y-o-Y Growth Comparison by Country, 2022-2030
Figure 83: Germany 3D Scanners Market Absolute $ Opportunity (US$ Mn), 2015 - 2030
Figure 84: France 3D Scanners Market Absolute $ Opportunity (US$ Mn), 2015 - 2030
Figure 85: Italy 3D Scanners Market Absolute $ Opportunity (US$ Mn), 2015 - 2030
Figure 86: Spain 3D Scanners Market Absolute $ Opportunity (US$ Mn), 2015 - 2030
Figure 87: U.K.. 3D Scanners Market Absolute $ Opportunity (US$ Mn), 2015 - 2030
Figure 88: Benelux 3D Scanners Market Absolute $ Opportunity (US$ Mn), 2015 - 2030
Figure 89: Russia 3D Scanners Market Absolute $ Opportunity (US$ Mn), 2015 - 2030
Figure 90: Rest of Europe 3D Scanners Market Absolute $ Opportunity (US$ Mn), 2015 - 2030
Figure 91: Europe 3D Scanners Market: Market Attractiveness by Country
Figure 92: East Asia 3D Scanners Market Value (US$ Mn), 2015-2021
Figure 93: East Asia 3D Scanners Market Value (US$ Mn), 2022-2030
Figure 94: East Asia 3D Scanners Market: Market Share Analysis by Component - 2022-2030
Figure 95: East Asia 3D Scanners Market: Y-o-Y Growth Comparison by Component, 2022-2030
Figure 96: East Asia 3D Scanners Market: Market Attractiveness by Component
Figure 97: East Asia 3D Scanners Market: Market Share Analysis by Type - 2022-2030
Figure 98: East Asia 3D Scanners Market: Y-o-Y Growth Comparison by Type, 2022-2030
Figure 99: East Asia 3D Scanners Market: Market Attractiveness by Type
Figure 100: East Asia 3D Scanners Market: Market Share Analysis by Range - 2022-2030
Figure 101: East Asia 3D Scanners Market: Y-o-Y Growth Comparison by Range, 2022-2030
Figure 102: East Asia 3D Scanners Market: Market Attractiveness by Range
Figure 103: East Asia 3D Scanners Market: Market Share Analysis by End-user - 2022-2030
Figure 104: East Asia 3D Scanners Market: Y-o-Y Growth Comparison by End-user, 2022-2030
Figure 105: East Asia 3D Scanners Market: Market Attractiveness by End-user
Figure 106: East Asia 3D Scanners Market: Market Share Analysis by Country - 2022-2030
Figure 107: East Asia 3D Scanners Market: Y-o-Y Growth Comparison by Country, 2022-2030
Figure 108: China 3D Scanners Market Absolute $ Opportunity (US$ Mn), 2015 - 2030
Figure 109: Japan 3D Scanners Market Absolute $ Opportunity (US$ Mn), 2015 - 2030
Figure 110: South Korea 3D Scanners Market Absolute $ Opportunity (US$ Mn), 2015 - 2030
Figure 111: East Asia 3D Scanners Market: Market Attractiveness by Country
Figure 112: South Asia & Pacific 3D Scanners Market Value (US$ Mn), 2015-2021
Figure 113: South Asia & Pacific 3D Scanners Market Value (US$ Mn), 2022-2030
Figure 114: South Asia & Pacific 3D Scanners Market: Market Share Analysis by Component - 2022-2030
Figure 115: South Asia & Pacific 3D Scanners Market: Y-o-Y Growth Comparison by Component, 2022-2030
Figure 116: South Asia & Pacific 3D Scanners Market: Market Attractiveness by Component
Figure 117: South Asia & Pacific 3D Scanners Market: Market Share Analysis by Type - 2022-2030
Figure 118: South Asia & Pacific 3D Scanners Market: Y-o-Y Growth Comparison by Type, 2022-2030
Figure 119: South Asia & Pacific 3D Scanners Market: Market Attractiveness by Type
Figure 120: South Asia & Pacific 3D Scanners Market: Market Share Analysis by Range - 2022-2030
Figure 121: South Asia & Pacific 3D Scanners Market: Y-o-Y Growth Comparison by Range, 2022-2030
Figure 122: South Asia & Pacific 3D Scanners Market: Market Attractiveness by Range
Figure 123: South Asia & Pacific 3D Scanners Market: Market Share Analysis by End-user - 2022-2030
Figure 124: South Asia & Pacific 3D Scanners Market: Y-o-Y Growth Comparison by End-user, 2022-2030
Figure 125: South Asia & Pacific 3D Scanners Market: Market Attractiveness by End-user
Figure 126: South Asia & Pacific 3D Scanners Market: Market Share Analysis by Country - 2022-2030
Figure 127: South Asia & Pacific 3D Scanners Market: Y-o-Y Growth Comparison by Country, 2022-2030
Figure 128: India 3D Scanners Market Absolute $ Opportunity (US$ Mn), 2015 - 2030
Figure 129: Thailand 3D Scanners Market Absolute $ Opportunity (US$ Mn), 2015 - 2030
Figure 130: Malaysia 3D Scanners Market Absolute $ Opportunity (US$ Mn), 2015 - 2030
Figure 131: Indonesia 3D Scanners Market Absolute $ Opportunity (US$ Mn), 2015 - 2030
Figure 132: Australia & New Zealand. 3D Scanners Market Absolute $ Opportunity (US$ Mn), 2015 - 2030
Figure 133: Rest of South Asia & Pacific 3D Scanners Market Absolute $ Opportunity (US$ Mn), 2015 - 2030
Figure 134: South Asia & Pacific 3D Scanners Market: Market Attractiveness by Country
Figure 135: Middle East & Africa 3D Scanners Market Value (US$ Mn), 2015-2021
Figure 136: Middle East & Africa 3D Scanners Market Value (US$ Mn), 2022-2030
Figure 137: Middle East & Africa 3D Scanners Market: Market Share Analysis by Component - 2022-2030
Figure 138: Middle East & Africa 3D Scanners Market: Y-o-Y Growth Comparison by Component, 2022-2030
Figure 139: Middle East & Africa 3D Scanners Market: Market Attractiveness by Component
Figure 140: Middle East & Africa 3D Scanners Market: Market Share Analysis by Type - 2022-2030
Figure 141: Middle East & Africa 3D Scanners Market: Y-o-Y Growth Comparison by Type, 2022-2030
Figure 142: Middle East & Africa 3D Scanners Market: Market Attractiveness by Type
Figure 143: Middle East & Africa 3D Scanners Market: Market Share Analysis by Range - 2022-2030
Figure 144: Middle East & Africa 3D Scanners Market: Y-o-Y Growth Comparison by Range, 2022-2030
Figure 145: Middle East & Africa 3D Scanners Market: Market Attractiveness by Range
Figure 146: Middle East & Africa 3D Scanners Market: Market Share Analysis by End-user - 2022-2030
Figure 147: Middle East & Africa 3D Scanners Market: Y-o-Y Growth Comparison by End-user, 2022-2030
Figure 148: Middle East & Africa 3D Scanners Market: Market Attractiveness by End-user
Figure 149: Middle East & Africa 3D Scanners Market: Market Share Analysis by Region - 2022-2030
Figure 150: Middle East & Africa 3D Scanners Market: Y-o-Y Growth Comparison by Region, 2022-2030
Figure 151: GCC Countries 3D Scanners Market Absolute $ Opportunity (US$ Mn), 2015 - 2030
Figure 152: Turkey 3D Scanners Market Absolute $ Opportunity (US$ Mn), 2015 - 2030
Figure 153: South Africa 3D Scanners Market Absolute $ Opportunity (US$ Mn), 2015 - 2030
Figure 154: Rest of MEA 3D Scanners Market Absolute $ Opportunity (US$ Mn), 2015 - 2030
Figure 155: Middle East & Africa 3D Scanners Market: Market Attractiveness by Region
Figure 156: U.S. 3D Scanners Market Analysis
Figure 157: Canada 3D Scanners Market Analysis
Figure 158: Mexico 3D Scanners Market Analysis
Figure 159: Brazil 3D Scanners Market Analysis
Figure 160: Germany 3D Scanners Market Analysis
Figure 161: Italy 3D Scanners Market Analysis
Figure 162: France 3D Scanners Market Analysis
Figure 163: U.K. 3D Scanners Market Analysis
Figure 164: Spain 3D Scanners Market Analysis
Figure 165: BENELUX 3D Scanners Market Analysis
Figure 166: Russia 3D Scanners Market Analysis
Figure 167: China 3D Scanners Market Analysis
Figure 168: Japan 3D Scanners Market Analysis
Figure 169: South Korea 3D Scanners Market Analysis
Figure 170: India 3D Scanners Market Analysis
Figure 171: Thailand 3D Scanners Market Analysis
Figure 172: Malaysia 3D Scanners Market Analysis
Figure 173: Indonesia 3D Scanners Market Analysis
Figure 174: Australia and New Zealand 3D Scanners Market Analysis
Figure 175: GCC Countries 3D Scanners Market Analysis
Figure 176: Turkey 3D Scanners Market Analysis
Figure 177: South Africa 3D Scanners Market Analysis
Need specific information?
Request CustomizationExplore Technology Insights
View Reports