3D Sensor Market
Market Insights on 3D Sensor covering sales outlook, demand forecast & up-to-date key trends
3D Sensor Market by Form, Application & Region - Forecast 2022 - 2032
3D Sensor Market Overview (2022-2032)
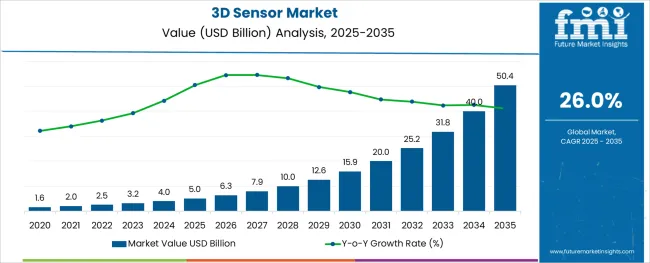
[250 Pages Report] Demand in the global 3D sensor market is anticipated to total US$ 2.5 Billion in 2022. The overall market is forecast to grow at a prolific CAGR of over 26.0% to reach around US$ 9.0 Billion by 2032. The rising adoption of 3D sensors across various industries such as automotive and media & entertainment is expected to drive the market.
Report Attribute |
Details |
Estimated Base Year Value (2021) |
US$ 2.1 Billion |
Expected Market Value (2022) |
US$ 2.5 Billion |
Anticipated Forecast Value (2032) |
US$ 9.0 Billion |
Projected Growth Rate (2022-2032) |
26.0% CAGR |
3D sensing technology has emerged as one of the major breakthrough inventions that completely revolutionized the electronics and automotive industries. It is a depth-sensing technology that facilitates camera capabilities for facial and object recognition. 3D sensing is achieved through devices called 3D sensors.
3D sensors are devices which respond to external environment in 3-dimension by creating 3D maps of user's surroundings or environment. They are being extensively used in electronic products for capturing a real-world object's length, width, and height with more clarity and in-depth detail. Increasing adoption of 3D sensors in a multitude of applications such as consumer electronics, healthcare, industrial robots and automotive is the major force driving the 3D sensor market.
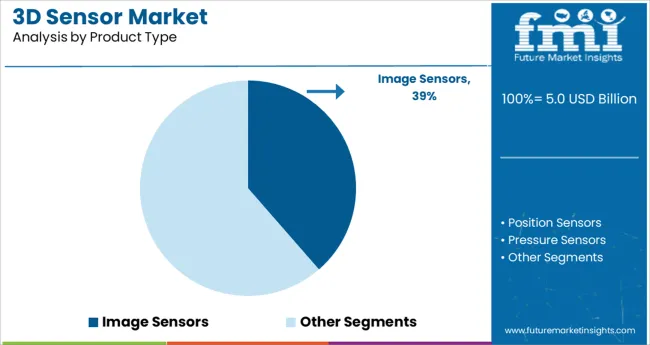
Various types of 3D sensors are available in the market for monitoring and detection purposes. However, 3D image sensors remain the top most selling product in the global 3D sensor market. These sensors are being mostly used in automotive, consumer goods, defence and media & entertainment industries.
The rapid technological advancements in gesture recognition, indoor navigation and 3D motion detection is transforming the 3D sensor market. Companies are gradually employing 3D sensors for gesture recognition in user interface.
Adoption of 3D sensors in modern smartphones is becoming a new trend for improving the camera quality. Rising demand for these smartphones will directly push the sales of 3D sensors during the forecast period.
Which are Some Prominent Drivers Spearheading 3D Sensor Market Growth?
Rapid growth of consumer electronics industry, growing popularity of 3D sensors in the automotive sector, innovations in sensing technology and rising need for better security & surveillance are some of the major factors driving the 3D senor market.
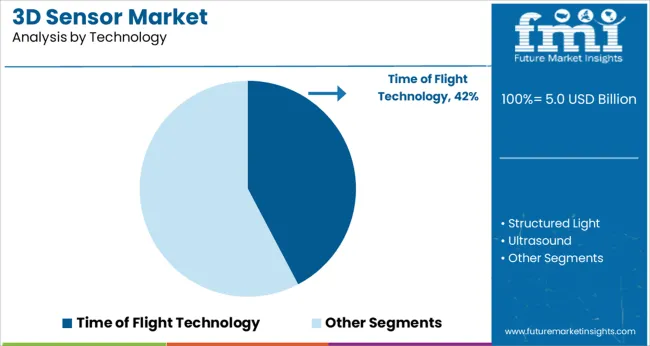
During the last few years, 3D sensors have gained immense traction on account of their ability to detect the size, shape, and distance of objects within their field of vision. They use technologies like structured light, ultrasound, stereo vision, time of flight technology to recognize the objects in the space and provide accurate data.
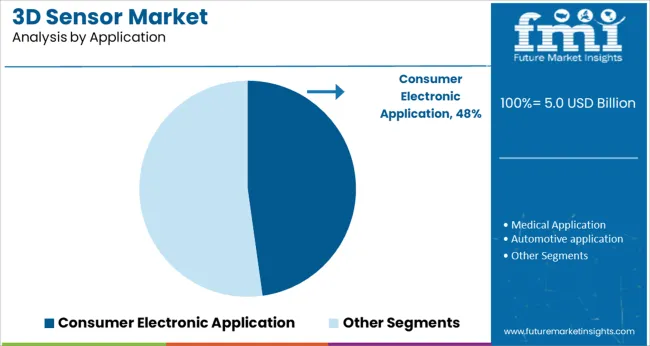
3D sensors find their application in various modern day electronic products ranging from cameras, smartphones, and drones to robots. Rising production and sales of these consumer electronic products is set to boost the growth of 3D sensors market in the future.
Growing popularity of autonomous cars coupled with increasing prevalence of automotive accidents is creating growth avenues within the 3D sensor market. These sensors have become essential components for increasing the safety of both drivers and passengers by detecting the people and objects in the vicinity of the car.
Products like 3D image sensors are being integrated in advanced driver assistance systems (ADAS) to provide parking assistance, collision avoidance and lane departing warning.
Subsequently, the advent of virtual reality and augmented reality in the gaming sector is proving a major thrust to the growth of 3D sensor market. These sensors are used to control games and entertainment devices by mere gesture.
In addition to this, growing adoption of 3D sensors in medical imaging solutions and surveillance cameras will further accelerate the growth of 3D sensor market over the assessment period.
Let us know your requirement to get
100% FREE customization
What are the Challenges Faced by the 3D Sensor Industry?
Despite increasing penetration of 3D sensors, there are numerous obstacles likely to pose a challenge to market growth.
Factors such as high maintenance costs, lack of manufacturing excellence and limited integration with some devices are emerging as major impediments for the growth of 3D sensor market. 3D sensors are usually expensive. As a result, many electronics manufacturers refrain from integrating them (3D sensors) into cheaper electronic products.
Why is Asia-Pacific Excluding Japan (APEJ) Emerging as an Opportunistic 3D sensor Market?
As per Future Market Insights, Asia pacific Excluding Japan (APEJ) is projected to emerge as the fastest growing market for 3D sensors during the forecast period. Rapid expansion of consumer electronics and automotive industries, growing popularity of 3D sensing technologies in safety and surveillance applications and heavy presence of leading market players are some of the factors boosting the sales of 3D sensors across APEJ region.
Countries such as China and South Korea are becoming hub of consumer electronic products in the world. These countries export a huge volume of consumer electronic products including smartphones and cameras to different regions of the world. This rise in production and sales of consumer electronics is emerging as a key factor fostering the growth of 3D sensors market.
Major companies based in APEJ like Samsung (South Korea), Oppo (China), Xiaomi (China) etc. are continuously integrating 3D sensors in their smartphones to enhance the performance and quality of cameras.
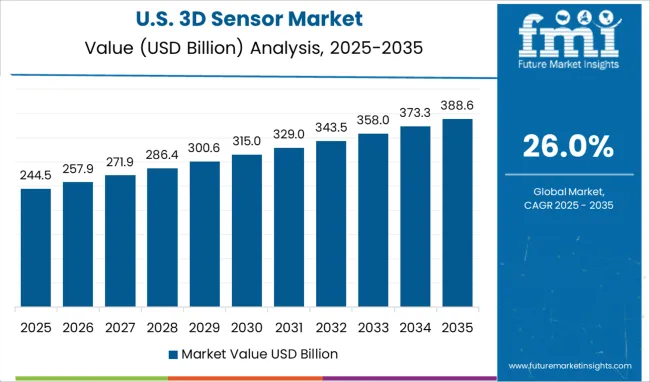
How is North America Contributing to Growth of the 3D sensor Market?
Currently North America dominates the 3D sensor market and the trend is likely to continue in the future, owing to the growing demand for 3D sensors from consumer electronics and automotive sectors.
Countries such as the United States are witnessing high demand for medical imaging solutions, smartphones and autonomous vehicles. Rising sales of these products is anticipated to ignite the sales of 3D sensors during the forecast period.
3D sensors have become essential components in consumer electronics for the measurement of objects or scenes in 3 dimensions. These sensors are being used in diverse products ranging from security cameras, self-driving vehicles, mobiles etc. Furthermore, increasing usage of 3D sensors in drones and robots is expected to trigger the growth of 3D sensor market in the North American region.
Majority of the manufacturing industries in the region are using 3D sensors to detect faults in the shape and sizes of the produced products. Expansion of these manufacturing industries will further create growth prospects for 3D sensor market in the region.
Find your sweet spots for generating winning opportunities in this market.
Talk to AnalystMarket Competition
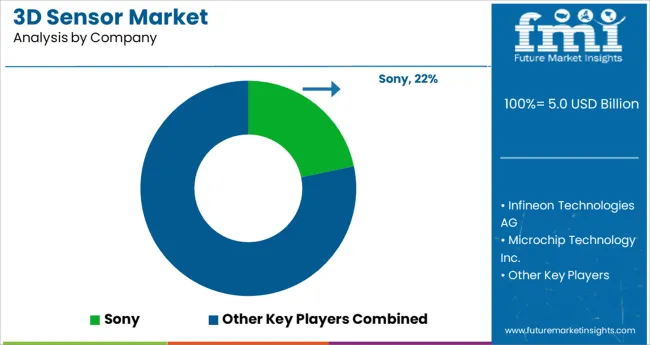
Some of the key participants present in the global 3D sensor market include Infineon Technologies AG, Cognex Corporation, LMI Technologies Inc., SOFTIKINETIC, Optima S.A., ifm Efector, Inc., Occipital, Inc., ASUSTeK Computer Inc. and Panasonic Corporation among others.
The global 3D sensors market is highly competitive in nature with leading market players constantly upgrading their product portfolios. They are aiming at developing innovative solutions that can even penetrate through sold obstacles like walls.
Scope Of Report
Report Attribute |
Details |
Growth Rate |
CAGR of 26.0% from 2022 to 2032 |
Base Year for Estimation |
2021 |
Historical Data |
2015-2020 |
Forecast Period |
2022-2032 |
Quantitative Units |
Revenue in USD Million, Volume in Kilotons and CAGR from 2022-2032 |
Report Coverage |
Revenue Forecast, Volume Forecast, Company Ranking, Competitive Landscape, Growth Factors, Trends and Pricing Analysis |
Segments Covered |
|
Regions Covered |
|
Key Countries Profiled |
|
Key Companies Profiled |
|
Customization |
Available Upon Request |

An unified Market Research Subscription Platform, built for today’s disparate research needs.
Key Segments Profiled in the 3D Sensor Industry Survey
Product Type:
- Position Sensors
- Pressure Sensors
- Image Sensors
CMOS 3D Image Sensors
3D Electro Optical Image Sensors
3D Time of Flight Image Sensors
- Temperature Sensors
- Others
Technology:
- Structured Light
- Ultrasound
- Stereo Vision
- Time of Flight Technology
Application:
- Consumer Electronic Application
- Medical Application
- Automotive application
- Industrial Application
- Media & Entertainment Application
- Aerospace & Defence Application
- Others
Region:
- North America
- Latin America
- Western Europe
- Eastern Europe
- APEJ
- Japan
- Middle East & Africa
Frequently Asked Questions
FMI projects the global 3D sensor market to expand at a 26.0% value CAGR by 2032
Asia Pacific Excluding Japan (APEJ) is forecast to grow at the fastest CAGR over the forecast period.
Infineon Technologies AG, Cognex Corporation, LMI Technologies Inc., SOFTIKINETIC, Optima S.A., ifm Efector, Inc., Occipital, Inc., ASUSTeK Computer Inc. and Panasonic Corporation are some prominent 3D sensor manufacturers
1. Executive Summary
1.1. Global Market Outlook
1.2. Demand-side Trends
1.3. Supply-side Trends
1.4. Technology Roadmap Analysis
1.5. Analysis and Recommendations
2. Market Overview
2.1. Market Coverage / Taxonomy
2.2. Market Definition / Scope / Limitations
3. Market Background
3.1. Market Dynamics
3.1.1. Drivers
3.1.2. Restraints
3.1.3. Opportunity
3.1.4. Trends
3.2. Scenario Forecast
3.2.1. Demand in Optimistic Scenario
3.2.2. Demand in Likely Scenario
3.2.3. Demand in Conservative Scenario
3.3. Opportunity Map Analysis
3.4. Investment Feasibility Matrix
3.5. Value Chain Analysis
3.5.1. Profit Margin Analysis
3.5.2. Service Providers
3.6. PESTLE and Porter’s Analysis
3.7. Regulatory Landscape
3.7.1. By Key Regions
3.7.2. By Key Countries
3.8. Regional Parent Market Outlook
4. Global 3D Sensor Market Analysis 2017-2021 and Forecast, 2022-2032
4.1. Historical Market Size Value (US$ Mn) Analysis, 2017-2021
4.2. Current and Future Market Size Value (US$ Mn) Projections, 2022-2032
4.2.1. Y-o-Y Growth Trend Analysis
4.2.2. Absolute $ Opportunity Analysis
5. Global 3D Sensor Market Analysis 2017-2021 and Forecast 2022-2032, By Sensor Type
5.1. Introduction / Key Findings
5.2. Historical Market Size Value (US$ Mn) Analysis By Sensor Type, 2017-2021
5.3. Current and Future Market Size Value (US$ Mn) Analysis and Forecast By Sensor Type, 2022-2032
5.3.1. Image Sensor
5.3.2. Position Sensors
5.3.3. Acoustic Sensors
5.3.4. Accelerometer Sensors
5.3.5. Others
5.4. Y-o-Y Growth Trend Analysis By Sensor Type, 2017-2021
5.5. Absolute $ Opportunity Analysis By Sensor Type, 2022-2032
Deep-dive segmentation will be available in the sample on request
6. Global 3D Sensor Market Analysis 2017-2021 and Forecast 2022-2032, By Technology
6.1. Introduction / Key Findings
6.2. Historical Market Size Value (US$ Mn) Analysis By Technology, 2017-2021
6.3. Current and Future Market Size Value (US$ Mn) Analysis and Forecast By Technology, 2022-2032
6.3.1. Stereo Vision
6.3.2. Structured Light
6.3.3. Time-of-Flight (ToF)
6.3.4. Ultrasound
6.4. Y-o-Y Growth Trend Analysis By Technology, 2017-2021
6.5. Absolute $ Opportunity Analysis By Technology, 2022-2032
Deep-dive segmentation will be available in the sample on request
7. Global 3D Sensor Market Analysis 2017-2021 and Forecast 2022-2032, By Industry Application
7.1. Introduction / Key Findings
7.2. Historical Market Size Value (US$ Mn) Analysis By Industry Application , 2017-2021
7.3. Current and Future Market Size Value (US$ Mn) Analysis and Forecast By Industry Application , 2022-2032
7.3.1. Consumer Electronics
7.3.2. Healthcare
7.3.3. Aerospace and Defense
7.3.4. Automotive
7.3.5. Entertainment
7.3.6. Security and Surveillance
7.3.7. Industrial Robotics
7.3.8. Others
7.4. Y-o-Y Growth Trend Analysis By Industry Application , 2017-2021
7.5. Absolute $ Opportunity Analysis By Industry Application , 2022-2032
Deep-dive segmentation will be available in the sample on request
8. Global 3D Sensor Market Analysis 2017-2021 and Forecast 2022-2032, By Profile Type
8.1. Introduction / Key Findings
8.2. Historical Market Size Value (US$ Mn) Analysis By Profile Type, 2017-2021
8.3. Current and Future Market Size Value (US$ Mn) Analysis and Forecast By Profile Type, 2022-2032
8.3.1. Single Point Profile
8.3.2. Multi-point Profile
8.3.3. Line Profile
8.3.4. Snapshot
8.4. Y-o-Y Growth Trend Analysis By Profile Type, 2017-2021
8.5. Absolute $ Opportunity Analysis By Profile Type, 2022-2032
Deep-dive segmentation will be available in the sample on request
9. Global 3D Sensor Market Analysis 2017-2021 and Forecast 2022-2032, By Region
9.1. Introduction
9.2. Historical Market Size Value (US$ Mn) Analysis By Region, 2017-2021
9.3. Current Market Size Value (US$ Mn) Analysis and Forecast By Region, 2022-2032
9.3.1. North America
9.3.2. Latin America
9.3.3. Europe
9.3.4. East Asia
9.3.5. South Asia & Pacific
9.3.6. MEA
9.4. Market Attractiveness Analysis By Region
10. North America 3D Sensor Market Analysis 2017-2021 and Forecast 2022-2032, By Country
10.1. Historical Market Size Value (US$ Mn) Trend Analysis By Market Taxonomy, 2017-2021
10.2. Market Size Value (US$ Mn) Forecast By Market Taxonomy, 2022-2032
10.2.1. By Country
10.2.1.1. U.S.
10.2.1.2. Canada
10.2.2. By Sensor Type
10.2.3. By Technology
10.2.4. By Industry Application
10.2.5. By Profile Type
10.3. Market Attractiveness Analysis
10.3.1. By Country
10.3.2. By Sensor Type
10.3.3. By Technology
10.3.4. By Industry Application
10.3.5. By Profile Type
10.4. Key Takeaways
11. Latin America 3D Sensor Market Analysis 2017-2021 and Forecast 2022-2032, By Country
11.1. Historical Market Size Value (US$ Mn) Trend Analysis By Market Taxonomy, 2017-2021
11.2. Market Size Value (US$ Mn) Forecast By Market Taxonomy, 2022-2032
11.2.1. By Country
11.2.1.1. Mexico
11.2.1.2. Brazil
11.2.1.3. Rest of Latin America
11.2.2. By Sensor Type
11.2.3. By Technology
11.2.4. By Industry Application
11.2.5. By Profile Type
11.3. Market Attractiveness Analysis
11.3.1. By Country
11.3.2. By Sensor Type
11.3.3. By Technology
11.3.4. By Industry Application
11.3.5. By Profile Type
11.4. Key Takeaways
12. Europe 3D Sensor Market Analysis 2017-2021 and Forecast 2022-2032, By Country
12.1. Historical Market Size Value (US$ Mn) Trend Analysis By Market Taxonomy, 2017-2021
12.2. Market Size Value (US$ Mn) Forecast By Market Taxonomy, 2022-2032
12.2.1. By Country
12.2.1.1. Germany
12.2.1.2. Italy
12.2.1.3. France
12.2.1.4. U.K.
12.2.1.5. Spain
12.2.1.6. BENELUX
12.2.1.7. Russia
12.2.1.8. Rest of Europe
12.2.2. By Sensor Type
12.2.3. By Technology
12.2.4. By Industry Application
12.2.5. By Profile Type
12.3. Market Attractiveness Analysis
12.3.1. By Country
12.3.2. By Sensor Type
12.3.3. By Technology
12.3.4. By Industry Application
12.3.5. By Profile Type
12.4. Key Takeaways
13. East Asia 3D Sensor Market Analysis 2017-2021 and Forecast 2022-2032, By Country
13.1. Historical Market Size Value (US$ Mn) Trend Analysis By Market Taxonomy, 2017-2021
13.2. Market Size Value (US$ Mn) Forecast By Market Taxonomy, 2022-2032
13.2.1. By Country
13.2.1.1. China
13.2.1.2. Japan
13.2.1.3. South Korea
13.2.2. By Sensor Type
13.2.3. By Technology
13.2.4. By Industry Application
13.2.5. By Profile Type
13.3. Market Attractiveness Analysis
13.3.1. By Country
13.3.2. By Sensor Type
13.3.3. By Technology
13.3.4. By Industry Application
13.3.5. By Profile Type
13.4. Key Takeaways
14. South Asia & Pacific 3D Sensor Market Analysis 2017-2021 and Forecast 2022-2032, By Country
14.1. Historical Market Size Value (US$ Mn) Trend Analysis By Market Taxonomy, 2017-2021
14.2. Market Size Value (US$ Mn) Forecast By Market Taxonomy, 2022-2032
14.2.1. By Country
14.2.1.1. India
14.2.1.2. ASEAN
14.2.1.3. Australia and New Zealand
14.2.1.4. Rest of South Asia & Pacific
14.2.2. By Sensor Type
14.2.3. By Technology
14.2.4. By Industry Application
14.2.5. By Profile Type
14.3. Market Attractiveness Analysis
14.3.1. By Country
14.3.2. By Sensor Type
14.3.3. By Technology
14.3.4. By Industry Application
14.3.5. By Profile Type
14.4. Key Takeaways
15. MEA 3D Sensor Market Analysis 2017-2021 and Forecast 2022-2032, By Country
15.1. Historical Market Size Value (US$ Mn) Trend Analysis By Market Taxonomy, 2017-2021
15.2. Market Size Value (US$ Mn) Forecast By Market Taxonomy, 2022-2032
15.2.1. By Country
15.2.1.1. GCC Countries
15.2.1.2. Turkey
15.2.1.3. South Africa
15.2.1.4. Rest of MEA
15.2.2. By Sensor Type
15.2.3. By Technology
15.2.4. By Industry Application
15.2.5. By Profile Type
15.3. Market Attractiveness Analysis
15.3.1. By Country
15.3.2. By Sensor Type
15.3.3. By Technology
15.3.4. By Industry Application
15.3.5. By Profile Type
15.4. Key Takeaways
16. Key Countries 3D Sensor Market Analysis
16.1. U.S.
16.1.1. Pricing Analysis
16.1.2. Market Share Analysis, 2021
16.1.2.1. By Sensor Type
16.1.2.2. By Technology
16.1.2.3. By Industry Application
16.1.2.4. By Profile Type
16.2. Canada
16.2.1. Pricing Analysis
16.2.2. Market Share Analysis, 2021
16.2.2.1. By Sensor Type
16.2.2.2. By Technology
16.2.2.3. By Industry Application
16.2.2.4. By Profile Type
16.3. Mexico
16.3.1. Pricing Analysis
16.3.2. Market Share Analysis, 2021
16.3.2.1. By Sensor Type
16.3.2.2. By Technology
16.3.2.3. By Industry Application
16.3.2.4. By Profile Type
16.4. Brazil
16.4.1. Pricing Analysis
16.4.2. Market Share Analysis, 2021
16.4.2.1. By Sensor Type
16.4.2.2. By Technology
16.4.2.3. By Industry Application
16.4.2.4. By Profile Type
16.5. Germany
16.5.1. Pricing Analysis
16.5.2. Market Share Analysis, 2021
16.5.2.1. By Sensor Type
16.5.2.2. By Technology
16.5.2.3. By Industry Application
16.5.2.4. By Profile Type
16.6. Italy
16.6.1. Pricing Analysis
16.6.2. Market Share Analysis, 2021
16.6.2.1. By Sensor Type
16.6.2.2. By Technology
16.6.2.3. By Industry Application
16.6.2.4. By Profile Type
16.7. France
16.7.1. Pricing Analysis
16.7.2. Market Share Analysis, 2021
16.7.2.1. By Sensor Type
16.7.2.2. By Technology
16.7.2.3. By Industry Application
16.7.2.4. By Profile Type
16.8. U.K.
16.8.1. Pricing Analysis
16.8.2. Market Share Analysis, 2021
16.8.2.1. By Sensor Type
16.8.2.2. By Technology
16.8.2.3. By Industry Application
16.8.2.4. By Profile Type
16.9. Spain
16.9.1. Pricing Analysis
16.9.2. Market Share Analysis, 2021
16.9.2.1. By Sensor Type
16.9.2.2. By Technology
16.9.2.3. By Industry Application
16.9.2.4. By Profile Type
16.10. BENELUX
16.10.1. Pricing Analysis
16.10.2. Market Share Analysis, 2021
16.10.2.1. By Sensor Type
16.10.2.2. By Technology
16.10.2.3. By Industry Application
16.10.2.4. By Profile Type
16.11. Russia
16.11.1. Pricing Analysis
16.11.2. Market Share Analysis, 2021
16.11.2.1. By Sensor Type
16.11.2.2. By Technology
16.11.2.3. By Industry Application
16.11.2.4. By Profile Type
16.12. China
16.12.1. Pricing Analysis
16.12.2. Market Share Analysis, 2021
16.12.2.1. By Sensor Type
16.12.2.2. By Technology
16.12.2.3. By Industry Application
16.12.2.4. By Profile Type
16.13. Japan
16.13.1. Pricing Analysis
16.13.2. Market Share Analysis, 2021
16.13.2.1. By Sensor Type
16.13.2.2. By Technology
16.13.2.3. By Industry Application
16.13.2.4. By Profile Type
16.14. South Korea
16.14.1. Pricing Analysis
16.14.2. Market Share Analysis, 2021
16.14.2.1. By Sensor Type
16.14.2.2. By Technology
16.14.2.3. By Industry Application
16.14.2.4. By Profile Type
16.15. India
16.15.1. Pricing Analysis
16.15.2. Market Share Analysis, 2021
16.15.2.1. By Sensor Type
16.15.2.2. By Technology
16.15.2.3. By Industry Application
16.15.2.4. By Profile Type
16.16. ASEAN
16.16.1. Pricing Analysis
16.16.2. Market Share Analysis, 2021
16.16.2.1. By Sensor Type
16.16.2.2. By Technology
16.16.2.3. By Industry Application
16.16.2.4. By Profile Type
16.17. Australia and New Zealand
16.17.1. Pricing Analysis
16.17.2. Market Share Analysis, 2021
16.17.2.1. By Sensor Type
16.17.2.2. By Technology
16.17.2.3. By Industry Application
16.17.2.4. By Profile Type
16.18. GCC Countries
16.18.1. Pricing Analysis
16.18.2. Market Share Analysis, 2021
16.18.2.1. By Sensor Type
16.18.2.2. By Technology
16.18.2.3. By Industry Application
16.18.2.4. By Profile Type
16.19. Turkey
16.19.1. Pricing Analysis
16.19.2. Market Share Analysis, 2021
16.19.2.1. By Sensor Type
16.19.2.2. By Technology
16.19.2.3. By Industry Application
16.19.2.4. By Profile Type
16.20. South Africa
16.20.1. Pricing Analysis
16.20.2. Market Share Analysis, 2021
16.20.2.1. By Sensor Type
16.20.2.2. By Technology
16.20.2.3. By Industry Application
16.20.2.4. By Profile Type
17. Market Structure Analysis
17.1. Competition Dashboard
17.2. Competition Benchmarking
17.3. Market Share Analysis of Top Players
17.3.1. By Regional
17.3.2. By Sensor Type
17.3.3. By Technology
17.3.4. By Industry Application
17.3.5. By Profile Type
18. Competition Analysis
18.1. Competition Deep Dive
18.1.1. Infineon Technologies AG
18.1.1.1. Overview
18.1.1.2. Product Portfolio
18.1.1.3. Profitability by Market Segments
18.1.1.4. Sales Footprint
18.1.1.5. Strategy Overview
18.1.1.5.1. Marketing Strategy
18.1.1.5.2. Product Strategy
18.1.1.5.3. Channel Strategy
18.1.2. Microchip Technology Inc.
18.1.2.1. Overview
18.1.2.2. Product Portfolio
18.1.2.3. Profitability by Market Segments
18.1.2.4. Sales Footprint
18.1.2.5. Strategy Overview
18.1.2.5.1. Marketing Strategy
18.1.2.5.2. Product Strategy
18.1.2.5.3. Channel Strategy
18.1.3. Omnivision Technologies, Inc.
18.1.3.1. Overview
18.1.3.2. Product Portfolio
18.1.3.3. Profitability by Market Segments
18.1.3.4. Sales Footprint
18.1.3.5. Strategy Overview
18.1.3.5.1. Marketing Strategy
18.1.3.5.2. Product Strategy
18.1.3.5.3. Channel Strategy
18.1.4. PMD Technologies AG
18.1.4.1. Overview
18.1.4.2. Product Portfolio
18.1.4.3. Profitability by Market Segments
18.1.4.4. Sales Footprint
18.1.4.5. Strategy Overview
18.1.4.5.1. Marketing Strategy
18.1.4.5.2. Product Strategy
18.1.4.5.3. Channel Strategy
18.1.5. Sony
18.1.5.1. Overview
18.1.5.2. Product Portfolio
18.1.5.3. Profitability by Market Segments
18.1.5.4. Sales Footprint
18.1.5.5. Strategy Overview
18.1.5.5.1. Marketing Strategy
18.1.5.5.2. Product Strategy
18.1.5.5.3. Channel Strategy
18.1.6. Asustek Computer Inc.
18.1.6.1. Overview
18.1.6.2. Product Portfolio
18.1.6.3. Profitability by Market Segments
18.1.6.4. Sales Footprint
18.1.6.5. Strategy Overview
18.1.6.5.1. Marketing Strategy
18.1.6.5.2. Product Strategy
18.1.6.5.3. Channel Strategy
18.1.7. Cognex Corporation
18.1.7.1. Overview
18.1.7.2. Product Portfolio
18.1.7.3. Profitability by Market Segments
18.1.7.4. Sales Footprint
18.1.7.5. Strategy Overview
18.1.7.5.1. Marketing Strategy
18.1.7.5.2. Product Strategy
18.1.7.5.3. Channel Strategy
18.1.8. Ifm Electronic GmbH
18.1.8.1. Overview
18.1.8.2. Product Portfolio
18.1.8.3. Profitability by Market Segments
18.1.8.4. Sales Footprint
18.1.8.5. Strategy Overview
18.1.8.5.1. Marketing Strategy
18.1.8.5.2. Product Strategy
18.1.8.5.3. Channel Strategy
18.1.9. Intel Corporation
18.1.9.1. Overview
18.1.9.2. Product Portfolio
18.1.9.3. Profitability by Market Segments
18.1.9.4. Sales Footprint
18.1.9.5. Strategy Overview
18.1.9.5.1. Marketing Strategy
18.1.9.5.2. Product Strategy
18.1.9.5.3. Channel Strategy
18.1.10. LMI Technologies, Inc.
18.1.10.1. Overview
18.1.10.2. Product Portfolio
18.1.10.3. Profitability by Market Segments
18.1.10.4. Sales Footprint
18.1.10.5. Strategy Overview
18.1.10.5.1. Marketing Strategy
18.1.10.5.2. Product Strategy
18.1.10.5.3. Channel Strategy
18.1.11. Microsoft Corporation
18.1.11.1. Overview
18.1.11.2. Product Portfolio
18.1.11.3. Profitability by Market Segments
18.1.11.4. Sales Footprint
18.1.11.5. Strategy Overview
18.1.11.5.1. Marketing Strategy
18.1.11.5.2. Product Strategy
18.1.11.5.3. Channel Strategy
18.1.12. Occipital, Inc.
18.1.12.1. Overview
18.1.12.2. Product Portfolio
18.1.12.3. Profitability by Market Segments
18.1.12.4. Sales Footprint
18.1.12.5. Strategy Overview
18.1.12.5.1. Marketing Strategy
18.1.12.5.2. Product Strategy
18.1.12.5.3. Channel Strategy
18.1.13. Qualcomm Inc
18.1.13.1. Overview
18.1.13.2. Product Portfolio
18.1.13.3. Profitability by Market Segments
18.1.13.4. Sales Footprint
18.1.13.5. Strategy Overview
18.1.13.5.1. Marketing Strategy
18.1.13.5.2. Product Strategy
18.1.13.5.3. Channel Strategy
18.1.14. PrimeSense
18.1.14.1. Overview
18.1.14.2. Product Portfolio
18.1.14.3. Profitability by Market Segments
18.1.14.4. Sales Footprint
18.1.14.5. Strategy Overview
18.1.14.5.1. Marketing Strategy
18.1.14.5.2. Product Strategy
18.1.14.5.3. Channel Strategy
18.1.15. Cognivue
18.1.15.1. Overview
18.1.15.2. Product Portfolio
18.1.15.3. Profitability by Market Segments
18.1.15.4. Sales Footprint
18.1.15.5. Strategy Overview
18.1.15.5.1. Marketing Strategy
18.1.15.5.2. Product Strategy
18.1.15.5.3. Channel Strategy
18.1.16. Cisco
18.1.16.1. Overview
18.1.16.2. Product Portfolio
18.1.16.3. Profitability by Market Segments
18.1.16.4. Sales Footprint
18.1.16.5. Strategy Overview
18.1.16.5.1. Marketing Strategy
18.1.16.5.2. Product Strategy
18.1.16.5.3. Channel Strategy
18.1.17. Panasonic Corporation
18.1.17.1. Overview
18.1.17.2. Product Portfolio
18.1.17.3. Profitability by Market Segments
18.1.17.4. Sales Footprint
18.1.17.5. Strategy Overview
18.1.17.5.1. Marketing Strategy
18.1.17.5.2. Product Strategy
18.1.17.5.3. Channel Strategy
18.1.18. Vayyar Imaging Ltd.
18.1.18.1. Overview
18.1.18.2. Product Portfolio
18.1.18.3. Profitability by Market Segments
18.1.18.4. Sales Footprint
18.1.18.5. Strategy Overview
18.1.18.5.1. Marketing Strategy
18.1.18.5.2. Product Strategy
18.1.18.5.3. Channel Strategy
19. Assumptions & Acronyms Used
20. Research Methodology
Let us know your requirement to get
100% FREE customization
Table 1: Global 3D Sensor Market Value (US$ Mn) Forecast by Region, 2017-2032
Table 2: Global 3D Sensor Market Value (US$ Mn) Forecast by Sensor Type, 2017-2032
Table 3: Global 3D Sensor Market Value (US$ Mn) Forecast by Technology, 2017-2032
Table 4: Global 3D Sensor Market Value (US$ Mn) Forecast by Industry Application, 2017-2032
Table 5: Global 3D Sensor Market Value (US$ Mn) Forecast by Profile Type, 2017-2032
Table 6: North America 3D Sensor Market Value (US$ Mn) Forecast by Country, 2017-2032
Table 7: North America 3D Sensor Market Value (US$ Mn) Forecast by Sensor Type, 2017-2032
Table 8: North America 3D Sensor Market Value (US$ Mn) Forecast by Technology, 2017-2032
Table 9: North America 3D Sensor Market Value (US$ Mn) Forecast by Industry Application, 2017-2032
Table 10: North America 3D Sensor Market Value (US$ Mn) Forecast by Profile Type, 2017-2032
Table 11: Latin America 3D Sensor Market Value (US$ Mn) Forecast by Country, 2017-2032
Table 12: Latin America 3D Sensor Market Value (US$ Mn) Forecast by Sensor Type, 2017-2032
Table 13: Latin America 3D Sensor Market Value (US$ Mn) Forecast by Technology, 2017-2032
Table 14: Latin America 3D Sensor Market Value (US$ Mn) Forecast by Industry Application, 2017-2032
Table 15: Latin America 3D Sensor Market Value (US$ Mn) Forecast by Profile Type, 2017-2032
Table 16: Europe 3D Sensor Market Value (US$ Mn) Forecast by Country, 2017-2032
Table 17: Europe 3D Sensor Market Value (US$ Mn) Forecast by Sensor Type, 2017-2032
Table 18: Europe 3D Sensor Market Value (US$ Mn) Forecast by Technology, 2017-2032
Table 19: Europe 3D Sensor Market Value (US$ Mn) Forecast by Industry Application, 2017-2032
Table 20: Europe 3D Sensor Market Value (US$ Mn) Forecast by Profile Type, 2017-2032
Table 21: East Asia 3D Sensor Market Value (US$ Mn) Forecast by Country, 2017-2032
Table 22: East Asia 3D Sensor Market Value (US$ Mn) Forecast by Sensor Type, 2017-2032
Table 23: East Asia 3D Sensor Market Value (US$ Mn) Forecast by Technology, 2017-2032
Table 24: East Asia 3D Sensor Market Value (US$ Mn) Forecast by Industry Application, 2017-2032
Table 25: East Asia 3D Sensor Market Value (US$ Mn) Forecast by Profile Type, 2017-2032
Table 26: South Asia & Pacific 3D Sensor Market Value (US$ Mn) Forecast by Country, 2017-2032
Table 27: South Asia & Pacific 3D Sensor Market Value (US$ Mn) Forecast by Sensor Type, 2017-2032
Table 28: South Asia & Pacific 3D Sensor Market Value (US$ Mn) Forecast by Technology, 2017-2032
Table 29: South Asia & Pacific 3D Sensor Market Value (US$ Mn) Forecast by Industry Application, 2017-2032
Table 30: South Asia & Pacific 3D Sensor Market Value (US$ Mn) Forecast by Profile Type, 2017-2032
Table 31: MEA 3D Sensor Market Value (US$ Mn) Forecast by Country, 2017-2032
Table 32: MEA 3D Sensor Market Value (US$ Mn) Forecast by Sensor Type, 2017-2032
Table 33: MEA 3D Sensor Market Value (US$ Mn) Forecast by Technology, 2017-2032
Table 34: MEA 3D Sensor Market Value (US$ Mn) Forecast by Industry Application, 2017-2032
Table 35: MEA 3D Sensor Market Value (US$ Mn) Forecast by Profile Type, 2017-2032
Find your sweet spots for generating winning opportunities in this market.
Talk to AnalystFigure 1: Global 3D Sensor Market Value (US$ Mn) by Sensor Type, 2022-2032
Figure 2: Global 3D Sensor Market Value (US$ Mn) by Technology, 2022-2032
Figure 3: Global 3D Sensor Market Value (US$ Mn) by Industry Application, 2022-2032
Figure 4: Global 3D Sensor Market Value (US$ Mn) by Profile Type, 2022-2032
Figure 5: Global 3D Sensor Market Value (US$ Mn) by Region, 2022-2032
Figure 6: Global 3D Sensor Market Value (US$ Mn) Analysis by Region, 2017-2032
Figure 7: Global 3D Sensor Market Value Share (%) and BPS Analysis by Region, 2022-2032
Figure 8: Global 3D Sensor Market Y-o-Y Growth (%) Projections by Region, 2022-2032
Figure 9: Global 3D Sensor Market Value (US$ Mn) Analysis by Sensor Type, 2017-2032
Figure 10: Global 3D Sensor Market Value Share (%) and BPS Analysis by Sensor Type, 2022-2032
Figure 11: Global 3D Sensor Market Y-o-Y Growth (%) Projections by Sensor Type, 2022-2032
Figure 12: Global 3D Sensor Market Value (US$ Mn) Analysis by Technology, 2017-2032
Figure 13: Global 3D Sensor Market Value Share (%) and BPS Analysis by Technology, 2022-2032
Figure 14: Global 3D Sensor Market Y-o-Y Growth (%) Projections by Technology, 2022-2032
Figure 15: Global 3D Sensor Market Value (US$ Mn) Analysis by Industry Application, 2017-2032
Figure 16: Global 3D Sensor Market Value Share (%) and BPS Analysis by Industry Application, 2022-2032
Figure 17: Global 3D Sensor Market Y-o-Y Growth (%) Projections by Industry Application, 2022-2032
Figure 18: Global 3D Sensor Market Value (US$ Mn) Analysis by Profile Type, 2017-2032
Figure 19: Global 3D Sensor Market Value Share (%) and BPS Analysis by Profile Type, 2022-2032
Figure 20: Global 3D Sensor Market Y-o-Y Growth (%) Projections by Profile Type, 2022-2032
Figure 21: Global 3D Sensor Market Attractiveness by Sensor Type, 2022-2032
Figure 22: Global 3D Sensor Market Attractiveness by Technology, 2022-2032
Figure 23: Global 3D Sensor Market Attractiveness by Industry Application, 2022-2032
Figure 24: Global 3D Sensor Market Attractiveness by Profile Type, 2022-2032
Figure 25: Global 3D Sensor Market Attractiveness by Region, 2022-2032
Figure 26: North America 3D Sensor Market Value (US$ Mn) by Sensor Type, 2022-2032
Figure 27: North America 3D Sensor Market Value (US$ Mn) by Technology, 2022-2032
Figure 28: North America 3D Sensor Market Value (US$ Mn) by Industry Application, 2022-2032
Figure 29: North America 3D Sensor Market Value (US$ Mn) by Profile Type, 2022-2032
Figure 30: North America 3D Sensor Market Value (US$ Mn) by Country, 2022-2032
Figure 31: North America 3D Sensor Market Value (US$ Mn) Analysis by Country, 2017-2032
Figure 32: North America 3D Sensor Market Value Share (%) and BPS Analysis by Country, 2022-2032
Figure 33: North America 3D Sensor Market Y-o-Y Growth (%) Projections by Country, 2022-2032
Figure 34: North America 3D Sensor Market Value (US$ Mn) Analysis by Sensor Type, 2017-2032
Figure 35: North America 3D Sensor Market Value Share (%) and BPS Analysis by Sensor Type, 2022-2032
Figure 36: North America 3D Sensor Market Y-o-Y Growth (%) Projections by Sensor Type, 2022-2032
Figure 37: North America 3D Sensor Market Value (US$ Mn) Analysis by Technology, 2017-2032
Figure 38: North America 3D Sensor Market Value Share (%) and BPS Analysis by Technology, 2022-2032
Figure 39: North America 3D Sensor Market Y-o-Y Growth (%) Projections by Technology, 2022-2032
Figure 40: North America 3D Sensor Market Value (US$ Mn) Analysis by Industry Application, 2017-2032
Figure 41: North America 3D Sensor Market Value Share (%) and BPS Analysis by Industry Application, 2022-2032
Figure 42: North America 3D Sensor Market Y-o-Y Growth (%) Projections by Industry Application, 2022-2032
Figure 43: North America 3D Sensor Market Value (US$ Mn) Analysis by Profile Type, 2017-2032
Figure 44: North America 3D Sensor Market Value Share (%) and BPS Analysis by Profile Type, 2022-2032
Figure 45: North America 3D Sensor Market Y-o-Y Growth (%) Projections by Profile Type, 2022-2032
Figure 46: North America 3D Sensor Market Attractiveness by Sensor Type, 2022-2032
Figure 47: North America 3D Sensor Market Attractiveness by Technology, 2022-2032
Figure 48: North America 3D Sensor Market Attractiveness by Industry Application, 2022-2032
Figure 49: North America 3D Sensor Market Attractiveness by Profile Type, 2022-2032
Figure 50: North America 3D Sensor Market Attractiveness by Country, 2022-2032
Figure 51: Latin America 3D Sensor Market Value (US$ Mn) by Sensor Type, 2022-2032
Figure 52: Latin America 3D Sensor Market Value (US$ Mn) by Technology, 2022-2032
Figure 53: Latin America 3D Sensor Market Value (US$ Mn) by Industry Application, 2022-2032
Figure 54: Latin America 3D Sensor Market Value (US$ Mn) by Profile Type, 2022-2032
Figure 55: Latin America 3D Sensor Market Value (US$ Mn) by Country, 2022-2032
Figure 56: Latin America 3D Sensor Market Value (US$ Mn) Analysis by Country, 2017-2032
Figure 57: Latin America 3D Sensor Market Value Share (%) and BPS Analysis by Country, 2022-2032
Figure 58: Latin America 3D Sensor Market Y-o-Y Growth (%) Projections by Country, 2022-2032
Figure 59: Latin America 3D Sensor Market Value (US$ Mn) Analysis by Sensor Type, 2017-2032
Figure 60: Latin America 3D Sensor Market Value Share (%) and BPS Analysis by Sensor Type, 2022-2032
Figure 61: Latin America 3D Sensor Market Y-o-Y Growth (%) Projections by Sensor Type, 2022-2032
Figure 62: Latin America 3D Sensor Market Value (US$ Mn) Analysis by Technology, 2017-2032
Figure 63: Latin America 3D Sensor Market Value Share (%) and BPS Analysis by Technology, 2022-2032
Figure 64: Latin America 3D Sensor Market Y-o-Y Growth (%) Projections by Technology, 2022-2032
Figure 65: Latin America 3D Sensor Market Value (US$ Mn) Analysis by Industry Application, 2017-2032
Figure 66: Latin America 3D Sensor Market Value Share (%) and BPS Analysis by Industry Application, 2022-2032
Figure 67: Latin America 3D Sensor Market Y-o-Y Growth (%) Projections by Industry Application, 2022-2032
Figure 68: Latin America 3D Sensor Market Value (US$ Mn) Analysis by Profile Type, 2017-2032
Figure 69: Latin America 3D Sensor Market Value Share (%) and BPS Analysis by Profile Type, 2022-2032
Figure 70: Latin America 3D Sensor Market Y-o-Y Growth (%) Projections by Profile Type, 2022-2032
Figure 71: Latin America 3D Sensor Market Attractiveness by Sensor Type, 2022-2032
Figure 72: Latin America 3D Sensor Market Attractiveness by Technology, 2022-2032
Figure 73: Latin America 3D Sensor Market Attractiveness by Industry Application, 2022-2032
Figure 74: Latin America 3D Sensor Market Attractiveness by Profile Type, 2022-2032
Figure 75: Latin America 3D Sensor Market Attractiveness by Country, 2022-2032
Figure 76: Europe 3D Sensor Market Value (US$ Mn) by Sensor Type, 2022-2032
Figure 77: Europe 3D Sensor Market Value (US$ Mn) by Technology, 2022-2032
Figure 78: Europe 3D Sensor Market Value (US$ Mn) by Industry Application, 2022-2032
Figure 79: Europe 3D Sensor Market Value (US$ Mn) by Profile Type, 2022-2032
Figure 80: Europe 3D Sensor Market Value (US$ Mn) by Country, 2022-2032
Figure 81: Europe 3D Sensor Market Value (US$ Mn) Analysis by Country, 2017-2032
Figure 82: Europe 3D Sensor Market Value Share (%) and BPS Analysis by Country, 2022-2032
Figure 83: Europe 3D Sensor Market Y-o-Y Growth (%) Projections by Country, 2022-2032
Figure 84: Europe 3D Sensor Market Value (US$ Mn) Analysis by Sensor Type, 2017-2032
Figure 85: Europe 3D Sensor Market Value Share (%) and BPS Analysis by Sensor Type, 2022-2032
Figure 86: Europe 3D Sensor Market Y-o-Y Growth (%) Projections by Sensor Type, 2022-2032
Figure 87: Europe 3D Sensor Market Value (US$ Mn) Analysis by Technology, 2017-2032
Figure 88: Europe 3D Sensor Market Value Share (%) and BPS Analysis by Technology, 2022-2032
Figure 89: Europe 3D Sensor Market Y-o-Y Growth (%) Projections by Technology, 2022-2032
Figure 90: Europe 3D Sensor Market Value (US$ Mn) Analysis by Industry Application, 2017-2032
Figure 91: Europe 3D Sensor Market Value Share (%) and BPS Analysis by Industry Application, 2022-2032
Figure 92: Europe 3D Sensor Market Y-o-Y Growth (%) Projections by Industry Application, 2022-2032
Figure 93: Europe 3D Sensor Market Value (US$ Mn) Analysis by Profile Type, 2017-2032
Figure 94: Europe 3D Sensor Market Value Share (%) and BPS Analysis by Profile Type, 2022-2032
Figure 95: Europe 3D Sensor Market Y-o-Y Growth (%) Projections by Profile Type, 2022-2032
Figure 96: Europe 3D Sensor Market Attractiveness by Sensor Type, 2022-2032
Figure 97: Europe 3D Sensor Market Attractiveness by Technology, 2022-2032
Figure 98: Europe 3D Sensor Market Attractiveness by Industry Application, 2022-2032
Figure 99: Europe 3D Sensor Market Attractiveness by Profile Type, 2022-2032
Figure 100: Europe 3D Sensor Market Attractiveness by Country, 2022-2032
Figure 101: East Asia 3D Sensor Market Value (US$ Mn) by Sensor Type, 2022-2032
Figure 102: East Asia 3D Sensor Market Value (US$ Mn) by Technology, 2022-2032
Figure 103: East Asia 3D Sensor Market Value (US$ Mn) by Industry Application, 2022-2032
Figure 104: East Asia 3D Sensor Market Value (US$ Mn) by Profile Type, 2022-2032
Figure 105: East Asia 3D Sensor Market Value (US$ Mn) by Country, 2022-2032
Figure 106: East Asia 3D Sensor Market Value (US$ Mn) Analysis by Country, 2017-2032
Figure 107: East Asia 3D Sensor Market Value Share (%) and BPS Analysis by Country, 2022-2032
Figure 108: East Asia 3D Sensor Market Y-o-Y Growth (%) Projections by Country, 2022-2032
Figure 109: East Asia 3D Sensor Market Value (US$ Mn) Analysis by Sensor Type, 2017-2032
Figure 110: East Asia 3D Sensor Market Value Share (%) and BPS Analysis by Sensor Type, 2022-2032
Figure 111: East Asia 3D Sensor Market Y-o-Y Growth (%) Projections by Sensor Type, 2022-2032
Figure 112: East Asia 3D Sensor Market Value (US$ Mn) Analysis by Technology, 2017-2032
Figure 113: East Asia 3D Sensor Market Value Share (%) and BPS Analysis by Technology, 2022-2032
Figure 114: East Asia 3D Sensor Market Y-o-Y Growth (%) Projections by Technology, 2022-2032
Figure 115: East Asia 3D Sensor Market Value (US$ Mn) Analysis by Industry Application, 2017-2032
Figure 116: East Asia 3D Sensor Market Value Share (%) and BPS Analysis by Industry Application, 2022-2032
Figure 117: East Asia 3D Sensor Market Y-o-Y Growth (%) Projections by Industry Application, 2022-2032
Figure 118: East Asia 3D Sensor Market Value (US$ Mn) Analysis by Profile Type, 2017-2032
Figure 119: East Asia 3D Sensor Market Value Share (%) and BPS Analysis by Profile Type, 2022-2032
Figure 120: East Asia 3D Sensor Market Y-o-Y Growth (%) Projections by Profile Type, 2022-2032
Figure 121: East Asia 3D Sensor Market Attractiveness by Sensor Type, 2022-2032
Figure 122: East Asia 3D Sensor Market Attractiveness by Technology, 2022-2032
Figure 123: East Asia 3D Sensor Market Attractiveness by Industry Application, 2022-2032
Figure 124: East Asia 3D Sensor Market Attractiveness by Profile Type, 2022-2032
Figure 125: East Asia 3D Sensor Market Attractiveness by Country, 2022-2032
Figure 126: South Asia & Pacific 3D Sensor Market Value (US$ Mn) by Sensor Type, 2022-2032
Figure 127: South Asia & Pacific 3D Sensor Market Value (US$ Mn) by Technology, 2022-2032
Figure 128: South Asia & Pacific 3D Sensor Market Value (US$ Mn) by Industry Application, 2022-2032
Figure 129: South Asia & Pacific 3D Sensor Market Value (US$ Mn) by Profile Type, 2022-2032
Figure 130: South Asia & Pacific 3D Sensor Market Value (US$ Mn) by Country, 2022-2032
Figure 131: South Asia & Pacific 3D Sensor Market Value (US$ Mn) Analysis by Country, 2017-2032
Figure 132: South Asia & Pacific 3D Sensor Market Value Share (%) and BPS Analysis by Country, 2022-2032
Figure 133: South Asia & Pacific 3D Sensor Market Y-o-Y Growth (%) Projections by Country, 2022-2032
Figure 134: South Asia & Pacific 3D Sensor Market Value (US$ Mn) Analysis by Sensor Type, 2017-2032
Figure 135: South Asia & Pacific 3D Sensor Market Value Share (%) and BPS Analysis by Sensor Type, 2022-2032
Figure 136: South Asia & Pacific 3D Sensor Market Y-o-Y Growth (%) Projections by Sensor Type, 2022-2032
Figure 137: South Asia & Pacific 3D Sensor Market Value (US$ Mn) Analysis by Technology, 2017-2032
Figure 138: South Asia & Pacific 3D Sensor Market Value Share (%) and BPS Analysis by Technology, 2022-2032
Figure 139: South Asia & Pacific 3D Sensor Market Y-o-Y Growth (%) Projections by Technology, 2022-2032
Figure 140: South Asia & Pacific 3D Sensor Market Value (US$ Mn) Analysis by Industry Application, 2017-2032
Figure 141: South Asia & Pacific 3D Sensor Market Value Share (%) and BPS Analysis by Industry Application, 2022-2032
Figure 142: South Asia & Pacific 3D Sensor Market Y-o-Y Growth (%) Projections by Industry Application, 2022-2032
Figure 143: South Asia & Pacific 3D Sensor Market Value (US$ Mn) Analysis by Profile Type, 2017-2032
Figure 144: South Asia & Pacific 3D Sensor Market Value Share (%) and BPS Analysis by Profile Type, 2022-2032
Figure 145: South Asia & Pacific 3D Sensor Market Y-o-Y Growth (%) Projections by Profile Type, 2022-2032
Figure 146: South Asia & Pacific 3D Sensor Market Attractiveness by Sensor Type, 2022-2032
Figure 147: South Asia & Pacific 3D Sensor Market Attractiveness by Technology, 2022-2032
Figure 148: South Asia & Pacific 3D Sensor Market Attractiveness by Industry Application, 2022-2032
Figure 149: South Asia & Pacific 3D Sensor Market Attractiveness by Profile Type, 2022-2032
Figure 150: South Asia & Pacific 3D Sensor Market Attractiveness by Country, 2022-2032
Figure 151: MEA 3D Sensor Market Value (US$ Mn) by Sensor Type, 2022-2032
Figure 152: MEA 3D Sensor Market Value (US$ Mn) by Technology, 2022-2032
Figure 153: MEA 3D Sensor Market Value (US$ Mn) by Industry Application, 2022-2032
Figure 154: MEA 3D Sensor Market Value (US$ Mn) by Profile Type, 2022-2032
Figure 155: MEA 3D Sensor Market Value (US$ Mn) by Country, 2022-2032
Figure 156: MEA 3D Sensor Market Value (US$ Mn) Analysis by Country, 2017-2032
Figure 157: MEA 3D Sensor Market Value Share (%) and BPS Analysis by Country, 2022-2032
Figure 158: MEA 3D Sensor Market Y-o-Y Growth (%) Projections by Country, 2022-2032
Figure 159: MEA 3D Sensor Market Value (US$ Mn) Analysis by Sensor Type, 2017-2032
Figure 160: MEA 3D Sensor Market Value Share (%) and BPS Analysis by Sensor Type, 2022-2032
Figure 161: MEA 3D Sensor Market Y-o-Y Growth (%) Projections by Sensor Type, 2022-2032
Figure 162: MEA 3D Sensor Market Value (US$ Mn) Analysis by Technology, 2017-2032
Figure 163: MEA 3D Sensor Market Value Share (%) and BPS Analysis by Technology, 2022-2032
Figure 164: MEA 3D Sensor Market Y-o-Y Growth (%) Projections by Technology, 2022-2032
Figure 165: MEA 3D Sensor Market Value (US$ Mn) Analysis by Industry Application, 2017-2032
Figure 166: MEA 3D Sensor Market Value Share (%) and BPS Analysis by Industry Application, 2022-2032
Figure 167: MEA 3D Sensor Market Y-o-Y Growth (%) Projections by Industry Application, 2022-2032
Figure 168: MEA 3D Sensor Market Value (US$ Mn) Analysis by Profile Type, 2017-2032
Figure 169: MEA 3D Sensor Market Value Share (%) and BPS Analysis by Profile Type, 2022-2032
Figure 170: MEA 3D Sensor Market Y-o-Y Growth (%) Projections by Profile Type, 2022-2032
Figure 171: MEA 3D Sensor Market Attractiveness by Sensor Type, 2022-2032
Figure 172: MEA 3D Sensor Market Attractiveness by Technology, 2022-2032
Figure 173: MEA 3D Sensor Market Attractiveness by Industry Application, 2022-2032
Figure 174: MEA 3D Sensor Market Attractiveness by Profile Type, 2022-2032
Figure 175: MEA 3D Sensor Market Attractiveness by Country, 2022-2032
Need specific information?
Request CustomizationExplore Technology Insights
View Reports