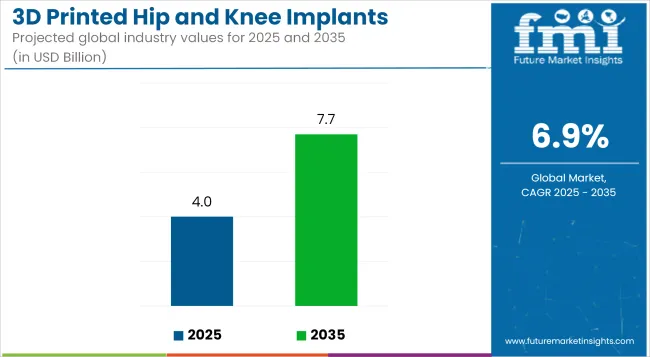
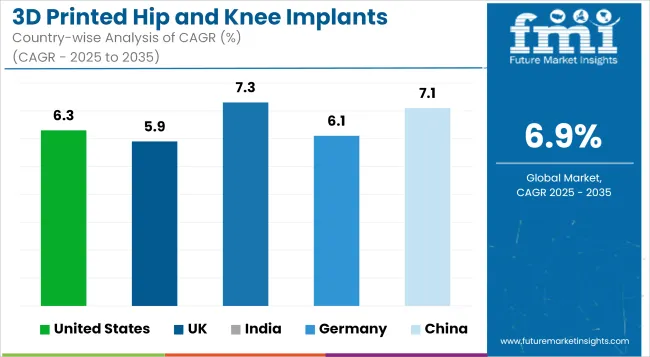
The global market for 3D Printed Hip and Knee Implants is forecasted to attain USD 4,080.7 million by 2025, expanding at 6.9% CAGR to reach USD 7,953.7 million by 2035. In 2024, the revenue of 3D Printed Hip and Knee Implants was around USD 3,841.9 million
The 3D printed hip and knee implants market growth is fueled by some of the important factors such as the increasing adoption of patient-specific implants, growth in 3D printing material technologies such as titanium and biocompatible polymers, and rising investments in regenerative medicine.
Additionally, advancements such as AI-based implant design, advancements in surface modification to improve osseointegration, and expanded availability of economical additive manufacturing technologies are further improving market penetration.
Nonetheless, challenges with the prohibitively high cost of 3D-printed implants, intricate regulation approval of medical devices, and the low awareness in developing markets can limit growth. However, there are opportunities with the advent of bio resorbable implants, growing emphasis on robot-assisted implant placement, and increased application of 3D-printed implants for revision surgeries.
Advancements in 3D printing technologies for hip and knee implants, including enhanced printing materials, AI use design tools, and cloud-based data management systems, are driving significant growth in the market. Emerging innovations such as precision-engineered implant structures, advanced surface modification techniques, and improved material coatings are being actively explored to enhance implant durability, surgical efficiency, and patient outcomes.
The North American hip and knee 3D printed implants market is growing because of excessive adoption of next-generation orthopedic implants, high incidence of osteoarthritis, and strong presence of prominent medical device companies. The USA dominates the region with the support of rising demand for personalized implants, elevated use of AI use implant design, and high FDA approvals for 3D-printed orthopedic products.
Yet, factors like high costs of customized implants, strict regulatory compliance needs, and issues regarding long-term implant durability affect market growth. The growing use of AI-based implant modeling, growth in hospital-based 3D printing laboratories, and increasing partnerships between orthopedic research centers and med-tech companies are likely to fuel additional market growth in North America
Europe is a sizeable market for 3D printed hip and knee implants, catalyzed by rising healthcare expenditure on orthopedic procedures, growing use of customized joint replacements, and robust regulatory environments favoring the development of medical devices.
Germany, France, and the UK are major markets that enjoy well-developed orthopedic research facilities, rising demand for biocompatible 3D printing materials, and enhanced government efforts to enhance joint replacement surgeries. Yet, hurdles like stringent medical device regulations, exorbitant prices of next-generation implant production, and gradual uptake of robotic deisgn implant planning in public healthcare facilities can hamper market growth.
The growing emphasis on patient-specific implants, growth of biodegradable 3D-printed materials, and increased collaboration between digital health firms and orthopedic companies are defining the European market. In addition, advances in regenerative bone scaffolds and 3D-printed implant usage in complex reconstructions are enhancing patient mobility and surgical outcomes.
The Asia-Pacific region is witnessing rapid growth in the 3D printed hip and knee implants market due to increasing healthcare infrastructure investments, rising prevalence of joint-related disorders, and growing demand for cost-effective orthopedic solutions.
Countries such as China, Japan, and India are key markets, with expanding access to 3D printing in medical applications, increasing government funding for orthopedic research, and rising demand for minimally invasive joint replacement procedures. However, challenges such as affordability constraints, lack of standardized implant manufacturing protocols, and slower regulatory approvals for innovative orthopedic devices may hinder market penetration.
The increasing presence of global medical device manufacturers, expansion of robotic-assisted orthopedic surgeries, and integration of AI-powered preoperative planning tools are driving market expansion. Furthermore, advancements in multi-material 3D printing and increasing research into smart implant coatings for enhanced bone integration are improving procedural efficiency and patient outcomes in the region.
Challenges
Challenges Impacting the Growth of the 3D Printed Hip and Knee Implants Market
The 3D printed hip and knee implants market faces challenges such as high costs of customized implant production, regulatory hurdles in obtaining approvals for patient-specific devices, and risks of implant failure due to material limitations.
The need for improved printing speed and precision in orthopedic manufacturing, challenges in ensuring long-term biocompatibility of printed implants, and disparities in access to 3D printing technologies across different regions create barriers to market expansion.
Additionally, challenges in integrating AI-powered implant planning into routine orthopedic practice, high costs associated with training surgeons on 3D-printed implant techniques, and resistance to transitioning from traditional metal implants to 3D-printed alternatives impact market growth.
Opportunities
Advancements and Innovations Driving Growth in the 3D Printed Hip and Knee Implants Market
The increasing adoption of AI-powered implant design optimization, expansion of bioresorbable and patient-specific implants, and rising investment in hybrid 3D printing techniques present significant growth opportunities in the market.
The development of smart implants with embedded sensors for real-time monitoring, increasing focus on integrating 3D-printed implants with robotic-assisted surgical platforms, and expansion of bioprinting applications for bone regeneration are fueling market growth.
Additionally, increasing research into bioactive coatings for 3D-printed implants, expansion of advanced manufacturing hubs for customized orthopedic solutions, and growing collaborations between academic institutions and implant manufacturers for optimizing implant performance are expected to create new avenues for industry expansion.
The rise of cost-efficient 3D printing technologies and increasing consumer preference for minimally invasive, personalized orthopedic solutions are further enhancing accessibility and long-term market potential.
Emerging Trends
The rising adoption of hybrid and biodegradable implant materials is expanding market opportunities in complex joint reconstructions, pediatric orthopedics, and revision surgeries.
Governments and healthcare agencies are expanding support for medical 3D printing research, streamlining approval pathways for patient-specific implants, and implementing policies to improve accessibility of advanced orthopedic solutions.
Between 2020 and 2024, the 3D printed hip and knee implants market experienced notable growth, driven by advancements in additive manufacturing technologies and a rising demand for personalized medical solutions.
The ability to create patient-specific implants enhanced surgical outcomes and reduced recovery times, leading to increased adoption in orthopedic procedures. However, challenges such as high production costs and regulatory hurdles limited widespread implementation during this period.
Looking ahead to 2025 to 2035, the market is poised for continued expansion, propelled by technological innovations that improve cost-efficiency and scalability.
The integration of advanced materials and automation is expected to streamline production processes, making 3D printed implants more accessible. Additionally, the growing emphasis on personalized medicine and minimally invasive surgeries is anticipated to further drive market growth.
Shifts in the 3D Printed Hip and Knee Implants Market from 2020 to 2024 and Future Trends 2025 to 2035
Category | 2020 to 2024 Trends |
---|---|
Regulatory Landscape | Establishment of initial guidelines for 3D printed medical devices, focusing on safety and efficacy, leading to cautious adoption. |
Technological Advancements | Introduction of basic 3D printing technologies enabling customization of implants, primarily in experimental and limited clinical settings. |
Consumer Demand | Growing interest in personalized healthcare solutions, with early adopters opting for customized implants despite higher costs and limited availability. |
Market Growth Drivers | Advancements in 3D printing technology, rising cases of osteoarthritis and other joint-related ailments, and a shift towards minimally invasive surgical procedures. |
Sustainability | Initial considerations of environmental impact, with some efforts to utilize recyclable materials in implant production. |
Supply Chain Dynamics | Reliance on specialized suppliers for 3D printing materials and equipment, with challenges in scaling production to meet increasing demand. |
Category | 2025 to 2035 Projections |
---|---|
Regulatory Landscape | Evolution of comprehensive regulatory frameworks that balance innovation with patient safety, facilitating faster approvals and broader acceptance of 3D printed implants. |
Technological Advancements | Development of advanced 3D printing techniques incorporating biocompatible materials and automation, resulting in high-precision, cost-effective, and widely available patient-specific implants. |
Consumer Demand | Increased demand for personalized implants as they become more affordable and accessible, driven by a broader awareness of their benefits in improving surgical outcomes and reducing recovery times. |
Market Growth Drivers | Continued technological innovations, expanding applications in orthopedic surgeries, an aging population, and a heightened focus on patient-specific treatments contributing to sustained market growth. |
Sustainability | Adoption of sustainable manufacturing practices, including the use of eco-friendly materials and energy-efficient processes, aligning with global environmental standards and reducing the carbon footprint of implant production. |
Supply Chain Dynamics | Establishment of robust supply chains with localized production facilities, ensuring timely delivery and reducing dependency on single-source suppliers, thereby enhancing market resilience and responsiveness to demand fluctuations. |
Market Outlook
The United States is at the forefront of 3D-printed hip and knee implant adoption, spurred by technology, high rates of osteoarthritis, and a high concentration of medical device companies. The nation's sophisticated healthcare infrastructure, along with FDA clearance for patient-specific implants, has driven market growth. Moreover, increasing demand for minimally invasive orthopedic surgery and customized implants is further boosting demand.
Market Growth Factors
Market Forecast
Country | CAGR (2025 to 2035) |
---|---|
United States | 6.3% |
Market Outlook
The United Kingdom is witnessing steady growth in the adoption of 3D-printed hip and knee implants due to increased NHS investments in orthopedic care, a rising elderly population, and a growing emphasis on patient-specific treatments. The presence of leading research institutions and medical device manufacturers is fostering innovation in 3D printing technology for joint replacements.
Market Growth Factors
Market Forecast
Country | CAGR (2025 to 2035) |
---|---|
UK | 5.9% |
Market Outlook
India’s 3D-printed hip and knee implants market is growing, driven by increasing orthopedic disorders, rising healthcare investments, and a growing medical tourism industry.
While adoption is still in the early stages, advancements in local 3D printing manufacturing and affordable healthcare options are expanding market opportunities. The rise of private hospitals offering cutting-edge joint replacement surgeries is further contributing to growth.
Market Growth Factors
Market Forecast
Country | CAGR (2025 to 2035) |
---|---|
India | 7.3% |
Market Outlook
Germany is at the forefront of the 3D-printed hip and knee implants market, driven by strong research in orthopedic biomaterials, a well-established medical device industry, and high adoption of digital manufacturing technologies. The country’s advanced regulatory framework ensures high-quality implant production, making it a key player in the global market.
Market Growth Drivers
Market Forecast
Country | CAGR (2025 to 2035) |
---|---|
Germany | 6.1% |
Market Outlook
China’s 3D-printed hip and knee implants market is growing rapidly due to increasing healthcare infrastructure investments, rising prevalence of osteoarthritis, and strong government support for medical technology innovations. Domestic companies are emerging as key players in the development of cost-effective and high-quality 3D-printed implants.
Market Growth Drivers
Market Forecast
Country | CAGR (2025 to 2035) |
---|---|
China | 7.1% |
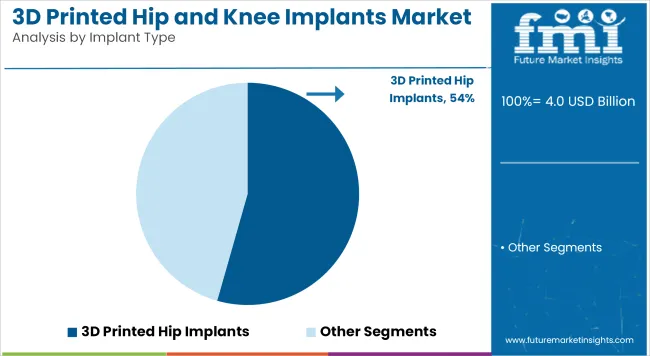
3D Printed Hip Implants: Rising Adoption of 3D-Printed Hip Implants for Personalized Orthopedic Solutions
3D printed hip implants are gaining traction due to their ability to provide patient-specific customization, enhanced osseointegration, and long-term durability.
These implants are particularly beneficial for total hip arthroplasty (THA), partial hip replacements, and hip resurfacing procedures. The rising prevalence of osteoarthritis, increasing demand for personalized orthopedic solutions, and advancements in additive manufacturing for biocompatible implants are driving market growth.
North America and Europe lead in 3D printed hip implant adoption due to strong R&D investments and regulatory support for innovative orthopedic solutions, while Asia-Pacific is witnessing growth due to increasing hip replacement procedures and improving healthcare infrastructure. Future advancements include AI-assisted implant design for optimal patient fit, bioresorbable 3D printed implants, and smart implants with embedded sensors for real-time monitoring.
3D Printed Knee Implants: Growing Demand for 3D-Printed Knee Implants in Personalized Orthopedic Care
3D printed knee implants offer customized solutions tailored to individual joint anatomy, improving mobility and reducing post-surgical complications. These implants are widely used in total knee replacement (TKR) and partial knee replacement (PKR) procedures, helping patients achieve better alignment and long-term durability.
The growing number of knee replacement surgeries, increasing demand for minimally invasive orthopedic solutions, and rising adoption of 3D printing in personalized medicine are fueling market expansion.
North America and Europe dominate in knee implant adoption due to established orthopedic research and high surgical volumes, while Asia-Pacific is experiencing increased adoption due to aging populations and expanding medical device accessibility.
Future trends include AI-powered 3D printing for precision-matched implants, hybrid implants combining 3D printed metal with bioactive coatings, and smart knee implants with real-time motion tracking capabilities.
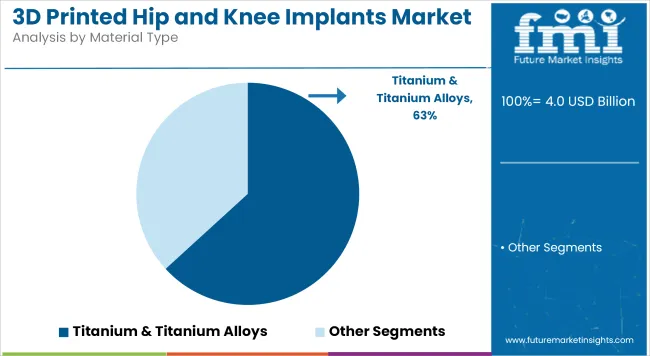
Titanium & Titanium Alloys
Titanium-based 3D printed implants are widely used due to their biocompatibility, strength, and excellent osseointegration properties. These materials provide lightweight yet durable orthopedic solutions, reducing implant rejection and enhancing long-term joint stability. The increasing demand for metal 3D printed implants, advancements in electron beam melting (EBM) and selective laser melting (SLM) technologies, and rising preference for patient-specific orthopedic implants are driving market demand.
North America and Europe lead in titanium-based implant adoption due to strong regulatory approvals and advanced manufacturing capabilities, while Asia-Pacific is seeing growth due to increasing medical 3D printing investments. Future innovations include nanostructured titanium implants for improved bone regeneration, AI-driven lattice structures for enhanced flexibility, and antibacterial-coated titanium implants for infection prevention.
Polymer-Based 3D Printed Implants
3D printed implants made of polymers, such as polyether ether ketone and biocompatible composites, provide lighter, more flexible metal alternatives. These have lower stress shielding, higher wear resistance, and radiolucency, which are highly suitable for orthopedic applications. The demand for metal-free orthopedic implants, expanding research on biodegradable 3D printed materials, and rising interest in cost-saving implant solutions are driving market growth.
North America and Europe lead in polymer-based implant research owing to robust material science development, while Asia-Pacific is observing growing interest in bioresorbable and hybrid polymer-metal implants. Future trends involve smart polymer implants with integral microelectronics, AI-assisted polymer design for load-bearing purposes, and self-healing polymer implants for long-term durability.
The 3D printed hip and knee implants market is highly competitive, driven by increasing demand for patient-specific implants, advancements in additive manufacturing technology, and the growing adoption of personalized orthopedic solutions.
Companies are investing in biocompatible materials, AI-driven implant design, and cost-effective 3D printing techniques to maintain a competitive edge. The market is shaped by well-established orthopedic implant manufacturers, 3D printing technology providers, and emerging medical device firms, each contributing to the evolving landscape of customized joint replacements.
Market Share Analysis by Company
Company Name | Estimated Market Share (%) |
---|---|
Stryker Corporation | 10-13% |
Zimmer Biomet Holdings | 9-10% |
Johnson & Johnson (DePuy Synthes) | 20-12% |
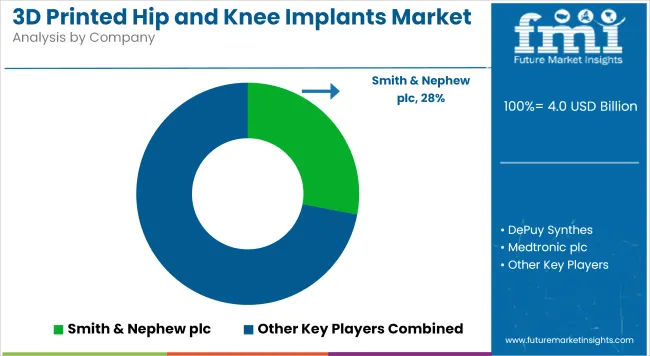
Smith & Nephew plc | 15-18% |
Medtronic plc | 4-7% |
Other Companies (combined) | 30-35% |
Company Name | Key Offerings/Activities |
---|---|
Stryker Corporation | Market leader offering 3D-printed titanium hip and knee implants with advanced osseointegration technology. |
Zimmer Biomet Holdings | Develops personalized joint replacement implants using AI-assisted 3D printing design. |
Johnson & Johnson (DePuy Synthes) | Specializes in customized knee implants and robotic-assisted 3D printing techniques. |
Smith & Nephew plc | Provides innovative lattice-structured implants for enhanced bone integration and long-term durability. |
Medtronic plc | Focuses on biocompatible 3D-printed implants with patient-specific customization for orthopedic applications. |
Key Company Insights
Stryker Corporation (22-26%)
A dominant player in the 3D printed hip and knee implants market, Stryker leads with its Tritanium technology, enabling superior bone integration and implant longevity.
Zimmer Biomet Holdings (18-22%)
A leader in personalized joint replacements, Zimmer Biomet utilizes AI-driven design and 3D printing to create customized orthopedic implants.
Johnson & Johnson (DePuy Synthes) (10-14%)
A key innovator in robotic-assisted surgery, DePuy Synthes integrates 3D printing with its advanced knee and hip replacement systems.
Smith & Nephew plc (8-12%)
A strong competitor in 3D-printed orthopedic implants, Smith & Nephew focuses on lightweight, lattice-structured designs for improved patient outcomes.
Medtronic plc (5-9%)
A major provider of orthopedic solutions, Medtronic enhances implant customization through biocompatible and patient-specific 3D-printed implants.
Other Key Players (25-35% Combined)
Beyond the leading companies, several other manufacturers contribute significantly to the market, enhancing product diversity and technological advancements. These include:
These companies focus on expanding the reach of 3D-printed implant solutions, offering competitive pricing and cutting-edge innovations to meet diverse orthopedic and patient needs.
3D Printed Hip Implants and 3D Printed Knee Implants
Titanium & Titanium Alloys, Polymer, Ceramic and Others
Hospitals and Orthopedics Clinics
North America, Latin America, Western Europe, Eastern Europe, East Asia, South Asia & Pacific, Middle East & Africa
Table 1: Global Market Value (US$ Million) Forecast by Region, 2018 to 2033
Table 2: Global Market Value (US$ Million) Forecast by Implant, 2018 to 2033
Table 3: Global Market Value (US$ Million) Forecast by Material, 2018 to 2033
Table 4: Global Market Value (US$ Million) Forecast by End-User, 2018 to 2033
Table 5: North America Market Value (US$ Million) Forecast by Country, 2018 to 2033
Table 6: North America Market Value (US$ Million) Forecast by Implant, 2018 to 2033
Table 7: North America Market Value (US$ Million) Forecast by Material, 2018 to 2033
Table 8: North America Market Value (US$ Million) Forecast by End-User, 2018 to 2033
Table 9: Latin America Market Value (US$ Million) Forecast by Country, 2018 to 2033
Table 10: Latin America Market Value (US$ Million) Forecast by Implant, 2018 to 2033
Table 11: Latin America Market Value (US$ Million) Forecast by Material, 2018 to 2033
Table 12: Latin America Market Value (US$ Million) Forecast by End-User, 2018 to 2033
Table 13: Western Europe Market Value (US$ Million) Forecast by Country, 2018 to 2033
Table 14: Western Europe Market Value (US$ Million) Forecast by Implant, 2018 to 2033
Table 15: Western Europe Market Value (US$ Million) Forecast by Material, 2018 to 2033
Table 16: Western Europe Market Value (US$ Million) Forecast by End-User, 2018 to 2033
Table 17: Eastern Europe Market Value (US$ Million) Forecast by Country, 2018 to 2033
Table 18: Eastern Europe Market Value (US$ Million) Forecast by Implant, 2018 to 2033
Table 19: Eastern Europe Market Value (US$ Million) Forecast by Material, 2018 to 2033
Table 20: Eastern Europe Market Value (US$ Million) Forecast by End-User, 2018 to 2033
Table 21: South Asia and Pacific Market Value (US$ Million) Forecast by Country, 2018 to 2033
Table 22: South Asia and Pacific Market Value (US$ Million) Forecast by Implant, 2018 to 2033
Table 23: South Asia and Pacific Market Value (US$ Million) Forecast by Material, 2018 to 2033
Table 24: South Asia and Pacific Market Value (US$ Million) Forecast by End-User, 2018 to 2033
Table 25: East Asia Market Value (US$ Million) Forecast by Country, 2018 to 2033
Table 26: East Asia Market Value (US$ Million) Forecast by Implant, 2018 to 2033
Table 27: East Asia Market Value (US$ Million) Forecast by Material, 2018 to 2033
Table 28: East Asia Market Value (US$ Million) Forecast by End-User, 2018 to 2033
Table 29: Middle East and Africa Market Value (US$ Million) Forecast by Country, 2018 to 2033
Table 30: Middle East and Africa Market Value (US$ Million) Forecast by Implant, 2018 to 2033
Table 31: Middle East and Africa Market Value (US$ Million) Forecast by Material, 2018 to 2033
Table 32: Middle East and Africa Market Value (US$ Million) Forecast by End-User, 2018 to 2033
Figure 1: Global Market Value (US$ Million) by Implant, 2023 to 2033
Figure 2: Global Market Value (US$ Million) by Material, 2023 to 2033
Figure 3: Global Market Value (US$ Million) by End-User, 2023 to 2033
Figure 4: Global Market Value (US$ Million) by Region, 2023 to 2033
Figure 5: Global Market Value (US$ Million) Analysis by Region, 2018 to 2033
Figure 6: Global Market Value Share (%) and BPS Analysis by Region, 2023 to 2033
Figure 7: Global Market Y-o-Y Growth (%) Projections by Region, 2023 to 2033
Figure 8: Global Market Value (US$ Million) Analysis by Implant, 2018 to 2033
Figure 9: Global Market Value Share (%) and BPS Analysis by Implant, 2023 to 2033
Figure 10: Global Market Y-o-Y Growth (%) Projections by Implant, 2023 to 2033
Figure 11: Global Market Value (US$ Million) Analysis by Material, 2018 to 2033
Figure 12: Global Market Value Share (%) and BPS Analysis by Material, 2023 to 2033
Figure 13: Global Market Y-o-Y Growth (%) Projections by Material, 2023 to 2033
Figure 14: Global Market Value (US$ Million) Analysis by End-User, 2018 to 2033
Figure 15: Global Market Value Share (%) and BPS Analysis by End-User, 2023 to 2033
Figure 16: Global Market Y-o-Y Growth (%) Projections by End-User, 2023 to 2033
Figure 17: Global Market Attractiveness by Implant, 2023 to 2033
Figure 18: Global Market Attractiveness by Material, 2023 to 2033
Figure 19: Global Market Attractiveness by End-User, 2023 to 2033
Figure 20: Global Market Attractiveness by Region, 2023 to 2033
Figure 21: North America Market Value (US$ Million) by Implant, 2023 to 2033
Figure 22: North America Market Value (US$ Million) by Material, 2023 to 2033
Figure 23: North America Market Value (US$ Million) by End-User, 2023 to 2033
Figure 24: North America Market Value (US$ Million) by Country, 2023 to 2033
Figure 25: North America Market Value (US$ Million) Analysis by Country, 2018 to 2033
Figure 26: North America Market Value Share (%) and BPS Analysis by Country, 2023 to 2033
Figure 27: North America Market Y-o-Y Growth (%) Projections by Country, 2023 to 2033
Figure 28: North America Market Value (US$ Million) Analysis by Implant, 2018 to 2033
Figure 29: North America Market Value Share (%) and BPS Analysis by Implant, 2023 to 2033
Figure 30: North America Market Y-o-Y Growth (%) Projections by Implant, 2023 to 2033
Figure 31: North America Market Value (US$ Million) Analysis by Material, 2018 to 2033
Figure 32: North America Market Value Share (%) and BPS Analysis by Material, 2023 to 2033
Figure 33: North America Market Y-o-Y Growth (%) Projections by Material, 2023 to 2033
Figure 34: North America Market Value (US$ Million) Analysis by End-User, 2018 to 2033
Figure 35: North America Market Value Share (%) and BPS Analysis by End-User, 2023 to 2033
Figure 36: North America Market Y-o-Y Growth (%) Projections by End-User, 2023 to 2033
Figure 37: North America Market Attractiveness by Implant, 2023 to 2033
Figure 38: North America Market Attractiveness by Material, 2023 to 2033
Figure 39: North America Market Attractiveness by End-User, 2023 to 2033
Figure 40: North America Market Attractiveness by Country, 2023 to 2033
Figure 41: Latin America Market Value (US$ Million) by Implant, 2023 to 2033
Figure 42: Latin America Market Value (US$ Million) by Material, 2023 to 2033
Figure 43: Latin America Market Value (US$ Million) by End-User, 2023 to 2033
Figure 44: Latin America Market Value (US$ Million) by Country, 2023 to 2033
Figure 45: Latin America Market Value (US$ Million) Analysis by Country, 2018 to 2033
Figure 46: Latin America Market Value Share (%) and BPS Analysis by Country, 2023 to 2033
Figure 47: Latin America Market Y-o-Y Growth (%) Projections by Country, 2023 to 2033
Figure 48: Latin America Market Value (US$ Million) Analysis by Implant, 2018 to 2033
Figure 49: Latin America Market Value Share (%) and BPS Analysis by Implant, 2023 to 2033
Figure 50: Latin America Market Y-o-Y Growth (%) Projections by Implant, 2023 to 2033
Figure 51: Latin America Market Value (US$ Million) Analysis by Material, 2018 to 2033
Figure 52: Latin America Market Value Share (%) and BPS Analysis by Material, 2023 to 2033
Figure 53: Latin America Market Y-o-Y Growth (%) Projections by Material, 2023 to 2033
Figure 54: Latin America Market Value (US$ Million) Analysis by End-User, 2018 to 2033
Figure 55: Latin America Market Value Share (%) and BPS Analysis by End-User, 2023 to 2033
Figure 56: Latin America Market Y-o-Y Growth (%) Projections by End-User, 2023 to 2033
Figure 57: Latin America Market Attractiveness by Implant, 2023 to 2033
Figure 58: Latin America Market Attractiveness by Material, 2023 to 2033
Figure 59: Latin America Market Attractiveness by End-User, 2023 to 2033
Figure 60: Latin America Market Attractiveness by Country, 2023 to 2033
Figure 61: Western Europe Market Value (US$ Million) by Implant, 2023 to 2033
Figure 62: Western Europe Market Value (US$ Million) by Material, 2023 to 2033
Figure 63: Western Europe Market Value (US$ Million) by End-User, 2023 to 2033
Figure 64: Western Europe Market Value (US$ Million) by Country, 2023 to 2033
Figure 65: Western Europe Market Value (US$ Million) Analysis by Country, 2018 to 2033
Figure 66: Western Europe Market Value Share (%) and BPS Analysis by Country, 2023 to 2033
Figure 67: Western Europe Market Y-o-Y Growth (%) Projections by Country, 2023 to 2033
Figure 68: Western Europe Market Value (US$ Million) Analysis by Implant, 2018 to 2033
Figure 69: Western Europe Market Value Share (%) and BPS Analysis by Implant, 2023 to 2033
Figure 70: Western Europe Market Y-o-Y Growth (%) Projections by Implant, 2023 to 2033
Figure 71: Western Europe Market Value (US$ Million) Analysis by Material, 2018 to 2033
Figure 72: Western Europe Market Value Share (%) and BPS Analysis by Material, 2023 to 2033
Figure 73: Western Europe Market Y-o-Y Growth (%) Projections by Material, 2023 to 2033
Figure 74: Western Europe Market Value (US$ Million) Analysis by End-User, 2018 to 2033
Figure 75: Western Europe Market Value Share (%) and BPS Analysis by End-User, 2023 to 2033
Figure 76: Western Europe Market Y-o-Y Growth (%) Projections by End-User, 2023 to 2033
Figure 77: Western Europe Market Attractiveness by Implant, 2023 to 2033
Figure 78: Western Europe Market Attractiveness by Material, 2023 to 2033
Figure 79: Western Europe Market Attractiveness by End-User, 2023 to 2033
Figure 80: Western Europe Market Attractiveness by Country, 2023 to 2033
Figure 81: Eastern Europe Market Value (US$ Million) by Implant, 2023 to 2033
Figure 82: Eastern Europe Market Value (US$ Million) by Material, 2023 to 2033
Figure 83: Eastern Europe Market Value (US$ Million) by End-User, 2023 to 2033
Figure 84: Eastern Europe Market Value (US$ Million) by Country, 2023 to 2033
Figure 85: Eastern Europe Market Value (US$ Million) Analysis by Country, 2018 to 2033
Figure 86: Eastern Europe Market Value Share (%) and BPS Analysis by Country, 2023 to 2033
Figure 87: Eastern Europe Market Y-o-Y Growth (%) Projections by Country, 2023 to 2033
Figure 88: Eastern Europe Market Value (US$ Million) Analysis by Implant, 2018 to 2033
Figure 89: Eastern Europe Market Value Share (%) and BPS Analysis by Implant, 2023 to 2033
Figure 90: Eastern Europe Market Y-o-Y Growth (%) Projections by Implant, 2023 to 2033
Figure 91: Eastern Europe Market Value (US$ Million) Analysis by Material, 2018 to 2033
Figure 92: Eastern Europe Market Value Share (%) and BPS Analysis by Material, 2023 to 2033
Figure 93: Eastern Europe Market Y-o-Y Growth (%) Projections by Material, 2023 to 2033
Figure 94: Eastern Europe Market Value (US$ Million) Analysis by End-User, 2018 to 2033
Figure 95: Eastern Europe Market Value Share (%) and BPS Analysis by End-User, 2023 to 2033
Figure 96: Eastern Europe Market Y-o-Y Growth (%) Projections by End-User, 2023 to 2033
Figure 97: Eastern Europe Market Attractiveness by Implant, 2023 to 2033
Figure 98: Eastern Europe Market Attractiveness by Material, 2023 to 2033
Figure 99: Eastern Europe Market Attractiveness by End-User, 2023 to 2033
Figure 100: Eastern Europe Market Attractiveness by Country, 2023 to 2033
Figure 101: South Asia and Pacific Market Value (US$ Million) by Implant, 2023 to 2033
Figure 102: South Asia and Pacific Market Value (US$ Million) by Material, 2023 to 2033
Figure 103: South Asia and Pacific Market Value (US$ Million) by End-User, 2023 to 2033
Figure 104: South Asia and Pacific Market Value (US$ Million) by Country, 2023 to 2033
Figure 105: South Asia and Pacific Market Value (US$ Million) Analysis by Country, 2018 to 2033
Figure 106: South Asia and Pacific Market Value Share (%) and BPS Analysis by Country, 2023 to 2033
Figure 107: South Asia and Pacific Market Y-o-Y Growth (%) Projections by Country, 2023 to 2033
Figure 108: South Asia and Pacific Market Value (US$ Million) Analysis by Implant, 2018 to 2033
Figure 109: South Asia and Pacific Market Value Share (%) and BPS Analysis by Implant, 2023 to 2033
Figure 110: South Asia and Pacific Market Y-o-Y Growth (%) Projections by Implant, 2023 to 2033
Figure 111: South Asia and Pacific Market Value (US$ Million) Analysis by Material, 2018 to 2033
Figure 112: South Asia and Pacific Market Value Share (%) and BPS Analysis by Material, 2023 to 2033
Figure 113: South Asia and Pacific Market Y-o-Y Growth (%) Projections by Material, 2023 to 2033
Figure 114: South Asia and Pacific Market Value (US$ Million) Analysis by End-User, 2018 to 2033
Figure 115: South Asia and Pacific Market Value Share (%) and BPS Analysis by End-User, 2023 to 2033
Figure 116: South Asia and Pacific Market Y-o-Y Growth (%) Projections by End-User, 2023 to 2033
Figure 117: South Asia and Pacific Market Attractiveness by Implant, 2023 to 2033
Figure 118: South Asia and Pacific Market Attractiveness by Material, 2023 to 2033
Figure 119: South Asia and Pacific Market Attractiveness by End-User, 2023 to 2033
Figure 120: South Asia and Pacific Market Attractiveness by Country, 2023 to 2033
Figure 121: East Asia Market Value (US$ Million) by Implant, 2023 to 2033
Figure 122: East Asia Market Value (US$ Million) by Material, 2023 to 2033
Figure 123: East Asia Market Value (US$ Million) by End-User, 2023 to 2033
Figure 124: East Asia Market Value (US$ Million) by Country, 2023 to 2033
Figure 125: East Asia Market Value (US$ Million) Analysis by Country, 2018 to 2033
Figure 126: East Asia Market Value Share (%) and BPS Analysis by Country, 2023 to 2033
Figure 127: East Asia Market Y-o-Y Growth (%) Projections by Country, 2023 to 2033
Figure 128: East Asia Market Value (US$ Million) Analysis by Implant, 2018 to 2033
Figure 129: East Asia Market Value Share (%) and BPS Analysis by Implant, 2023 to 2033
Figure 130: East Asia Market Y-o-Y Growth (%) Projections by Implant, 2023 to 2033
Figure 131: East Asia Market Value (US$ Million) Analysis by Material, 2018 to 2033
Figure 132: East Asia Market Value Share (%) and BPS Analysis by Material, 2023 to 2033
Figure 133: East Asia Market Y-o-Y Growth (%) Projections by Material, 2023 to 2033
Figure 134: East Asia Market Value (US$ Million) Analysis by End-User, 2018 to 2033
Figure 135: East Asia Market Value Share (%) and BPS Analysis by End-User, 2023 to 2033
Figure 136: East Asia Market Y-o-Y Growth (%) Projections by End-User, 2023 to 2033
Figure 137: East Asia Market Attractiveness by Implant, 2023 to 2033
Figure 138: East Asia Market Attractiveness by Material, 2023 to 2033
Figure 139: East Asia Market Attractiveness by End-User, 2023 to 2033
Figure 140: East Asia Market Attractiveness by Country, 2023 to 2033
Figure 141: Middle East and Africa Market Value (US$ Million) by Implant, 2023 to 2033
Figure 142: Middle East and Africa Market Value (US$ Million) by Material, 2023 to 2033
Figure 143: Middle East and Africa Market Value (US$ Million) by End-User, 2023 to 2033
Figure 144: Middle East and Africa Market Value (US$ Million) by Country, 2023 to 2033
Figure 145: Middle East and Africa Market Value (US$ Million) Analysis by Country, 2018 to 2033
Figure 146: Middle East and Africa Market Value Share (%) and BPS Analysis by Country, 2023 to 2033
Figure 147: Middle East and Africa Market Y-o-Y Growth (%) Projections by Country, 2023 to 2033
Figure 148: Middle East and Africa Market Value (US$ Million) Analysis by Implant, 2018 to 2033
Figure 149: Middle East and Africa Market Value Share (%) and BPS Analysis by Implant, 2023 to 2033
Figure 150: Middle East and Africa Market Y-o-Y Growth (%) Projections by Implant, 2023 to 2033
Figure 151: Middle East and Africa Market Value (US$ Million) Analysis by Material, 2018 to 2033
Figure 152: Middle East and Africa Market Value Share (%) and BPS Analysis by Material, 2023 to 2033
Figure 153: Middle East and Africa Market Y-o-Y Growth (%) Projections by Material, 2023 to 2033
Figure 154: Middle East and Africa Market Value (US$ Million) Analysis by End-User, 2018 to 2033
Figure 155: Middle East and Africa Market Value Share (%) and BPS Analysis by End-User, 2023 to 2033
Figure 156: Middle East and Africa Market Y-o-Y Growth (%) Projections by End-User, 2023 to 2033
Figure 157: Middle East and Africa Market Attractiveness by Implant, 2023 to 2033
Figure 158: Middle East and Africa Market Attractiveness by Material, 2023 to 2033
Figure 159: Middle East and Africa Market Attractiveness by End-User, 2023 to 2033
Figure 160: Middle East and Africa Market Attractiveness by Country, 2023 to 2033
The overall market size for 3D Printed Hip and Knee Implants Market was USD 4,080.7 million in 2025.
The 3D Printed Hip and Knee Implants Market is expected to reach USD 7,953.7 million in 2035.
Advancements in 3D printing technology like electron beam melting, growing preference for customized implant are some factors.
The top key players that drives the development of 3D Printed Hip and Knee Implants Market are Stryker Corporation, Zimmer Biomet Holdings, Johnson & Johnson (DePuy Synthes), Smith &, Nephew plc and Medtronic plc.
Knee implants in 3D Printed Hip and Knee Implants market is expected to command significant share over the assessment period.
Explore Similar Insights
Thank you!
You will receive an email from our Business Development Manager. Please be sure to check your SPAM/JUNK folder too.