3D Reconstruction Technology Market Size and Share Forecast Outlook 2025 to 2035

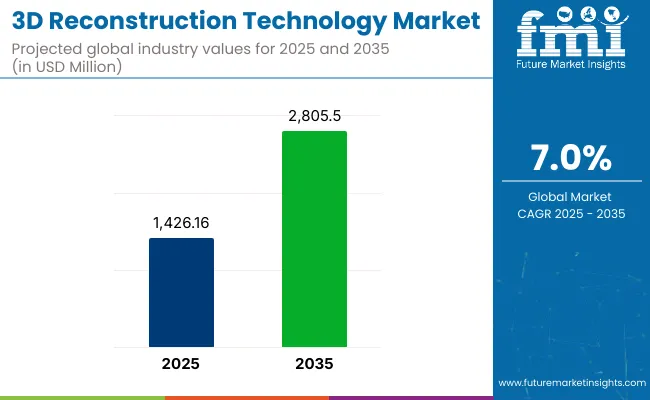
The 3D Reconstruction Technology Market is estimated to reach USD 1,426.16 million by 2025. Between 2025 and 2035, the market is expected to grow at a CAGR of 7.0%, reaching a total value of USD 2,805.5 million by the end of the assessment period.
Quick Stats for 3D Reconstruction Technology Market

  •  Industry Value (2025): USD 1,426.16 million
  • Forecast Value (2035): USD 2,805.5 million
  •  Forecast CAGR: 7.0%
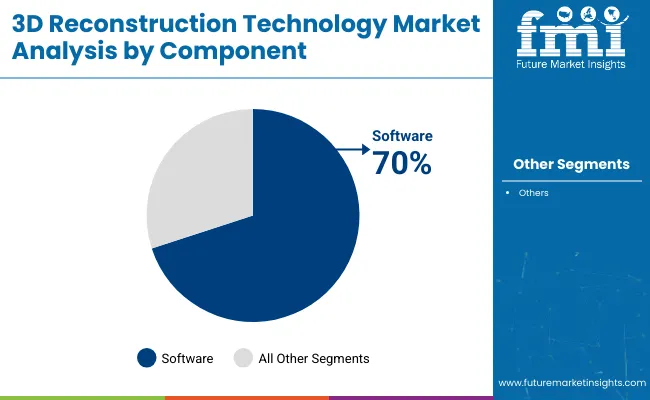
  • Leading Segment in 2025: Software Component (70% market share)
  • Key Growth Region: North America and Asia Pacific
  • Top Key Players:  Autodesk, Inc., EOS imaging, Matterport, Pix4D (Parrot Group), Agisoft Metashape, NVIDIA, Bentley Systems, Trimble Inc., Capturing Reality.

3d Reconstruction Technology Market

Attribute Values
Estimated Industry Size (2025E) USD 1,426.16 million
Projected Industry Value (2035F) USD 2,805.5 million
CAGR (2025 to 2035) 7.0%

The 3D reconstruction technology market is experiencing robust expansion, driven by accelerated adoption across industries such as healthcare, construction, entertainment, and autonomous systems. Investor presentations and corporate disclosures have indicated that demand has been strengthened by the need for precise digital replicas that enable simulation, visualization, and measurement in real time. Advances in photogrammetry, structured light scanning, and computer vision algorithms have significantly improved reconstruction accuracy and processing speed.

Regulatory support for digital transformation initiatives and funding for smart infrastructure projects have further incentivized the integration of 3D reconstruction capabilities into workflows. Cloud computing and AI-powered automation have been leveraged to reduce operational complexity and deliver scalable solutions to enterprises of all sizes. The future outlook is expected to be influenced by technological convergence with augmented reality, digital twins, and metaverse applications, reinforcing the strategic value of reconstruction platforms.
Analyzing3D Reconstruction Technology Market by Top Investment Segments

Software Leading the Component Segment

3d Reconstruction Technology Market By Component

In 2025, software is anticipated to hold a 70% revenue share in the 3D reconstruction technology market. This dominance has been attributed to the software’s pivotal role in capturing, processing, and rendering spatial data into high-fidelity 3D models.

The segment’s growth has been driven by continuous advances in machine learning algorithms and photogrammetric processing engines, which have enhanced accuracy and automation. Integration capabilities with CAD platforms and simulation tools have been recognized for improving cross-functional workflows in architecture, medical imaging, and industrial design.

The scalability of cloud-based reconstruction solutions has further supported adoption among enterprises seeking flexibility and cost efficiency. Regulatory encouragement for digital asset management and infrastructure modernization has also reinforced software demand. Collectively, these factors have secured software’s position as the primary revenue generator within the component segment.
Active 3D Reconstruction as the Dominant Type

3d Reconstruction Technology Market By Dominant Type

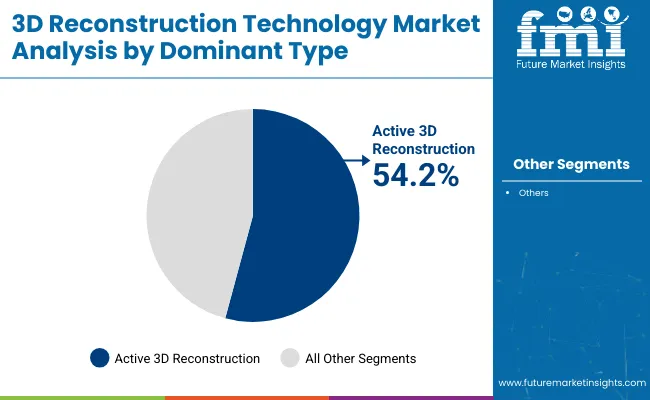
Active 3D reconstruction is projected to account for 54.2% of the market share in 2025. This segment’s leadership has been supported by its capacity to deliver highly accurate depth and surface data through technologies such as structured light and laser scanning. It has been observed that active methods are preferred in applications requiring consistent resolution and precision, including quality inspection, robotics, and heritage preservation.

Advancements in sensor miniaturization and data fusion techniques have been credited with improving usability and reducing system costs. The growing deployment of autonomous systems and intelligent machinery has further elevated the relevance of active reconstruction methods. Industry initiatives promoting standardization and interoperability have also been instrumental in sustaining demand. As a result, active 3D reconstruction has been positioned as a cornerstone technology for high-accuracy applications across industries.

Stakeholder-Based Insights on Emerging Trends in 3D Reconstruction Technology Adoption

(Survey Conducted in Q4 2024, n=500 stakeholder participants evenly distributed across software developers, hardware manufacturers, cloud service providers, and end users in the USA, Western Europe, China, Japan, and South Korea)

Key Priorities of Stakeholders

  • AI-Driven Automation: 79% of stakeholders globally identified AI-powered 3D modeling as a "critical" priority for reducing manual processing time and increasing scalability.
  • Cloud-Based Accessibility: 72% emphasized the need for seamless cloud integration to improve collaboration and data storage efficiency.

Regional Variance:

  • USA: 66% highlighted real-time 3D rendering for urban planning and gaming applications, compared to 48% in Japan.
  • Western Europe: 83% cited sustainability (energy-efficient processing, lower carbon footprint) as a key factor, against 59% in the USA
  • China: 70% prioritized AI-enhanced automation for smart city initiatives, significantly higher than 45% in South Korea.
  • Japan/South Korea: 62% focused on compact, high-precision models optimized for infrastructure and robotics applications, compared to 29% in the USA

Adoption of Advanced Technologies

High Variance:

  • USA: 58% of construction firms and city planners integrated LiDAR-based 3D scanning, driven by government-funded infrastructure projects.
  • Western Europe: 51% of survey participants used AI-enhanced photogrammetry, with Germany (65%) leading due to stringent digital twin policies.
  • China: 74% leveraged automated 3D modeling tools for industrial applications, significantly ahead of other regions.
  • Japan: Only 27% adopted AI-based reconstruction, attributing low adoption to high implementation costs and reliance on traditional modeling methods.
  • South Korea: 39% invested in AR/VR-driven 3D applications, particularly in entertainment and metaverse-related industries.

Convergent and Divergent Perspectives on ROI:

  • 73% of USA stakeholders found AI-driven 3D modeling to be “worth the investment,” whereas 41% in Japan still rely on legacy modeling techniques.

Challenges in Hardware & Supply Chain

Consensus:

  • LiDAR Sensor Shortages: 67% of stakeholders cited the rising cost and limited availability of high-precision LiDAR components as a major challenge.
  • Photogrammetry Processing Delays: 59% identified slow processing speeds in large-scale projects as a bottleneck for adoption.

Regional Variance:

  • Western Europe: 54% relied on local manufacturing for LiDAR components to reduce dependency on imports, compared to 32% in the USA
  • China: 69% reported stable hardware supply chains due to government-backed semiconductor investments.
  • Japan/South Korea: 47% preferred hybrid sensor solutions (LiDAR + photogrammetry) to balance cost and accuracy, compared to 22% in the USA

Pricing Sensitivity & Cost Pressures

Shared Challenges:

  • 85% cited rising hardware costs (LiDAR components up 25%, processing units up 18%) as a major concern.

Regional Differences:

  • USA/Western Europe: 64% were willing to pay a 20% premium for AI-driven automation, citing increased efficiency and reduced project timelines.
  • China: 72% preferred cost-effective AI solutions under USD 10,000, significantly lower than Western markets.
  • Japan/South Korea: 58% considered leasing models for high-cost 3D reconstruction tools, compared to only 15% in the USA

Pain Points in the Value Chain

Software Developers:

  • USA: 57% struggled with interoperability issues across different 3D modeling platforms.
  • Western Europe: 49% cited regulatory hurdles for integrating AI-powered solutions into public infrastructure projects.
  • China: 66% faced competition from state-backed AI-driven modeling firms.

Hardware Manufacturers:

  • USA: 62% reported semiconductor shortages affecting LiDAR production.
  • Japan/South Korea: 53% struggled with high R&D costs for next-gen compact sensors.

Cloud Service Providers:

  • Western Europe: 44% cited compliance challenges related to GDPR and data security laws.
  • China: 61% focused on government cloud adoption for large-scale smart city projects.

Future Investment Priorities

Alignment:

  • 76% of global stakeholders plan to invest in AI-enhanced automation and cloud-based 3D reconstruction.

Divergence:

  • USA: 63% are focusing on modular 3D modeling tools for flexible industry applications.
  • Western Europe: 59% are investing in energy-efficient processing techniques to meet sustainability targets.
  • China: 68% are prioritizing state-funded smart city AI modeling for nationwide infrastructure projects.
  • Japan/South Korea: 51% are investing in compact and lightweight sensor technologies for robotics and industrial automation.

Regulatory Impact

  • USA: 71% of stakeholders cited government-funded infrastructure initiatives as a growth driver for AI-based 3D reconstruction.
  • Western Europe: 84% viewed new EU digital twin regulations as a long-term growth enabler.
  • China: Only 39% saw regulations as a constraint as state-backed AI adoption accelerates.
  • Japan/South Korea: 35% reported slow regulatory action, delaying widespread AI adoption in 3D reconstruction.

Conclusion: Variance vs. Consensus

High Consensus:

AI-driven automation, cloud-based modeling, and cost pressures are common concerns worldwide.

Key Variances:

  • USA: Strong focus on automation and infrastructure-driven 3D modeling.
  • Western Europe: Leading in sustainability-focused 3D reconstruction.
  • China: Prioritizing AI-driven government-backed applications.
  • Japan/South Korea: Investing in compact and high-precision 3D solutions.

Strategic Insight:

A standardized approach will not work. Companies must adapt solutions regionally-AI and automation in the USA, sustainable processing in Europe, AI-led smart city modeling in China, and compact, high-precision solutions in Japan and South Korea.

For a deep dive into stakeholder priorities and customized strategic recommendations, contact FMI today and gain an edge in the evolving industry.

Impact of Government Regulations

Country Policies, Regulations & Mandatory Certifications
United States Government-funded infrastructure programs are accelerating the adoption of 3D reconstruction for urban planning. The National Institute of Standards and Technology (NIST) provides guidelines for digital twin applications. Strict FCC regulations govern LiDAR-based data collection, particularly for mapping and surveillance applications.
United Kingdom The National Digital Twin Programme mandates standardized 3D data integration for public infrastructure projects. GDPR compliance is required for cloud-based 3D modeling to ensure data privacy. Construction projects must adhere to Building Information Modeling (BIM) Level 2 regulations, requiring high-precision 3D models for public-sector developments.
France The BIM 2022 Mandate requires all public construction projects to use 3D modeling for efficiency and sustainability. CNIL (Commission Nationale de l'Informatique et des Libertés) enforces strict data privacy laws, impacting cloud-based 3D reconstruction platforms. LiDAR use in public spaces requires approval from the Ministry of Ecological Transition due to environmental concerns.
Germany The EU Digital Twin Strategy influences 3D reconstruction for smart cities and industrial automation. DIN EN ISO 19650 compliance is required for 3D modeling in large-scale projects. The Federal Cartography and Geodesy Agency regulates photogrammetry-based mapping for urban planning and infrastructure.
Italy The National Recovery and Resilience Plan (NRRP) encourages 3D reconstruction for heritage preservation and construction. UNI 11337-2017 certification is mandatory for digital modeling in public infrastructure. General Data Protection Regulation (GDPR) applies to cloud-based 3D applications.
South Korea The Smart City Act mandates AI-driven 3D reconstruction for urban development. Korean Spatial Information Quality Certification (K-SQC) is required for geospatial and mapping-based 3D modeling. Government incentives are offered for 3D reconstruction in robotics and industrial automation.
Japan The Digital Transformation Act promotes AI and 3D modeling in infrastructure projects. Japan BIM Standards (J-BIM) require standardized adoption of digital twins in construction. The Ministry of Land, Infrastructure, Transport, and Tourism (MLIT) regulates LiDAR and photogrammetry applications for public projects.
China The National AI Development Plan prioritizes 3D reconstruction for smart cities and defense applications. The Cybersecurity Law of China imposes strict data localization requirements on cloud-based 3D services. Companies must obtain Surveying and Mapping Qualification Certificates to conduct large-scale geospatial 3D modeling.
Australia & New Zealand The BIM Acceleration Committee enforces 3D modeling standards in public construction. New Zealand Geospatial Strategy regulates photogrammetry-based mapping. Privacy Act 2020 governs cloud-based 3D data storage and processing.

Market Analysis

The 3D reconstruction technology industry is set for robust growth, supported by the evolution of AI-based modeling, higher immersion in development and heritage protection and its applications in AR/VR and smart city projects.

Users of automation and cloud-based 3D reconstruction tools will be the beneficiaries, while the manual modeling method will be rendered unnecessary. High-precision 3D reconstruction services will only rise in demand as businesses place a value on effectiveness and digitalization.
Top 3 Strategic Imperatives for Stakeholders

3d Reconstruction Technology Market Top 3 Strategic Imperatives For Stakeholders

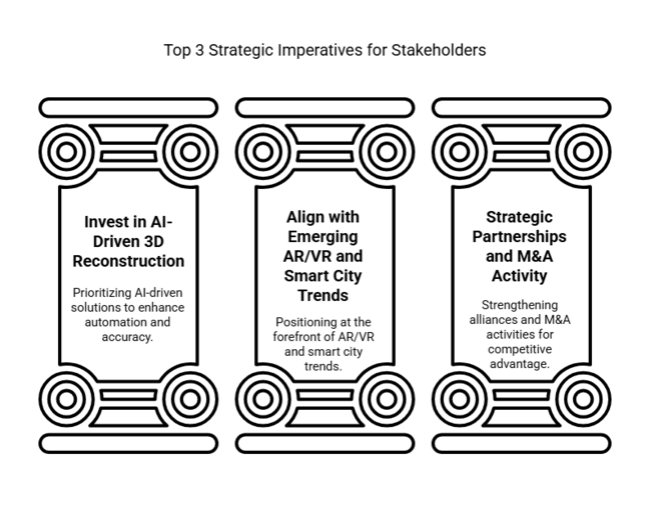
Invest in AI-Driven 3D Reconstruction

Executives should prioritize AI-powered modeling solutions to enhance automation, reduce processing time, and improve accuracy. Investing in machine learning and cloud-based platforms will enable seamless scalability and integration across industries.

Align with Emerging AR/VR and Smart City Trends

Companies must position themselves at the intersection of 3D reconstruction, augmented reality, and smart infrastructure development. Collaborating with urban planners, gaming studios, and metaverse developers will unlock new revenue streams and expand technological capabilities.

Strengthen Strategic Partnerships and M&A Activity

To stay competitive, businesses should pursue strategic alliances with hardware manufacturers, software developers, and cloud service providers. Mergers and acquisitions in niche 3D reconstruction segments will help consolidate expertise, enhance product portfolios, and accelerate innovation.

Top 3 Risks Stakeholders Should Monitor

Risk Probability & Impact
Supply Chain Disruptions in 3D Hardware - The industry's reliance on LiDAR sensors and photogrammetry equipment makes it vulnerable to semiconductor shortages, trade restrictions, and production bottlenecks. Limited component availability could delay project timelines and increase costs, necessitating diversified sourcing and supplier partnerships. High Probability, Severe Impact
Data Privacy & Security Concerns - The widespread adoption of cloud-based 3D reconstruction raises risks related to data breaches, intellectual property theft, and compliance with regional data protection laws. Strengthening cybersecurity frameworks and ensuring regulatory compliance will be essential to maintaining trust and mitigating legal risks. Moderate Probability, Significant Impact
Regulatory Challenges in Heritage & Infrastructure Projects - Stringent government policies on digital mapping, historical site documentation, and urban planning approvals can create project delays and compliance burdens. Proactive engagement with policymakers and aligning solutions with regulatory frameworks will be crucial for sustained growth. Moderate Probability, High Impact

Executive Watchlist

Priority Immediate Action
AI-Powered 3D Reconstruction Adoption Conduct feasibility studies on integrating generative AI for automated 3D modeling and rendering. Assess software capabilities, invest in AI-driven tools, and collaborate with tech firms to enhance automation and scalability.
Cloud Security & Compliance Strategy Implement enhanced encryption and regulatory frameworks to address data security concerns in cloud-based 3D reconstruction. Conduct cybersecurity audits, ensure compliance with regional data protection laws, and develop contingency plans for data breaches.
3D Hardware Supply Chain Resilience Develop alternative sourcing strategies and establish direct partnerships with LiDAR and photogrammetry hardware manufacturers. Secure long-term contracts, diversify supplier networks and explore localized manufacturing to mitigate component shortages and cost volatility.

For the Boardroom

To stay ahead, the companies must invest aggressively in AI-based 3D reconstruction, strengthen cloud security infrastructure as well as achieve long-term hardware supply chain stability. This insight points to automation direction, which needs to be ushered in with generative AI for improving modeling efficiency on an urgent basis.

Enhancing cybersecurity protocols is essential as cloud-based uptake widens, achieving compliance and confidence. The client also needs to diversify LiDAR and photogrammetry sources for protecting operations against supply chain dynamics.

By leveraging these priorities, the client can speed up innovation, lower operating risks, and seize upcoming opportunities in construction, heritage conservation as well as AR/VR technologies.

Country-wise Insights

USA

CAGR for the USA from 2025 to 2035 is projected at 7.8%. Strong government backing for smart infrastructure and adoption of the digital twin is fueling expansion. Increased investments in AI-driven 3D modeling for urban planning, construction, and forensic applications are creating lucrative opportunities.

The demand for high-resolution 3D models in construction is surging, particularly in large-scale commercial and residential projects. The adoption of LiDAR technology for geospatial mapping and heritage preservation has gained momentum. Additionally, the entertainment industry is utilizing 3D reconstruction for immersive gaming and virtual production in filmmaking.

Regulatory compliance and privacy laws, particularly regarding AI-driven surveillance applications, pose challenges. However, government funding and incentives for smart city projects provide sustained growth. Increasing collaboration between tech firms and research institutions is expected to drive innovation in automated reconstruction solutions.

UK

The CAGR for the UK from 2025 to 2035 is expected to be 7.2%. Adoption of digital twin technology in infrastructure development and compliance with BIM Level 2 regulations drive growth. Government initiatives to modernize urban planning and transportation further boost demand for advanced 3D modeling solutions.

The UK construction industry is integrating AI-based 3D modeling tools to enhance project efficiency and cost control. The cultural preservation sector is also leveraging 3D reconstruction for the digital archiving of historical sites. Moreover, media and entertainment companies are increasingly investing in 3D scanning for virtual and augmented reality applications.

Data protection laws such as GDPR create compliance challenges for cloud-based 3D services. However, strong public and private sector collaboration in research and innovation fosters technological advancements. Expanding investments in AI-powered automation and LiDAR technology is expected to solidify the UK’s position.

France

CAGR for France from 2025 to 2035 is projected at 7.0%. France’s ongoing BIM strategy and the EU Digital Twin Strategy are accelerating adoption across infrastructure, real estate, and cultural heritage sectors. Government investments in smart cities and historical site digitization further drive expansion.

The construction sector is experiencing high demand for automated 3D modeling tools, ensuring compliance with sustainability regulations. Meanwhile, France is leading Europe in utilizing 3D reconstruction for historic preservation, with advanced photogrammetry techniques being used to restore heritage sites such as Notre Dame. Growth is also evident in gaming and animation.

Stringent regulatory requirements for data privacy and security pose hurdles for cloud-based solutions. However, strong industry-government collaboration ensures continued innovation. France’s commitment to sustainability and smart city development will drive further advancements in AI-driven 3D technologies.

Germany

CAGR for Germany from 2025 to 2035 is projected at 7.0%. The country's leadership in precision engineering and manufacturing accelerates the adoption of industrial automation, construction, and geospatial applications. The EU Digital Twin Strategy further drives demand for high-accuracy 3D modeling solutions.

Germany’s construction sector is integrating advanced 3D modeling tools to enhance energy efficiency and structural safety. The automotive industry is also leveraging 3D reconstruction for prototyping and quality control. Additionally, government investments in smart city initiatives support the expansion of geospatial mapping applications.

Regulatory complexity, particularly in compliance with EU data protection laws, presents challenges. However, Germany’s focus on research-driven innovation fosters breakthroughs in AI-powered automation. Increased adoption of hybrid Photogrammetry-LiDAR solutions is expected to fuel long-term growth.

Italy

CAGR for Italy from 2025 to 2035 is forecasted at 6.5%. Investments in cultural heritage preservation and the National Recovery and Resilience Plan (NRRP) are major drivers. The growing adoption of 3D modeling in architecture and restoration projects further accelerates expansion.

Italy’s tourism and heritage sectors are utilizing 3D reconstruction for site restoration and digital archiving. The construction industry is also embracing AI-driven modeling tools for project optimization. Additionally, demand is increasing in medical imaging and virtual surgery planning, enhancing healthcare applications.

Challenges include limited technological infrastructure in certain regions and high costs of advanced 3D reconstruction systems. However, government-backed initiatives and rising private-sector investments in automation and AI are expected to bridge these gaps, ensuring steady growth.

South Korea

CAGR for South Korea from 2025 to 2035 is expected at 7.4%. The government’s Smart City Act and heavy investments in AI-driven urban planning solutions are major growth catalysts. Increased adoption in robotics, manufacturing, and digital healthcare further strengthens the sector.

South Korea’s gaming and entertainment industry is fueling demand for high-resolution 3D modeling. The country is also leading in robotic automation, utilizing 3D reconstruction for AI-driven industrial processes. Additionally, advancements in medical imaging are enhancing applications in virtual surgery and diagnostics.

Regulatory oversight on AI and data privacy presents challenges for cloud-based 3D services. However, ongoing investments in R&D and technological innovation continue to enhance competitiveness. Government-backed funding and corporate collaborations will drive future advancements.

Japan

The projected CAGR for Japan during the period from 2025 to 2035 is 6.3%. Further growth in infrastructure and automation is being spurred on by the Digital Transformation Act. And with the acceptance of robotics, AI-driven manufacturing, and work on cultural preservation, one further boost to growth emerges.

Japan's automotive and electronics industries are harnessing 3D reconstruction for product development and quality control. The nation is also embarking on investing in a digital twin for smart city purposes. What is trending also in Japan is healthcare applications such as 3D medical imaging and virtual surgery planning.

Still emerging are high costs and relatively slow adoption of cloud-based 3D reconstruction. However, these challenges are expected to be countered by R&D projects sponsored by the government and by cooperation between technology companies and research institutes to spur innovation and further growth.

China

The CAGR for China from 2025 to 2035 is estimated to be at 8.2%. The National AI Development Plan and smart city initiatives are driving rapid adoption of such systems. AI-driven automation and geospatial development leadership will further grease the wheel of acceleration.

The Chinese construction industry is now integrating 3D reconstruction in large-scale urban developments. Similarly, the high-resolution 3D modeling offered by the manufacturing industry is being used for automation and AI-powered quality control. Furthermore, the surge in demand for 3D imaging for e-commerce and virtual retail applications is further bolstering industry prospects.

Strict adherence to data localization and cybersecurity laws has posed several hurdles for cloud applications; nevertheless, robust support from the government for AI and automation would ensure sustained growth. Investment in AI photogrammetry and LiDAR applications will further condition the acceleration.

Competition Outlook

The 3D reconstruction technology market is highly dynamic and innovation-driven, spanning applications in architecture, construction, healthcare imaging, gaming, autonomous navigation, and digital twins. Leading companies are investing in advanced photogrammetry, LiDAR integration, and AI-powered reconstruction pipelines to improve accuracy, scalability, and automation of 3D model generation.

Strategic acquisitions, cross-platform integrations, and partnerships with hardware manufacturers and enterprise software providers are central to expanding adoption across industries. Additionally, demand for real-time 3D capture, cloud-based collaboration, and immersive visualization tools is fueling growth in both professional and consumer segments. Emphasis on end-to-end workflows, GPU acceleration, and compatibility with AR/VR ecosystems is reshaping competitive differentiation.

Key Development

In 2025, 3D Systems announced the world's first Medical Device Regulation (MDR)-compliant 3D-printed PEEK facial implant manufactured at the point-of-care. In collaboration with the University Hospital Basel, the implant was designed and produced using 3D Systems’ EXT 220 MED printer, enabling tailored, efficient, and potentially lower-cost patient-specific solutions in maxillofacial reconstruction.

In 2025, Johnson & Johnson MedTech's digital orthopaedics innovations, including VELYS™ robotics for knees and spine, and TRUMATCH™ for shoulders, implicitly leverage 3D reconstruction technology. This enables precise surgical planning and guidance by converting patient imaging data into detailed 3D anatomical models, enhancing personalized care and efficiency.

Companies

  • Autodesk, Inc.
  • Koninklijke Philips NV
  • Matterport
  • Pix4D (Parrot Group)
  • Agisoft Metashape
  • NVIDIA
  • Bentley Systems
  • Trimble Inc.
  • Capturing Reality
  • Photoneo
  • Topcon Corporation
  • Hexagon AB
  • Esri
  • Intel RealSense
  • Paracosm
  • SCANTECH
  • Vi3Dim Technologies
  • GeoSLAM
  • 3Dflow
  • Siemens Digital Industries Software
  • EOS Imaging
  • NavVis
  • Skyline Software Systems Inc.
  • 3DHISTECH Ltd.
  • BioVis3D
  • Reconstruct Me
  • ELCOVISION 10

Key Segments

By Component:

By component, the industry is segmented into software and services.

By Type:

In terms of type, the industry is segmented into active 3D reconstruction and passive 3D reconstruction.

By Enterprise Size:

Based on enterprise size, the industry is segmented into large enterprises and SMEs.

By Deployment Model:

By Deployment Model, the industry is segmented into On-premise and Cloud.

By Application:

In terms of application, the industry is segmented into Education, Healthcare, Aerospace & Defense, Media & Entertainment, Construction & Architecture, and Government & Public Safety.

By Region:

The industry is segmented by region into North America, Latin America, Western Europe, South Asia & Pacific, East Asia, Middle East, and Africa.

Table of Content

  1. Executive Summary
  2. Market Overview
  3. Market Background
  4. Global Market Analysis 2020 to 2024 and Forecast, 2025 to 2035
  5. Global Market Analysis 2020 to 2024 and Forecast 2025 to 2035, By Component
    • Software
    • Services
  6. Global Market Analysis 2020 to 2024 and Forecast 2025 to 2035, By Type
    • Active 3D Reconstruction
    • Passive 3D Reconstruction
  7. Global Market Analysis 2020 to 2024 and Forecast 2025 to 2035, By Enterprise Size
    • Large Enterprise
    • SMEs
  8. Global Market Analysis 2020 to 2024 and Forecast 2025 to 2035, By Deployment Model
    • On-premise
    • Cloud
  9. Global Market Analysis 2020 to 2024 and Forecast 2025 to 2035, By Application
    • Education
    • Healthcare
    • Aerospace & Defense
    • Media & Entertainment
    • Construction & Architecture
    • Government & Public Safety
  10. Global Market Analysis 2020 to 2024 and Forecast 2025 to 2035, By Region
    • North America
    • Latin America
    • Europe
    • South Asia
    • East Asia
    • Oceania
    • MEA
  11. North America Market Analysis 2020 to 2024 and Forecast 2025 to 2035, By Country
  12. Latin America Market Analysis 2020 to 2024 and Forecast 2025 to 2035, By Country
  13. Europe Market Analysis 2020 to 2024 and Forecast 2025 to 2035, By Country
  14. South Asia Market Analysis 2020 to 2024 and Forecast 2025 to 2035, By Country
  15. East Asia Market Analysis 2020 to 2024 and Forecast 2025 to 2035, By Country
  16. Oceania Market Analysis 2020 to 2024 and Forecast 2025 to 2035, By Country
  17. MEA Market Analysis 2020 to 2024 and Forecast 2025 to 2035, By Country
  18. Key Countries Market Analysis
  19. Market Structure Analysis
  20. Competition Analysis
    • Autodesk, Inc.
    • Epic Games (RealityCapture)
    • Matterport
    • Pix4D (Parrot Group)
    • Agisoft Metashape
    • NVIDIA
    • Bentley Systems
    • Trimble Inc.
    • Capturing Reality
    • Photoneo
    • Topcon Corporation
    • Hexagon AB
    • Esri
    • Intel RealSense
    • Paracosm
    • SCANTECH
    • Vi3Dim Technologies
    • GeoSLAM
    • 3Dflow
    • Siemens Digital Industries Software
    • EOS Imaging
    • NavVis
    • Skyline Software Systems Inc.
    • 3DHISTECH Ltd.
    • BioVis3D
    • Reconstruct Me
    • ELCOVISION 10
  21. Assumptions & Acronyms Used
  22. Research Methodology

List of Tables

  • Table 1: Global Market Value (USD Million) Forecast by Region, 2020 to 2035
  • Table 2: Global Market Value (USD Million) Forecast by Component, 2020 to 2035
  • Table 3: Global Market Value (USD Million) Forecast by Type, 2020 to 2035
  • Table 4: Global Market Value (USD Million) Forecast by Enterprise Size, 2020 to 2035
  • Table 5: Global Market Value (USD Million) Forecast by Deployment Model, 2020 to 2035
  • Table 6: Global Market Value (USD Million) Forecast by Application, 2020 to 2035
  • Table 7: North America Market Value (USD Million) Forecast by Country, 2020 to 2035
  • Table 8: North America Market Value (USD Million) Forecast by Component, 2020 to 2035
  • Table 9: North America Market Value (USD Million) Forecast by Type, 2020 to 2035
  • Table 10: North America Market Value (USD Million) Forecast by Enterprise Size, 2020 to 2035
  • Table 11: North America Market Value (USD Million) Forecast by Deployment Model, 2020 to 2035
  • Table 12: North America Market Value (USD Million) Forecast by Application, 2020 to 2035
  • Table 13: Latin America Market Value (USD Million) Forecast by Country, 2020 to 2035
  • Table 14: Latin America Market Value (USD Million) Forecast by Component, 2020 to 2035
  • Table 15: Latin America Market Value (USD Million) Forecast by Type, 2020 to 2035
  • Table 16: Latin America Market Value (USD Million) Forecast by Enterprise Size, 2020 to 2035
  • Table 17: Latin America Market Value (USD Million) Forecast by Deployment Model, 2020 to 2035
  • Table 18: Latin America Market Value (USD Million) Forecast by Application, 2020 to 2035
  • Table 19: Europe Market Value (USD Million) Forecast by Country, 2020 to 2035
  • Table 20: Europe Market Value (USD Million) Forecast by Component, 2020 to 2035
  • Table 21: Europe Market Value (USD Million) Forecast by Type, 2020 to 2035
  • Table 22: Europe Market Value (USD Million) Forecast by Enterprise Size, 2020 to 2035
  • Table 23: Europe Market Value (USD Million) Forecast by Deployment Model, 2020 to 2035
  • Table 24: Europe Market Value (USD Million) Forecast by Application, 2020 to 2035
  • Table 25: South Asia Market Value (USD Million) Forecast by Country, 2020 to 2035
  • Table 26: South Asia Market Value (USD Million) Forecast by Component, 2020 to 2035
  • Table 27: South Asia Market Value (USD Million) Forecast by Type, 2020 to 2035
  • Table 28: South Asia Market Value (USD Million) Forecast by Enterprise Size, 2020 to 2035
  • Table 29: South Asia Market Value (USD Million) Forecast by Deployment Model, 2020 to 2035
  • Table 30: South Asia Market Value (USD Million) Forecast by Application, 2020 to 2035
  • Table 31: East Asia Market Value (USD Million) Forecast by Country, 2020 to 2035
  • Table 32: East Asia Market Value (USD Million) Forecast by Component, 2020 to 2035
  • Table 33: East Asia Market Value (USD Million) Forecast by Type, 2020 to 2035
  • Table 34: East Asia Market Value (USD Million) Forecast by Enterprise Size, 2020 to 2035
  • Table 35: East Asia Market Value (USD Million) Forecast by Deployment Model, 2020 to 2035
  • Table 36: East Asia Market Value (USD Million) Forecast by Application, 2020 to 2035
  • Table 37: Oceania Market Value (USD Million) Forecast by Country, 2020 to 2035
  • Table 38: Oceania Market Value (USD Million) Forecast by Component, 2020 to 2035
  • Table 39: Oceania Market Value (USD Million) Forecast by Type, 2020 to 2035
  • Table 40: Oceania Market Value (USD Million) Forecast by Enterprise Size, 2020 to 2035
  • Table 41: Oceania Market Value (USD Million) Forecast by Deployment Model, 2020 to 2035
  • Table 42: Oceania Market Value (USD Million) Forecast by Application, 2020 to 2035
  • Table 43: MEA Market Value (USD Million) Forecast by Country, 2020 to 2035
  • Table 44: MEA Market Value (USD Million) Forecast by Component, 2020 to 2035
  • Table 45: MEA Market Value (USD Million) Forecast by Type, 2020 to 2035
  • Table 46: MEA Market Value (USD Million) Forecast by Enterprise Size, 2020 to 2035
  • Table 47: MEA Market Value (USD Million) Forecast by Deployment Model, 2020 to 2035
  • Table 48: MEA Market Value (USD Million) Forecast by Application, 2020 to 2035

List of Figures

  • Figure 1: Global Market Value (USD Million) by Component, 2025 to 2035
  • Figure 2: Global Market Value (USD Million) by Type, 2025 to 2035
  • Figure 3: Global Market Value (USD Million) by Enterprise Size, 2025 to 2035
  • Figure 4: Global Market Value (USD Million) by Deployment Model, 2025 to 2035
  • Figure 5: Global Market Value (USD Million) by Application, 2025 to 2035
  • Figure 6: Global Market Value (USD Million) by Region, 2025 to 2035
  • Figure 7: Global Market Value (USD Million) Analysis by Region, 2020 to 2035
  • Figure 8: Global Market Value Share (%) and BPS Analysis by Region, 2025 to 2035
  • Figure 9: Global Market Y-o-Y Growth (%) Projections by Region, 2025 to 2035
  • Figure 10: Global Market Value (USD Million) Analysis by Component, 2020 to 2035
  • Figure 11: Global Market Value Share (%) and BPS Analysis by Component, 2025 to 2035
  • Figure 12: Global Market Y-o-Y Growth (%) Projections by Component, 2025 to 2035
  • Figure 13: Global Market Value (USD Million) Analysis by Type, 2020 to 2035
  • Figure 14: Global Market Value Share (%) and BPS Analysis by Type, 2025 to 2035
  • Figure 15: Global Market Y-o-Y Growth (%) Projections by Type, 2025 to 2035
  • Figure 16: Global Market Value (USD Million) Analysis by Enterprise Size, 2020 to 2035
  • Figure 17: Global Market Value Share (%) and BPS Analysis by Enterprise Size, 2025 to 2035
  • Figure 18: Global Market Y-o-Y Growth (%) Projections by Enterprise Size, 2025 to 2035
  • Figure 19: Global Market Value (USD Million) Analysis by Deployment Model, 2020 to 2035
  • Figure 20: Global Market Value Share (%) and BPS Analysis by Deployment Model, 2025 to 2035
  • Figure 21: Global Market Y-o-Y Growth (%) Projections by Deployment Model, 2025 to 2035
  • Figure 22: Global Market Value (USD Million) Analysis by Application, 2020 to 2035
  • Figure 23: Global Market Value Share (%) and BPS Analysis by Application, 2025 to 2035
  • Figure 24: Global Market Y-o-Y Growth (%) Projections by Application, 2025 to 2035
  • Figure 25: Global Market Attractiveness by Component, 2025 to 2035
  • Figure 26: Global Market Attractiveness by Type, 2025 to 2035
  • Figure 27: Global Market Attractiveness by Enterprise Size, 2025 to 2035
  • Figure 28: Global Market Attractiveness by Deployment Model, 2025 to 2035
  • Figure 29: Global Market Attractiveness by Application, 2025 to 2035
  • Figure 30: Global Market Attractiveness by Region, 2025 to 2035
  • Figure 31: North America Market Value (USD Million) by Component, 2025 to 2035
  • Figure 32: North America Market Value (USD Million) by Type, 2025 to 2035
  • Figure 33: North America Market Value (USD Million) by Enterprise Size, 2025 to 2035
  • Figure 34: North America Market Value (USD Million) by Deployment Model, 2025 to 2035
  • Figure 35: North America Market Value (USD Million) by Application, 2025 to 2035
  • Figure 36: North America Market Value (USD Million) by Country, 2025 to 2035
  • Figure 37: North America Market Value (USD Million) Analysis by Country, 2020 to 2035
  • Figure 38: North America Market Value Share (%) and BPS Analysis by Country, 2025 to 2035
  • Figure 39: North America Market Y-o-Y Growth (%) Projections by Country, 2025 to 2035
  • Figure 40: North America Market Value (USD Million) Analysis by Component, 2020 to 2035
  • Figure 41: North America Market Value Share (%) and BPS Analysis by Component, 2025 to 2035
  • Figure 42: North America Market Y-o-Y Growth (%) Projections by Component, 2025 to 2035
  • Figure 43: North America Market Value (USD Million) Analysis by Type, 2020 to 2035
  • Figure 44: North America Market Value Share (%) and BPS Analysis by Type, 2025 to 2035
  • Figure 45: North America Market Y-o-Y Growth (%) Projections by Type, 2025 to 2035
  • Figure 46: North America Market Value (USD Million) Analysis by Enterprise Size, 2020 to 2035
  • Figure 47: North America Market Value Share (%) and BPS Analysis by Enterprise Size, 2025 to 2035
  • Figure 48: North America Market Y-o-Y Growth (%) Projections by Enterprise Size, 2025 to 2035
  • Figure 49: North America Market Value (USD Million) Analysis by Deployment Model, 2020 to 2035
  • Figure 50: North America Market Value Share (%) and BPS Analysis by Deployment Model, 2025 to 2035
  • Figure 51: North America Market Y-o-Y Growth (%) Projections by Deployment Model, 2025 to 2035
  • Figure 52: North America Market Value (USD Million) Analysis by Application, 2020 to 2035
  • Figure 53: North America Market Value Share (%) and BPS Analysis by Application, 2025 to 2035
  • Figure 54: North America Market Y-o-Y Growth (%) Projections by Application, 2025 to 2035
  • Figure 55: North America Market Attractiveness by Component, 2025 to 2035
  • Figure 56: North America Market Attractiveness by Type, 2025 to 2035
  • Figure 57: North America Market Attractiveness by Enterprise Size, 2025 to 2035
  • Figure 58: North America Market Attractiveness by Deployment Model, 2025 to 2035
  • Figure 59: North America Market Attractiveness by Application, 2025 to 2035
  • Figure 60: North America Market Attractiveness by Country, 2025 to 2035
  • Figure 61: Latin America Market Value (USD Million) by Component, 2025 to 2035
  • Figure 62: Latin America Market Value (USD Million) by Type, 2025 to 2035
  • Figure 63: Latin America Market Value (USD Million) by Enterprise Size, 2025 to 2035
  • Figure 64: Latin America Market Value (USD Million) by Deployment Model, 2025 to 2035
  • Figure 65: Latin America Market Value (USD Million) by Application, 2025 to 2035
  • Figure 66: Latin America Market Value (USD Million) by Country, 2025 to 2035
  • Figure 67: Latin America Market Value (USD Million) Analysis by Country, 2020 to 2035
  • Figure 68: Latin America Market Value Share (%) and BPS Analysis by Country, 2025 to 2035
  • Figure 69: Latin America Market Y-o-Y Growth (%) Projections by Country, 2025 to 2035
  • Figure 70: Latin America Market Value (USD Million) Analysis by Component, 2020 to 2035
  • Figure 71: Latin America Market Value Share (%) and BPS Analysis by Component, 2025 to 2035
  • Figure 72: Latin America Market Y-o-Y Growth (%) Projections by Component, 2025 to 2035
  • Figure 73: Latin America Market Value (USD Million) Analysis by Type, 2020 to 2035
  • Figure 74: Latin America Market Value Share (%) and BPS Analysis by Type, 2025 to 2035
  • Figure 75: Latin America Market Y-o-Y Growth (%) Projections by Type, 2025 to 2035
  • Figure 76: Latin America Market Value (USD Million) Analysis by Enterprise Size, 2020 to 2035
  • Figure 77: Latin America Market Value Share (%) and BPS Analysis by Enterprise Size, 2025 to 2035
  • Figure 78: Latin America Market Y-o-Y Growth (%) Projections by Enterprise Size, 2025 to 2035
  • Figure 79: Latin America Market Value (USD Million) Analysis by Deployment Model, 2020 to 2035
  • Figure 80: Latin America Market Value Share (%) and BPS Analysis by Deployment Model, 2025 to 2035
  • Figure 81: Latin America Market Y-o-Y Growth (%) Projections by Deployment Model, 2025 to 2035
  • Figure 82: Latin America Market Value (USD Million) Analysis by Application, 2020 to 2035
  • Figure 83: Latin America Market Value Share (%) and BPS Analysis by Application, 2025 to 2035
  • Figure 84: Latin America Market Y-o-Y Growth (%) Projections by Application, 2025 to 2035
  • Figure 85: Latin America Market Attractiveness by Component, 2025 to 2035
  • Figure 86: Latin America Market Attractiveness by Type, 2025 to 2035
  • Figure 87: Latin America Market Attractiveness by Enterprise Size, 2025 to 2035
  • Figure 88: Latin America Market Attractiveness by Deployment Model, 2025 to 2035
  • Figure 89: Latin America Market Attractiveness by Application, 2025 to 2035
  • Figure 90: Latin America Market Attractiveness by Country, 2025 to 2035
  • Figure 91: Europe Market Value (USD Million) by Component, 2025 to 2035
  • Figure 92: Europe Market Value (USD Million) by Type, 2025 to 2035
  • Figure 93: Europe Market Value (USD Million) by Enterprise Size, 2025 to 2035
  • Figure 94: Europe Market Value (USD Million) by Deployment Model, 2025 to 2035
  • Figure 95: Europe Market Value (USD Million) by Application, 2025 to 2035
  • Figure 96: Europe Market Value (USD Million) by Country, 2025 to 2035
  • Figure 97: Europe Market Value (USD Million) Analysis by Country, 2020 to 2035
  • Figure 98: Europe Market Value Share (%) and BPS Analysis by Country, 2025 to 2035
  • Figure 99: Europe Market Y-o-Y Growth (%) Projections by Country, 2025 to 2035
  • Figure 100: Europe Market Value (USD Million) Analysis by Component, 2020 to 2035
  • Figure 101: Europe Market Value Share (%) and BPS Analysis by Component, 2025 to 2035
  • Figure 102: Europe Market Y-o-Y Growth (%) Projections by Component, 2025 to 2035
  • Figure 103: Europe Market Value (USD Million) Analysis by Type, 2020 to 2035
  • Figure 104: Europe Market Value Share (%) and BPS Analysis by Type, 2025 to 2035
  • Figure 105: Europe Market Y-o-Y Growth (%) Projections by Type, 2025 to 2035
  • Figure 106: Europe Market Value (USD Million) Analysis by Enterprise Size, 2020 to 2035
  • Figure 107: Europe Market Value Share (%) and BPS Analysis by Enterprise Size, 2025 to 2035
  • Figure 108: Europe Market Y-o-Y Growth (%) Projections by Enterprise Size, 2025 to 2035
  • Figure 109: Europe Market Value (USD Million) Analysis by Deployment Model, 2020 to 2035
  • Figure 110: Europe Market Value Share (%) and BPS Analysis by Deployment Model, 2025 to 2035
  • Figure 111: Europe Market Y-o-Y Growth (%) Projections by Deployment Model, 2025 to 2035
  • Figure 112: Europe Market Value (USD Million) Analysis by Application, 2020 to 2035
  • Figure 113: Europe Market Value Share (%) and BPS Analysis by Application, 2025 to 2035
  • Figure 114: Europe Market Y-o-Y Growth (%) Projections by Application, 2025 to 2035
  • Figure 115: Europe Market Attractiveness by Component, 2025 to 2035
  • Figure 116: Europe Market Attractiveness by Type, 2025 to 2035
  • Figure 117: Europe Market Attractiveness by Enterprise Size, 2025 to 2035
  • Figure 118: Europe Market Attractiveness by Deployment Model, 2025 to 2035
  • Figure 119: Europe Market Attractiveness by Application, 2025 to 2035
  • Figure 120: Europe Market Attractiveness by Country, 2025 to 2035
  • Figure 121: South Asia Market Value (USD Million) by Component, 2025 to 2035
  • Figure 122: South Asia Market Value (USD Million) by Type, 2025 to 2035
  • Figure 123: South Asia Market Value (USD Million) by Enterprise Size, 2025 to 2035
  • Figure 124: South Asia Market Value (USD Million) by Deployment Model, 2025 to 2035
  • Figure 125: South Asia Market Value (USD Million) by Application, 2025 to 2035
  • Figure 126: South Asia Market Value (USD Million) by Country, 2025 to 2035
  • Figure 127: South Asia Market Value (USD Million) Analysis by Country, 2020 to 2035
  • Figure 128: South Asia Market Value Share (%) and BPS Analysis by Country, 2025 to 2035
  • Figure 129: South Asia Market Y-o-Y Growth (%) Projections by Country, 2025 to 2035
  • Figure 130: South Asia Market Value (USD Million) Analysis by Component, 2020 to 2035
  • Figure 131: South Asia Market Value Share (%) and BPS Analysis by Component, 2025 to 2035
  • Figure 132: South Asia Market Y-o-Y Growth (%) Projections by Component, 2025 to 2035
  • Figure 133: South Asia Market Value (USD Million) Analysis by Type, 2020 to 2035
  • Figure 134: South Asia Market Value Share (%) and BPS Analysis by Type, 2025 to 2035
  • Figure 135: South Asia Market Y-o-Y Growth (%) Projections by Type, 2025 to 2035
  • Figure 136: South Asia Market Value (USD Million) Analysis by Enterprise Size, 2020 to 2035
  • Figure 137: South Asia Market Value Share (%) and BPS Analysis by Enterprise Size, 2025 to 2035
  • Figure 138: South Asia Market Y-o-Y Growth (%) Projections by Enterprise Size, 2025 to 2035
  • Figure 139: South Asia Market Value (USD Million) Analysis by Deployment Model, 2020 to 2035
  • Figure 140: South Asia Market Value Share (%) and BPS Analysis by Deployment Model, 2025 to 2035
  • Figure 141: South Asia Market Y-o-Y Growth (%) Projections by Deployment Model, 2025 to 2035
  • Figure 142: South Asia Market Value (USD Million) Analysis by Application, 2020 to 2035
  • Figure 143: South Asia Market Value Share (%) and BPS Analysis by Application, 2025 to 2035
  • Figure 144: South Asia Market Y-o-Y Growth (%) Projections by Application, 2025 to 2035
  • Figure 145: South Asia Market Attractiveness by Component, 2025 to 2035
  • Figure 146: South Asia Market Attractiveness by Type, 2025 to 2035
  • Figure 147: South Asia Market Attractiveness by Enterprise Size, 2025 to 2035
  • Figure 148: South Asia Market Attractiveness by Deployment Model, 2025 to 2035
  • Figure 149: South Asia Market Attractiveness by Application, 2025 to 2035
  • Figure 150: South Asia Market Attractiveness by Country, 2025 to 2035
  • Figure 151: East Asia Market Value (USD Million) by Component, 2025 to 2035
  • Figure 152: East Asia Market Value (USD Million) by Type, 2025 to 2035
  • Figure 153: East Asia Market Value (USD Million) by Enterprise Size, 2025 to 2035
  • Figure 154: East Asia Market Value (USD Million) by Deployment Model, 2025 to 2035
  • Figure 155: East Asia Market Value (USD Million) by Application, 2025 to 2035
  • Figure 156: East Asia Market Value (USD Million) by Country, 2025 to 2035
  • Figure 157: East Asia Market Value (USD Million) Analysis by Country, 2020 to 2035
  • Figure 158: East Asia Market Value Share (%) and BPS Analysis by Country, 2025 to 2035
  • Figure 159: East Asia Market Y-o-Y Growth (%) Projections by Country, 2025 to 2035
  • Figure 160: East Asia Market Value (USD Million) Analysis by Component, 2020 to 2035
  • Figure 161: East Asia Market Value Share (%) and BPS Analysis by Component, 2025 to 2035
  • Figure 162: East Asia Market Y-o-Y Growth (%) Projections by Component, 2025 to 2035
  • Figure 163: East Asia Market Value (USD Million) Analysis by Type, 2020 to 2035
  • Figure 164: East Asia Market Value Share (%) and BPS Analysis by Type, 2025 to 2035
  • Figure 165: East Asia Market Y-o-Y Growth (%) Projections by Type, 2025 to 2035
  • Figure 166: East Asia Market Value (USD Million) Analysis by Enterprise Size, 2020 to 2035
  • Figure 167: East Asia Market Value Share (%) and BPS Analysis by Enterprise Size, 2025 to 2035
  • Figure 168: East Asia Market Y-o-Y Growth (%) Projections by Enterprise Size, 2025 to 2035
  • Figure 169: East Asia Market Value (USD Million) Analysis by Deployment Model, 2020 to 2035
  • Figure 170: East Asia Market Value Share (%) and BPS Analysis by Deployment Model, 2025 to 2035
  • Figure 171: East Asia Market Y-o-Y Growth (%) Projections by Deployment Model, 2025 to 2035
  • Figure 172: East Asia Market Value (USD Million) Analysis by Application, 2020 to 2035
  • Figure 173: East Asia Market Value Share (%) and BPS Analysis by Application, 2025 to 2035
  • Figure 174: East Asia Market Y-o-Y Growth (%) Projections by Application, 2025 to 2035
  • Figure 175: East Asia Market Attractiveness by Component, 2025 to 2035
  • Figure 176: East Asia Market Attractiveness by Type, 2025 to 2035
  • Figure 177: East Asia Market Attractiveness by Enterprise Size, 2025 to 2035
  • Figure 178: East Asia Market Attractiveness by Deployment Model, 2025 to 2035
  • Figure 179: East Asia Market Attractiveness by Application, 2025 to 2035
  • Figure 180: East Asia Market Attractiveness by Country, 2025 to 2035
  • Figure 181: Oceania Market Value (USD Million) by Component, 2025 to 2035
  • Figure 182: Oceania Market Value (USD Million) by Type, 2025 to 2035
  • Figure 183: Oceania Market Value (USD Million) by Enterprise Size, 2025 to 2035
  • Figure 184: Oceania Market Value (USD Million) by Deployment Model, 2025 to 2035
  • Figure 185: Oceania Market Value (USD Million) by Application, 2025 to 2035
  • Figure 186: Oceania Market Value (USD Million) by Country, 2025 to 2035
  • Figure 187: Oceania Market Value (USD Million) Analysis by Country, 2020 to 2035
  • Figure 188: Oceania Market Value Share (%) and BPS Analysis by Country, 2025 to 2035
  • Figure 189: Oceania Market Y-o-Y Growth (%) Projections by Country, 2025 to 2035
  • Figure 190: Oceania Market Value (USD Million) Analysis by Component, 2020 to 2035
  • Figure 191: Oceania Market Value Share (%) and BPS Analysis by Component, 2025 to 2035
  • Figure 192: Oceania Market Y-o-Y Growth (%) Projections by Component, 2025 to 2035
  • Figure 193: Oceania Market Value (USD Million) Analysis by Type, 2020 to 2035
  • Figure 194: Oceania Market Value Share (%) and BPS Analysis by Type, 2025 to 2035
  • Figure 195: Oceania Market Y-o-Y Growth (%) Projections by Type, 2025 to 2035
  • Figure 196: Oceania Market Value (USD Million) Analysis by Enterprise Size, 2020 to 2035
  • Figure 197: Oceania Market Value Share (%) and BPS Analysis by Enterprise Size, 2025 to 2035
  • Figure 198: Oceania Market Y-o-Y Growth (%) Projections by Enterprise Size, 2025 to 2035
  • Figure 199: Oceania Market Value (USD Million) Analysis by Deployment Model, 2020 to 2035
  • Figure 200: Oceania Market Value Share (%) and BPS Analysis by Deployment Model, 2025 to 2035
  • Figure 201: Oceania Market Y-o-Y Growth (%) Projections by Deployment Model, 2025 to 2035
  • Figure 202: Oceania Market Value (USD Million) Analysis by Application, 2020 to 2035
  • Figure 203: Oceania Market Value Share (%) and BPS Analysis by Application, 2025 to 2035
  • Figure 204: Oceania Market Y-o-Y Growth (%) Projections by Application, 2025 to 2035
  • Figure 205: Oceania Market Attractiveness by Component, 2025 to 2035
  • Figure 206: Oceania Market Attractiveness by Type, 2025 to 2035
  • Figure 207: Oceania Market Attractiveness by Enterprise Size, 2025 to 2035
  • Figure 208: Oceania Market Attractiveness by Deployment Model, 2025 to 2035
  • Figure 209: Oceania Market Attractiveness by Application, 2025 to 2035
  • Figure 210: Oceania Market Attractiveness by Country, 2025 to 2035
  • Figure 211: MEA Market Value (USD Million) by Component, 2025 to 2035
  • Figure 212: MEA Market Value (USD Million) by Type, 2025 to 2035
  • Figure 213: MEA Market Value (USD Million) by Enterprise Size, 2025 to 2035
  • Figure 214: MEA Market Value (USD Million) by Deployment Model, 2025 to 2035
  • Figure 215: MEA Market Value (USD Million) by Application, 2025 to 2035
  • Figure 216: MEA Market Value (USD Million) by Country, 2025 to 2035
  • Figure 217: MEA Market Value (USD Million) Analysis by Country, 2020 to 2035
  • Figure 218: MEA Market Value Share (%) and BPS Analysis by Country, 2025 to 2035
  • Figure 219: MEA Market Y-o-Y Growth (%) Projections by Country, 2025 to 2035
  • Figure 220: MEA Market Value (USD Million) Analysis by Component, 2020 to 2035
  • Figure 221: MEA Market Value Share (%) and BPS Analysis by Component, 2025 to 2035
  • Figure 222: MEA Market Y-o-Y Growth (%) Projections by Component, 2025 to 2035
  • Figure 223: MEA Market Value (USD Million) Analysis by Type, 2020 to 2035
  • Figure 224: MEA Market Value Share (%) and BPS Analysis by Type, 2025 to 2035
  • Figure 225: MEA Market Y-o-Y Growth (%) Projections by Type, 2025 to 2035
  • Figure 226: MEA Market Value (USD Million) Analysis by Enterprise Size, 2020 to 2035
  • Figure 227: MEA Market Value Share (%) and BPS Analysis by Enterprise Size, 2025 to 2035
  • Figure 228: MEA Market Y-o-Y Growth (%) Projections by Enterprise Size, 2025 to 2035
  • Figure 229: MEA Market Value (USD Million) Analysis by Deployment Model, 2020 to 2035
  • Figure 230: MEA Market Value Share (%) and BPS Analysis by Deployment Model, 2025 to 2035
  • Figure 231: MEA Market Y-o-Y Growth (%) Projections by Deployment Model, 2025 to 2035
  • Figure 232: MEA Market Value (USD Million) Analysis by Application, 2020 to 2035
  • Figure 233: MEA Market Value Share (%) and BPS Analysis by Application, 2025 to 2035
  • Figure 234: MEA Market Y-o-Y Growth (%) Projections by Application, 2025 to 2035
  • Figure 235: MEA Market Attractiveness by Component, 2025 to 2035
  • Figure 236: MEA Market Attractiveness by Type, 2025 to 2035
  • Figure 237: MEA Market Attractiveness by Enterprise Size, 2025 to 2035
  • Figure 238: MEA Market Attractiveness by Deployment Model, 2025 to 2035
  • Figure 239: MEA Market Attractiveness by Application, 2025 to 2035
  • Figure 240: MEA Market Attractiveness by Country, 2025 to 2035

Frequently Asked Questions

What is 3D reconstruction technology used for?

It is used to create accurate digital models for applications in healthcare, construction, gaming, and archaeology.

How does photogrammetry differ from LiDAR in 3D reconstruction?

Photogrammetry uses overlapping images to generate models, while LiDAR relies on laser pulses for precise depth measurements.

What industries are adopting 3D reconstruction the fastest?

Healthcare, real estate, media, entertainment, construction, and defense are among the fastest adopters.

How is AI improving 3D reconstruction processes?

AI enhances automation, improves object recognition, refines textures, and accelerates image-based modeling.

What are the main challenges in adopting 3D reconstruction?

High costs, skilled labor requirements, data processing limitations, and security concerns hinder widespread adoption.

Explore Similar Insights

Future Market Insights

3D Reconstruction Technology Market