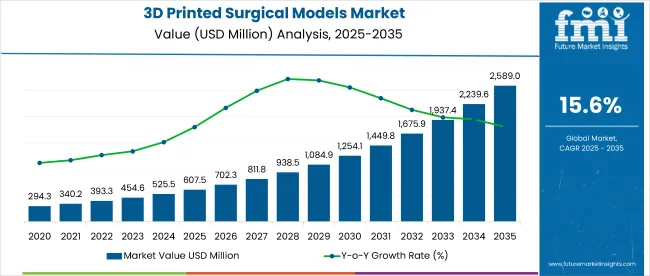
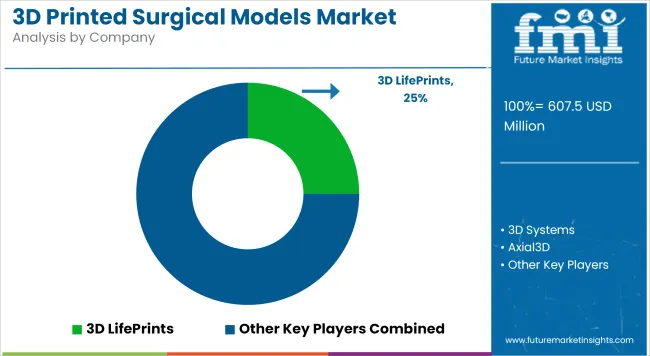
The 3D Printed Surgical Models Market is projected to grow from USD 607.5 million in 2025 to USD 2,589.0 million by 2035, registering a strong compound annual growth rate (CAGR) of 15.6%. This rapid expansion reflects increasing adoption across surgical planning, patient-specific treatments, and medical education, making the market a high-growth opportunity over the next decade. Advancements in 3D printing precision, material innovation, and regulatory support are further accelerating market penetration across healthcare systems worldwide.
With this rapid advancement in technology, the 3D-printed surgical models market is increasing continuously along with precision medicine. The complexly tailored models, designed to present any fine detail in anatomy, make a real difference in preoperative planning, surgical rehearsal, and education.
As the highly precise and patient-specific models will surely raise the capability of surgeons during any surgery by improving surgical precision, thereby minimizing risks while enhancing clinical outcomes, it thus increases its application areas for maintaining modern health.
Global 3D Printed Surgical Models Industry Assessment
| Attributes | Key Insights |
|---|---|
| Historical Size, 2024 | USD 524.6 million |
| Estimated Size, 2025 | USD 607.5 million |
| Projected Size, 2035 | USD 2,589.0 million |
| Value-based CAGR (2025 to 2035) | 15.6% |
Increasing numbers of complex surgeries like cardiac, neurosurgery, orthopedic, and transplant surgery majorly comprise detailed preoperative planning for most surgeries, wherein 3D-printed models provide a great advantage to the surgeons with possibility to visualize and simulate the procedures before actually performing surgery.
Personalized healthcare is a growing demand, and 3D printed models fulfill this demand by personalizing solutions that reflect the unique anatomy of individual patients, which eventually leads to better outcomes and patient satisfaction.
Besides that, the market has further been boosted by technological developments. The combination of 3D printing with imaging techniques such as CT and MRI scans provides unprecedented model detail and realism. Not only did this innovation enhance the accuracy and quality of surgical models but also made them an irreplaceable part of training and education in medicine to let students and professionals train their practical skills with models of complicated anatomy and processes.
With rising healthcare spending and the uptake of cutting-edge medical equipment, emerging markets are playing a significant role. It is anticipated that the need for reasonably priced, superior 3D printed surgical models will increase dramatically as these areas develop their healthcare systems.
The market for 3D-printed surgical models is probably going to be the foundation of advances in surgical treatment and medical education, as the majority of healthcare systems throughout the world place a greater emphasis on technology innovation and individualized therapy. This growth trajectory underlines the importance of the market for better patient outcomes and furthering the future of healthcare.
Several companies in the 3D printed surgical models market are adopting AI, ML, IoT, and sensor-based technologies to improve anatomical precision, speed up model development, and support clinical decision-making. These technologies are being integrated across imaging, segmentation, and printing stages to personalize treatment planning and surgical outcomes.
Ricoh 3D for Healthcare, in collaboration with SimBioSys, is building smart platforms for creating personalized cancer surgical models. Their technology integrates AI to segment anatomical features from imaging data. This enables surgeons to visualize tumors and tissue structures in three dimensions before surgery. The models are produced from CT or MRI scans using cloud-based workflows for faster deployment.
Axial3D is also a prominent player using AI to automate the conversion of medical imaging data into 3D printable formats. Their platform employs machine learning to ensure consistent output and supports surgical teams with precise models for preoperative planning.
Medical IP uses deep learning to improve 3D rendering from CT scans. The company’s platform enhances anatomical resolution and reduces processing time, allowing production of detailed organ and pathology models suitable for simulation and training.
The 3D printed surgical models market is subject to various regulations worldwide, ensuring models' safety, quality, and effectiveness. In addition to the FDA in the United States, countries such as Japan, India, and China have established their own frameworks to oversee 3D printing technologies in healthcare.
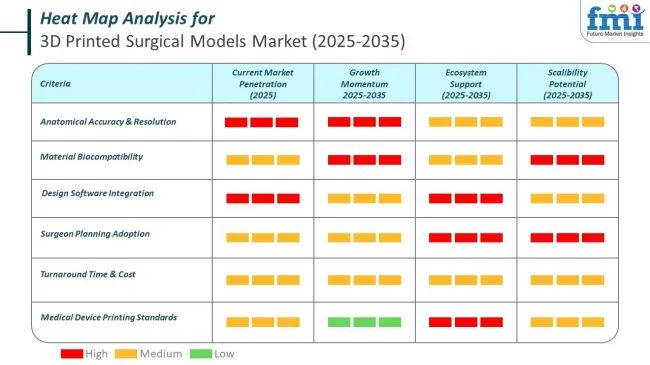
A comparative analysis of fluctuations in compound annual growth rate (CAGR) for the industry between 2024 and 2025 on a six-month basis is shown below. By this examination, major variations in the performance of this industry are brought to light, and also trends of revenue generation are captured hence offering stakeholders useful ideas on how to carry on with the market’s growth path in any other given year. January through June covers the first part of the year called half1 (H1), while half2 (H2) represents July to December.
The below table presents the expected CAGR for the global outlook for 3D printed surgical models over several semi-annual periods spanning from 2025 to 2035. In the first half (H1) of the decade from 2024 to 2034, the business is predicted to surge at a CAGR of 16.5%, followed by a slightly lower growth rate of 16.2% in the second half (H2) of the same decade.
| Particular | Value CAGR |
|---|---|
| H1 | 16.5% (2024 to 2034) |
| H2 | 16.2% (2024 to 2034) |
| H1 | 15.6% (2025 to 2035) |
| H2 | 15.2% (2025 to 2035) |
Moving into the subsequent period, from H1 2025 to H2 2035, the CAGR is projected to decrease slightly to 15.6% in the first half and decrease moderately at 15.2% in the second half. In the first half (H1) the market witnessed a decrease of 90.00 BPS while in the second half (H2), the market witnessed an increase of 100.00 BPS.
The section contains information about the leading segments in the industry. By product, the organ models segment is estimated to hold the highest market share of 43.1% in 2025.
| By Product | Organ Models |
|---|---|
| Value Share (2025) | 43.1% |
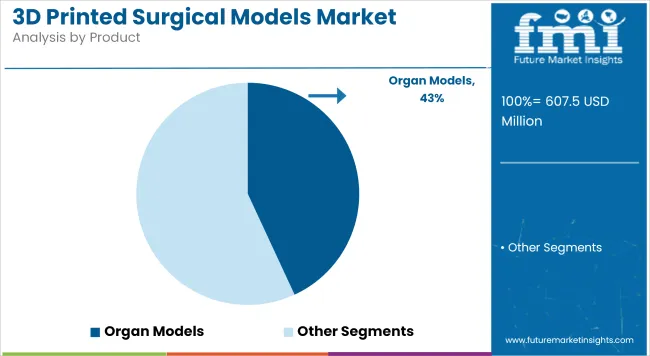
Organ models by product type are expected to have the largest share in the product type segment because their popularity comes from their importance in surgical planning, education, and preoperative rehearsals. These models are very specific and accurately replicate patient-specific anatomy, which makes them indispensable in a vast array of medical specialties.
In surgical planning, organ models enable surgeons to better visualize intricate anatomical structures and to practice complex procedures that reduce complications and improve patient outcomes. In addition, organ models are widely applied in medical education as realistic replicas that can enhance students' and trainees' knowledge of anatomy and surgical techniques. Organ models also play an important role in communication with patients: doctors can explain the procedure to patients clearly, thereby increasing trust and consent rates.
Personalized medicine has increasingly been adopted and 3D printing technologies like multi-material printing have driven demand for organ models. They are versatile and influence clinical outcomes as well as efficiency in training, making them the leading product segment in this market.
| By Technology | Stereolithography 3D Printing |
|---|---|
| Value Share (2025) | 29.8% |
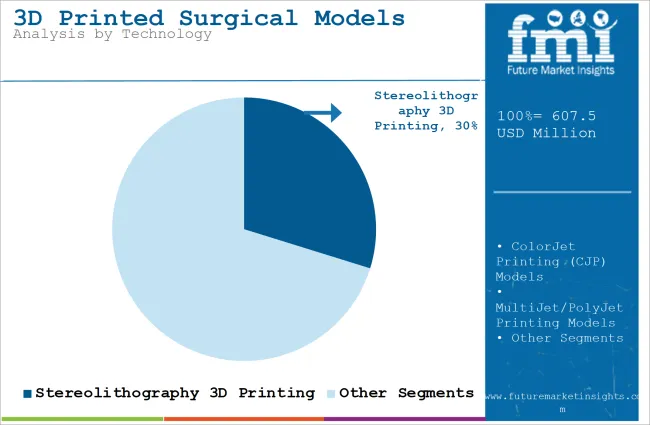
The stereolithography 3d printing segment is expected to lead the market. Its leading position is attributed to its unmatched precision, superior resolution, and smooth surface finish, which are necessary for creating detailed anatomical models. These features make SLA technology highly suitable for healthcare applications, where accuracy and clarity are critical.
SLA printers can deliver complex geometries and fine details, which gives surgeons and the medical profession confident access to high-resolution models used for preoperative planning, training, and explanation to patients, which helps illustrate more intricate anatomical structures that are anticipated by the surgeon and could improve procedural outcomes.
Moreover, the SLA versatility in terms of materials is seen in the form of biocompatible resins that mimic human tissue texture and density, and this is one of the precious values in simulating medical applications. In addition, because it can achieve consistent results even in multiple prints, it favors large-scale manufacturers and medical institutions.
The 3D printed surgical model market has led SLA to continuously produce an increased demand from personalized medicine as regards the requirement of patient-specific models, hence supporting its leading positions.
Increase in Complex and High-Risk Surgeries acts as a Significant Driver in the Market
Increasing complex and high-risk surgeries have given a major boost to the 3D printed surgical models market. As a result of the rising aging population and prevalence of chronic diseases, the number of complex and high-risk surgeries performed has increased tremendously.
According to the World Health Organization's report, NCDs, such as heart disease and diabetes, are set to increase, thus increasing demand for more complex surgeries. For example, in the USA, heart diseases are the leading factor of high deaths, with almost 697,000 deaths recorded in 2020, hence creating the need for more complex cardiac surgeries.
With the development of procedures under increasing complexity, greater preoperative planning precision will become necessary. The technique to help surgeons, nowadays important, is 3D printed surgical models. Thus, the highly detailed and precise anatomical models provide further elucidation of the site to surgeons before the actual surgery, enabling them to easily strategize for the surgery through good visualization.
Several researches suggest that the average surgery time reduction is close to 20% or more, and surgical outcome improvements with the help of three-dimensional printed models for critical surgeries. It, therefore, projected a great demand for 3D-printed surgical models, mainly in surgical disciplines requiring a high degree of precision.
The Growing Trend of Personalized and Customized Surgical Models Tailored to Individual Patient Needs
Personalized and customized surgical models represent one of the significant trends driving the 3D printed surgical models market. It is because the demand for precision medicine, as a growing trend, has been revolutionizing the way surgeries are planned and executed.
Personalized surgical models, as customized to reflect the anatomical features unique to individual patients, cannot be rivaled by any traditional method. This is especially true in areas like reconstructive surgery, where the margin for error is narrow and results rely on minute precision.
Personalized surgical models allow physicians to view complicated anatomical components in 3D before performing surgery. Then, surgeons may more effectively organize their strategy, which lowers the possibility of surgical errors and guarantees more precise outcomes. For example, personalized models for orthopedic surgery can help create prostheses or implants that are precisely matched to the patient's bone structure, improving recuperation after surgery.
This is attributed to growing interest in precision medicine as the quest for customized care treatments according to one's individual genetic and physiological profile intensifies. Such advanced, detailed, and specific models can easily be prepared because 3D printing technology now pairs up very effectively with leading-edge imaging tools like CT and MRIs.
Advances in medical imaging will continue to enhance the design and manufacturing of these customized models, making personalized surgical models an integral part of modern healthcare practices. This trend is expected to grow further, and personalized surgical solutions will be well entrenched in healthcare systems around the world.
Advancements in 3D-Printed Models for Bone Surgery Open New Market Opportunities
The 3D printed surgical models market is likely to grow fast. This is mainly because 3D printing technology is increasingly being applied in different specializations of medicine. High demand for more patient-specific models, which allow for efficient preoperative planning, a reduction in the risks of surgery, and improved patient outcomes is one such opportunity in the market. It also shows that new advanced materials and techniques are emerging due to 3D printing. This means high-precision, customized surgical models are created for complicated surgeries.
A prime example of this is the new development by engineers from the University of Texas at Dallas, who developed a 3D-printed femur that will help doctors prepare for surgeries aimed at repairing bones and treating bone tumors. The orthopedic surgeons worked in collaboration with UT Southwestern Medical Center to sculpt the model into a publishable form in the Journal of Orthopaedic Research.
This has highlighted how 3D-printed models may assist orthopedic surgeons in planning complex surgery, preparing and practicing the surgery, assessing pitfalls and issues, and understanding the specific anatomy of the patient.
Such advancements are leading to the eventual use of 3D-printed models in neurosurgery, cardiology, and oncology. Due to the extraordinary benefits of these models for training, patient-physician communication, and preoperative preparation, the widespread usage of these models will revolutionize healthcare practice.
This also creates significant opportunities for the growth of companies that develop specifically tailored 3D printing solutions for the medical field. The growing partnership of academic institutions and medical centers, along with some technology providers, will further strengthen this foundation for expansions in the upcoming years.
High Costs of 3D Printing Technology Limiting Widespread Adoption in Healthcare
The major restraining factor in the market is the implementation of 3D printed surgical models in health care is that it is rather expensive to get 3D printing equipment and technology. Despite the benefits derived from 3D printed models, such as precision in surgery planning and reduction in risks, the upfront capital outlay necessary for the acquisition and maintenance of 3D printers presents an almost insurmountable hurdle to many healthcare organizations, especially the smaller ones, and to smaller hospitals and clinics.
3D-printing technology for medical applications is highly priced compared to traditional manufacturing techniques. In addition, operating such equipment requires specialized materials and highly trained human resources. For example, healthcare providers would have to invest not only in the printing hardware but also in the software and technology necessary to create accurate models based on patient-specific data. The training of medical staff to effectively use these advanced systems also costs more.
Although the technology itself is evolving and becoming more accessible with time, the high costs are still a challenge, especially in lower-resource settings or regions with limited healthcare budgets. Many healthcare providers may be hesitant to adopt 3D printing solutions, opting instead for traditional methods despite their limitations in terms of accuracy and flexibility.
Until the costs of 3D printing technology reduce and alternative, cost-effective solutions become available, this restraint will continue to limit the full potential of 3D printed surgical models in the global healthcare market.
The global 3D printed surgical models industry recorded a CAGR of 14.4% during the historical period between 2020 and 2024.
The global 3D printed surgical models industry recorded a CAGR of 14.4% during the historical period between 2020 and 2024. The growth of 3D printed surgical models industry was positive as it reached a value of USD 524.6 million in 2024 from USD 305.9 million in 2020.
From 2020 to 2024, the global market for 3D printed surgical models grew steadily with factors such as 3D printing technology innovations and increasing demand for personalized healthcare solutions. Much of this period saw the 3D printed models' adoption by preoperative planning and surgical training, which was supported by healthcare providers looking for innovative tools to enhance procedural accuracy and outcomes.
This was further driven by the increasing use of complex surgeries in cardiology, orthopedics, and oncology, which greatly benefitted from patient-specific anatomical models. However, adoption levels were uneven across regions, with developed markets like North America and Europe leading, while emerging markets began to exhibit notable potential.
From 2025 to 2035, the demand forecast shows a strong growth path; the market will expand at an accelerated rate. This is due to increasing mainstream healthcare practice in the application of 3D printing technologies and the further development of advanced biocompatible materials for surgical models.
The emerging market is primarily supposed to come through Asia-Pacific and Latin America by the development of healthcare infrastructure. In addition, lower costs of manufacture will fuel these markets. Going forward, technology inputs are going to revolutionize market dynamics as far as the making of models can be achieved using artificial intelligence in model creation as well as the usage of multi-material printing.
The comparison highlights a shift from the initial exploratory adoption phase to widespread acceptance and integration, positioning the market for sustained growth and innovation in the coming decade.
The growth of 3D printed surgical models industry was positive as it reached a value of USD 524.6 million in 2024 from USD 305.9 million in 2020.
From 2020 to 2024, the global market for 3D printed surgical models grew steadily with factors such as 3D printing technology innovations and increasing demand for personalized healthcare solutions. Much of this period saw the 3D printed models' adoption by preoperative planning and surgical training, which was supported by healthcare providers looking for innovative tools to enhance procedural accuracy and outcomes.
This was further driven by the increasing use of complex surgeries in cardiology, orthopedics, and oncology, which greatly benefitted from patient-specific anatomical models. However, adoption levels were uneven across regions, with developed markets like North America and Europe leading, while emerging markets began to exhibit notable potential.
From 2025 to 2035, the demand forecast shows a strong growth path; the market will expand at an accelerated rate. This is due to increasing mainstream healthcare practice in the application of 3D printing technologies and the further development of advanced biocompatible materials for surgical models.
The emerging market is primarily supposed to come through Asia-Pacific and Latin America by the development of healthcare infrastructure. In addition, lower costs of manufacture will fuel these markets. Going forward, technology inputs are going to revolutionize market dynamics as far as the making of models can be achieved using artificial intelligence in model creation as well as the usage of multi-material printing.
The comparison highlights a shift from the initial exploratory adoption phase to widespread acceptance and integration, positioning the market for sustained growth and innovation in the coming decade.
Tier 1 companies comprise market leaders with a significant market share of 43.1% in the global market. These market leaders leverage their established global presence and extensive portfolios. Their offerings span multiple medical application
Additionally, their investment in advanced technologies, such as multi-material and biocompatible printing, positions them at the forefront of the industry. Prominent companies in tier 1 include 3D Systems, Materialise, Stratasys, and Formlabs.
Tier 2 companies include mid-size players having presence in specific regions and highly influencing the local market and holds around 29.8% market share. These companies focus on regional markets, forging partnerships with hospitals and academic institutions to meet localized demands. Their agility in adopting emerging technologies and offering cost-effective solutions allows them to compete effectively. Prominent companies in tier 2 include Axial3D, Anatomiz3D, EnvisionTEC, SYNBONE AG and others.
The section below covers the industry analysis for the 3D printed surgical models market for different countries. Market demand analysis on key countries in several regions of the globe, including North America, Latin America, East Asia, South Asia & Pacific, Western Europe, Eastern Europe, and Middle East & Africa, is provided. The United States is anticipated to remain at the forefront in North America, with a higher market share through 2035. In South Asia & Pacific, India is projected to witness a CAGR of 22.6% by 2035.
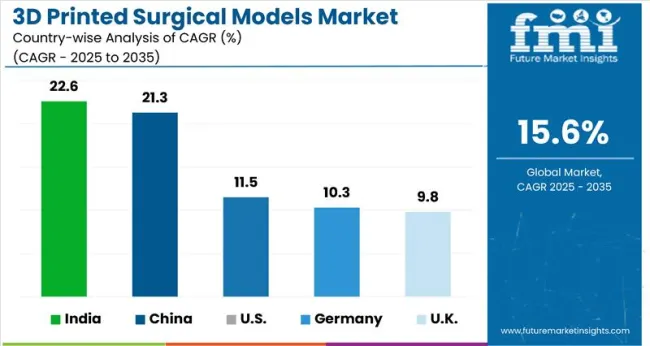
| Countries | Value CAGR (2025 to 2035) |
|---|---|
| USA | 11.5% |
| Germany | 10.8% |
| France | 16.9% |
| UK | 9.8% |
| Spain | 13.9% |
| China | 21.3% |
| India | 22.6% |
| Japan | 13.8% |
United States market for 3D printed surgical models is expected to grow at a CAGR of 11.5% between 2025 and 2035. Currently, it holds the highest share in the North American market, and the trend is expected to continue during the forecast period.
The 3D printed surgical models market is growing at an impressive rate within the USA due to a strong focus on advancing technology in health care. Currently, hospitals and surgical centers apply the latest state-of-the-art 3D printing technologies toward improving preoperative planning and limiting surgical risks by allowing surgeons a detailed view of complex anatomical structures.
Advanced outcomes for very intricate procedures have been achieved from these models-including cardiac, neurosurgical, and transplant surgeries. It benefits from a strong innovation system with substantial funding for R and D by medical institutions with technology providers.
FDA regulatory support towards using patient-specific 3D models promotes their use further. Along with increasing the precision of surgery, these technologies are enhancing the trust and confidence among patients. As a result, the USA remains at the forefront of the global market, constantly driving innovation and setting benchmarks for the use of 3D printed models in surgical applications.
China’s market for 3D printed surgical models is poised to exhibit a CAGR of 21.3% between 2025 and 2035. Currently, it holds the highest share in the East Asia market, and the trend is expected to continue during the forecast period.
The government initiatives for modernization of the sector and improvement of surgical outcomes provide impetus for China's 3D printed surgical models market. Policies, such as Healthy China 2030, have focused their attention on high-tech technologies including 3D printing to upscale the standard of care in China. Moreover, China's very large manufacturing bases make it affordable to produce large quantities of very high-quality surgical models at a significantly lower cost and, therefore more accessible to healthcare providers.
Local production is scalable and affordable, meaning the adoption among public and private hospitals is at large. Further, the government has also nurtured domestic partnerships with international high-tech vendors who come to deliver next-generation solutions that help create next-generation healthcare standards. All of these together propel China toward strong growth as one of the markets that are the biggest contributors of 3D printed surgical models worldwide and promise its long-run growth.
India’s market for 3D printed surgical models is poised to exhibit a CAGR of 22.6% between 2025 and 2035. Currently, it holds the highest share in the South Asia & Pacific market, and the trend is expected to continue during the forecast period.
The 3D Printed Surgical Models Market in India is seeing rapid growth given the demand for individualized, cost-effective healthcare solutions. Improving surgical outcomes, Indian hospitals and clinics are increasingly adopting these models in preoperative planning, training, and patient education. The most important factor is the potential to make these high-quality models at comparatively much lower costs; therefore, tools are now affordable even in tier-2 and tier-3 cities.
Therefore, there is widespread adoption within medical institutions; orthopedic, oncology and cardiac surgery specialties lead the list of such users. Local start-ups specializing in 3D printing services have allowed this technology to penetrate very fast into underserved regions.
While it is offering personalized solutions, some of these companies have also collaborated with healthcare providers for the introduction of innovative models based on the individual needs of the patients in India. This emphasis on accessibility and innovation has made 3D-printed surgical models India's key growth market.
The 3D Printed Surgical Models Market is experiencing significant advancements driven by collaborations and new product launches from key players. These innovations focus on improving surgical precision, reducing risks, and enhancing patient outcomes, with companies pushing the boundaries of 3D printing technology to create personalized and highly accurate models for medical procedures:
Recent Industry Developments in 3D Printed Surgical Models Industry
| Report Attributes | Details |
|---|---|
| Current Total Market Size (2025) | USD 607.5 million |
| Projected Market Size (2035) | USD 2,589.0 million |
| CAGR (2025 to 2035) | 15.6% |
| Base Year for Estimation | 2024 |
| Historical Period | 2020 to 2024 |
| Projections Period | 2025 to 2035 |
| Quantitative Units | USD million for value and thousand units for volume |
| Products Analyzed (Segment 1) | Full Body Models, Segmented Models, Organ Models, Tissue Pads & Plates |
| Technologies Analyzed (Segment 2) | Stereolithography 3D Printing, ColorJet Printing (CJP), MultiJet/PolyJet Printing, Fused Deposition Modeling, Other Technologies |
| Applications Analyzed (Segment 3) | Cardiac Surgery, Gastroenterology, Neurosurgery, Orthopedic Surgery, Reconstructive Surgery, Surgical Oncology, Transplant Surgery |
| Materials Analyzed (Segment 4) | Plastic, Metal, Polymer, Others |
| End Users Analyzed (Segment 5) | Hospitals, Ambulatory Surgical Centers, Specialty Clinics, Others |
| Regions Covered | North America; Latin America; Western Europe; Eastern Europe; South Asia and Pacific; East Asia; Middle East and Africa |
| Countries Covered | United States, Canada, Mexico, Brazil, Argentina, Germany, France, United Kingdom, Italy, Spain, Netherlands, China, India, Japan, South Korea, ANZ, GCC Countries, South Africa |
| Key Players influencing the 3D Printed Surgical Models Market | 3D LifePrints, 3D Systems, Axial3D, Materialise, Anatomiz3D, EnvisionTEC (Desktop Metal), Stratasys, SYNBONE AG, Xilloc, Simulab Corporation, The Chamberlain Group, Navadha Enterprises, Others |
In terms of product, the industry is divided into- full body models, segmented models, organ models, and tissue pads & plates
In terms of Technology, the industry is divided into- stereolithography 3d printing, colorJet printing (CJP) models, multiJet/polyJet printing models, fused deposition 3d modeling, and other technologies
In terms of application, the industry is segregated into- cardiac surgery, gastroenterology, neurosurgery, orthopedic surgery, reconstructive surgery, surgical oncology, and transplant surgery.
In terms of material, the industry is segregated into- plastic, metal, polymer, and others.
In terms of end user, the industry is segregated into- hospitals, ambulatory surgical centers, specialty clinics, and others.
Key countries of North America, Latin America, Western Europe, Eastern Europe, South Asia and Pacific, East Asia and Middle East and Africa (MEA) have been covered in the report.
The global 3D printed surgical models market is projected to witness CAGR of 15.6% between 2025 and 2035.
The global 3D printed surgical models sales stood at USD 524.6 million in 2024.
The global 3D printed surgical models outlook is anticipated to reach USD 2,589.0 million by 2035 end.
India is set to record the highest CAGR of 22.6% in the assessment period.
The key players operating in the global 3D printed surgical models market include 3D LifePrints, 3D Systems, Axial3D, Materialise, Anatomiz3D, EnvisionTEC (now part of Desktop Metal), Stratasys, SYNBONE AG, Xilloc, Simulab Corporation, The Chamberlain Group, Navadha Enterprises and Others.
Explore Similar Insights

Thank you!
You will receive an email from our Business Development Manager. Please be sure to check your SPAM/JUNK folder too.
Chat With
MaRIA