3D Printed Packaging Kit Market Size and Share Forecast Outlook 2025 to 2035

The 3D printed packaging kit market is expected to grow from USD 1.5 billion in 2025 to USD 2.4 billion by 2035, resulting in a total increase of USD 0.9 billion over the forecast decade. This represents a 60.0% total expansion, with the market advancing at a compound annual growth rate (CAGR) of 4.8%. Over ten years, the market grows by a 1.6 multiple.
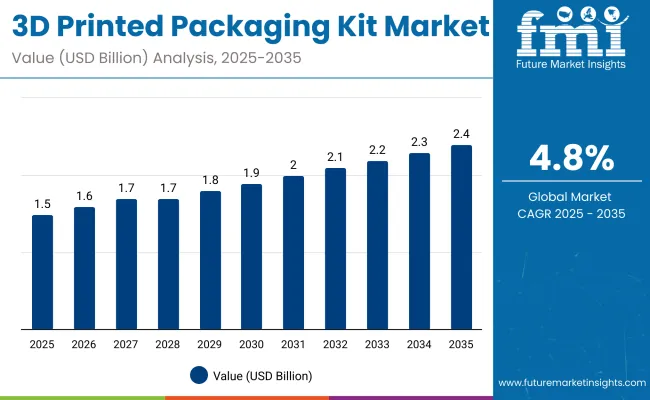
Quick Stats for 3D Printed Packaging Kit Market

  • Market Value (2025): USD 1.5 billion
  • Market Forecast Value (2035): USD 2.4 billion
  • Market Forecast CAGR: 4.8%
  • Leading Segment in 2025: Plastics/polymers (62.4%)
  • Key Growth Regions: Asia-Pacific (India is the fastest-growing market with 5.4% CAGR)
  • Top Key Players: Stratasys Ltd., HP Inc., 3D Systems, EOS GmbH, Carbon, Inc., Desktop Metal, Inc., Protolabs, Sculpteo, Voxeljet AG

3d Printed Packaging Kit Market

Metric Value
Industry Size (2025E) USD 1.5 billion
Industry Value (2035F) USD 2.4 billion
CAGR (2025 to 2035) 4.8%

In the first five years (2025-2030), the market progresses from USD 1.5 billion to USD 1.9 billion, contributing USD 0.4 billion, or 44.4% of total decade growth. This phase is shaped by demand for customization, rapid prototyping, and cost-efficient short runs in consumer goods and healthcare. Sustainability trends, emphasizing reduced waste, also drive early adoption.

In the second half (2030-2035), the market grows from USD 1.9 billion to USD 2.4 billion, adding USD 0.5 billion, or 55.6% of the total growth. This acceleration is supported by advances in bioplastics, multi-material 3D printing, and smart packaging integration. Expanding applications in food, cosmetics, and luxury goods strengthen market penetration, positioning 3D printed kits as a premium packaging solution.

From 2020 to 2024, the 3D printed packaging kit market expanded from USD 1.1 billion to USD 1.4 billion, driven by the rise of customization in e-commerce, medical devices, and luxury goods. Over 65% of revenues were held by OEMs providing tailored designs and rapid prototyping solutions. Leaders such as Stratasys, HP Inc., and Materialise emphasized lightweight materials, structural resilience, and cost-effective customization. Differentiation focused on print speed, sustainable polymers, and design flexibility, while AI-driven generative packaging design remained a secondary revenue driver. Service models for on-demand prototyping accounted for less than 20% of value, with capital investment in in-house printers favoured by large brands.

By 2035, the 3D printed packaging kit market will reach USD 2.4 billion, growing at a CAGR of 4.80%, with software-enabled design ecosystems and service-driven business models capturing over 40% of value. Competition will intensify as solution providers deliver AI-assisted structural optimization, digital twin testing, and cloud-linked 3D design libraries. Established players are shifting toward hybrid models, embedding automation, recyclable biopolymers, and just-in-time production services. Emerging companies such as Xometry, Sculpteo, and Protolabs are gaining share through distributed manufacturing networks, biodegradable material adoption, and end-to-end customization platforms, addressing sustainability goals and supply chain agility.

Why the 3D Printed Packaging Kit Market is growing?

The increasing demand for customized, on-demand, and cost-efficient packaging solutions is driving growth in the 3D printed packaging kit market. These kits enable brands to create unique designs, reduce waste, and shorten production cycles. Expansion in e-commerce, luxury goods, and personalized gifting is further supporting adoption across industries.

Packaging kits produced with 3D printing technologies offer lightweight structures, precise detailing, and enhanced material efficiency. Their adaptability for small batch runs and rapid prototyping supports innovation and branding flexibility. Eco-friendly materials and reduced logistics footprints align with sustainability goals, while design freedom provides competitive advantages for businesses seeking differentiation in consumer-driven markets.

Segmental Analysis

The market is segmented by kit type, material used, end-use industry, and region. Kit type segmentation includes assembly kits such as FDM/FFF printer kits, resin printer kits, metal 3D printer kits, and hybrid CNC + 3D print kits. Component kits cover educational kits, medical/anatomical kits, industrial prototyping kits, consumer kits, and repair & spare-part kits, offering versatile functionality across sectors. Material segmentation includes plastics/polymers such as PLA, ABS, PETG, and nylon, along with resins, metals, composites, and bioprinting materials, supporting innovation in additive manufacturing. End-use industries include education & training, healthcare, industrial/professional, and consumer/hobby applications. Regionally, the market is segmented into North America, Europe, Asia-Pacific, Latin America, and the Middle East & Africa.
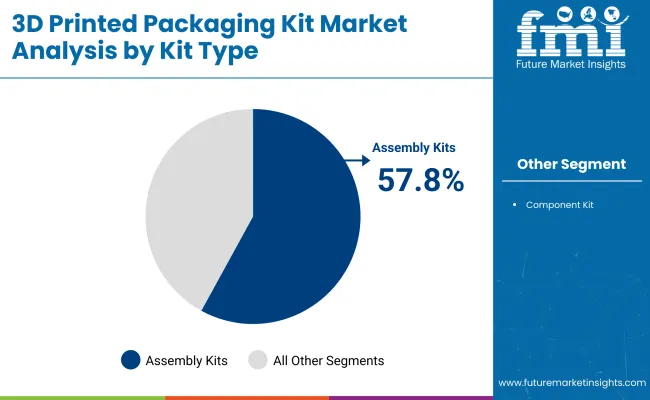
Assembly Kits Dominate with User Accessibility and Scalability

3d Printed Packaging Kit Market By Kit

Assembly kits are projected to command a 57.8% share in 2025, driven by their accessibility for beginners and adaptability for professionals. These kits provide pre-configured components and step-by-step assembly guidance, reducing barriers for small businesses and individuals adopting 3D printing. Their affordability and flexibility make them the most widely adopted kit type.

The popularity of assembly kits is reinforced by growing demand in education and small-scale packaging design. Their modular nature allows users to upgrade printers with advanced nozzles or build plates, ensuring long-term usability. These features make assembly kits the entry point for mass adoption in 3D-printed packaging.
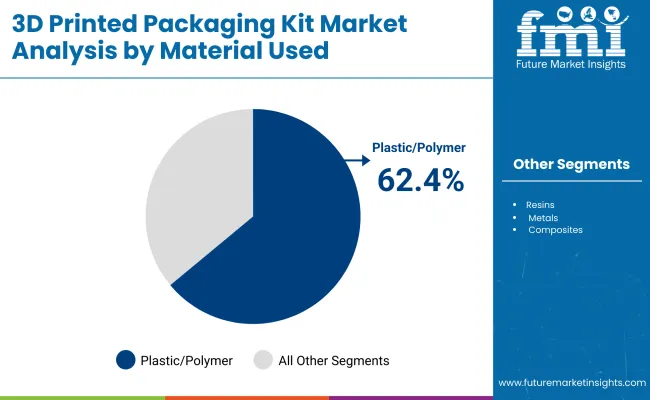
Plastics/Polymers Lead Materials with Versatility and Cost Advantage

3d Printed Packaging Kit Market By Material

Plastics and polymers are expected to account for 62.4% of the market in 2025, reflecting their widespread use in producing lightweight, durable, and cost-effective packaging prototypes. Materials such as PLA, ABS, and PETG offer flexibility in design while maintaining structural strength. Their ease of printing and low cost make them dominant in this space.

This segment benefits from advancements in bio-based polymers, aligning with sustainability trends. Polymers’ adaptability to diverse printing technologies, from FDM to resin-based systems, enhances their role in packaging innovation. Their recyclability and compatibility with food-safe applications further strengthen adoption.
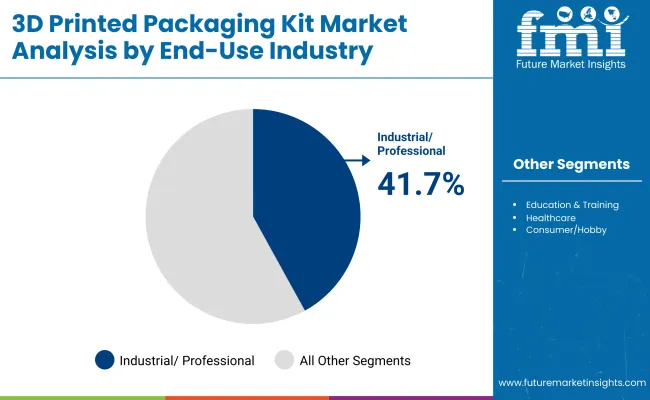
Industrial/Professional End-Use Leads with High Customization Demand

3d Printed Packaging Kit Market By End Use

The industrial and professional segment is forecast to represent 41.7% of the market in 2025, driven by demand for customized, small-batch packaging solutions. Businesses use 3D printing kits to prototype molds, fixtures, and packaging components without relying on traditional tooling. This reduces lead times and improves design flexibility.

Adoption is supported by industries such as electronics, consumer goods, and automotive, where tailored packaging enhances protection and brand identity. Professionals benefit from the ability to test multiple iterations quickly, supporting innovation cycles. The segment’s reliance on precision and scalability ensures continued investment in 3D-printed packaging systems.

What are the Drivers, Restraints, and Key Trends of the 3D Printed Packaging Kit Market?

The 3D printed packaging kit market is gaining traction as industries embrace customization, lightweight structures, and on-demand production capabilities. Growing demand from food, cosmetics, and e-commerce for innovative, sustainable packaging designs is driving growth. However, high equipment costs, material limitations, and slow printing speeds restrain scalability. Advances in biodegradable filaments, rapid prototyping, and smart packaging integration are expected to accelerate adoption across diverse industries.

Customization, Sustainability, and Supply Chain Flexibility Driving Adoption

3D printed packaging kits enable brands to create highly customized shapes, logos, and interactive packaging designs that enhance consumer engagement. Their ability to produce lightweight, durable prototypes reduces product development cycles, supporting faster time-to-market strategies. Sustainable materials such as biodegradable PLA filaments align with rising eco-conscious consumer demand. Additionally, on-demand production reduces inventory holding and waste, offering greater flexibility for small and mid-sized enterprises. This combination of personalization, agility, and sustainability is fueling adoption in consumer-focused sectors.

High Capital Costs, Material Constraints, and Speed Limitations Restraining Growth

Despite strong potential, widespread adoption is restrained by expensive 3D printers, maintenance costs, and limited material compatibility. Most current packaging-grade filaments lack the barrier properties required for food and pharmaceutical applications. Printing large volumes remains time-intensive compared to conventional manufacturing, restricting use in mass production. Smaller companies also face steep learning curves and require skilled staff for design optimization. These challenges hinder scalability and confine 3D printed packaging kits mainly to prototyping and premium applications.

Biodegradable Filaments, Smart Packaging, and Rapid Prototyping Trends Emerging

Key trends include the adoption of recyclable and compostable 3D printing materials that align with circular economy goals. Smart packaging integration, such as embedded QR codes or NFC tags, is being explored to enhance consumer interactivity and product authentication. Advances in high-speed 3D printing technologies are enabling faster prototyping and limited series production. Hybrid approaches combining 3D printing with traditional packaging processes are also gaining attention, allowing cost efficiency while retaining design flexibility. These innovations position 3D printed packaging kits as a future-ready solution for sustainable and highly personalized packaging.
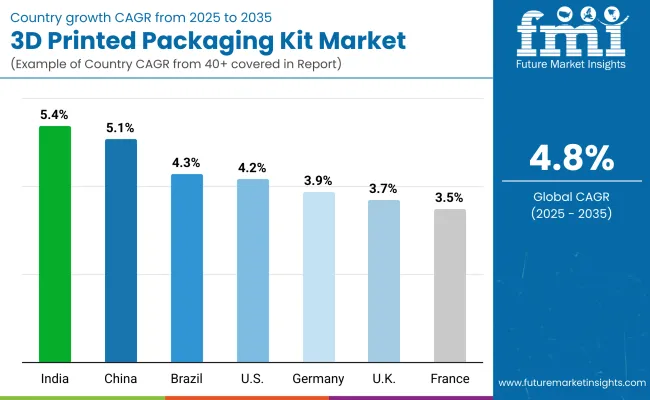
Analysis of 3D Printed Packaging Kit Market by Key Countries

3d Printed Packaging Kit Market By Country

The global 3D printed packaging kit market is expanding steadily, fuelled by rising demand for customization, rapid prototyping, and sustainable packaging solutions. Asia-Pacific is emerging as the fastest-growing region, with India and China investing heavily in additive manufacturing for packaging innovation and scaling. Developed markets such as the USA, Germany, and Japan are focusing on advanced materials, design flexibility, and automation-driven efficiency, ensuring compliance with regulatory standards and supporting eco-friendly practices across diverse industries, including FMCG, healthcare, and e-commerce.
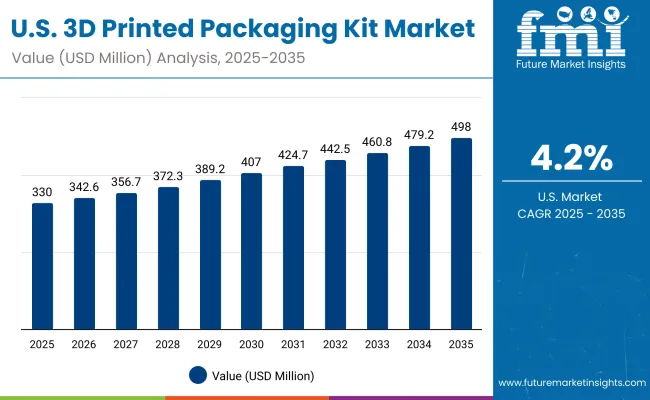
Sales Outlook for 3D Printed Packaging Kit Market United States

3d Printed Packaging Kit Market Usa

The USA market is projected to grow at a CAGR of 4.2% from 2025 to 2035, driven by the adoption of customized packaging for consumer goods, healthcare, and premium e-commerce brands. Companies are investing in high-resolution 3D printing systems to produce lightweight, recyclable kits tailored to specific product dimensions. The focus is on reducing packaging waste while enhancing speed-to-market and customer experience through design flexibility and advanced digital prototyping.
  • E-commerce retailers adopt 3D printed kits for tailored sustainable packaging solutions.
  • Healthcare firms deploy precision-printed kits for medical device protection.
  • OEMs invest in high-speed printers to scale customized packaging lines.

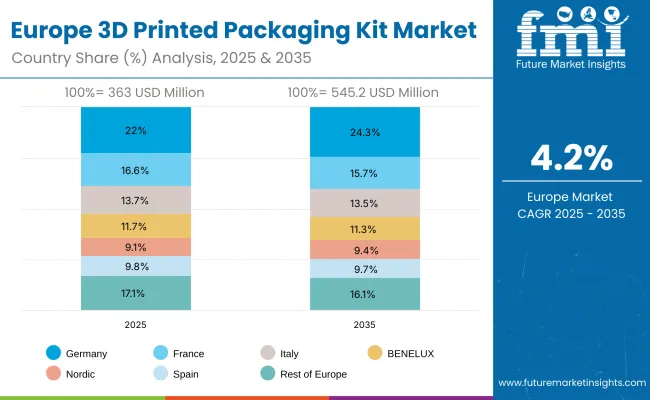
Growth Outlook for 3D Printed Packaging Kit Market Germany

3d Printed Packaging Kit Market Europe

Germany’s market is expected to grow at a CAGR of 3.9%, supported by its strong engineering ecosystem and strict EU packaging sustainability goals. 3D printed kits are being used for premium consumer goods, industrial products, and food packaging requiring precision and durability. Manufacturers are focusing on recyclable materials and automated systems to streamline production. Increasing emphasis on waste reduction and circular economy compliance is shaping innovations in packaging kit designs and reusable components for long-term applications.

  • Automotive suppliers adopt 3D printed kits for component packaging accuracy.
  • FMCG brands explore recyclable 3D printed formats for eco-friendly branding.
  • OEMs enhance modular designs to support EU circular economy goals.

Expansion Outlook for 3D Printed Packaging Kit Market United Kingdom

The UK market is projected to grow at a CAGR of 3.7%, driven by demand in luxury goods, food packaging, and retail customization. Brands are leveraging 3D printing for personalized packaging formats that align with sustainability commitments. Startups and SMEs are playing a key role by offering flexible, short-run production capabilities. Regulatory pressures around packaging waste are encouraging rapid adoption of bio-based printing materials and reusable designs. Adoption is further enhanced by e-commerce growth and customer personalization demand.

  • Luxury brands integrate 3D printed kits for unique product presentation.
  • Startups deliver cost-effective short-run custom packaging for SMEs.
  • Retailers adopt reusable designs aligned with packaging waste directives.

Sales Outlook for 3D Printed Packaging Kit Market China

China’s market is forecast to grow at a CAGR of 5.1%, fuelled by rapid digital manufacturing adoption, e-commerce expansion, and government incentives for 3D printing innovation. Packaging companies are increasingly using 3D printing for customized designs, faster prototyping, and localized production. Domestic players are scaling cost-efficient solutions using biodegradable and recyclable materials. Rising consumer demand for premium, eco-conscious packaging is accelerating market growth, particularly in cosmetics, electronics, and specialty food sectors.

  • E-commerce platforms use 3D printed kits for tailored shipping solutions.
  • Cosmetics brands adopt premium printed packaging to appeal to youth buyers.
  • Local OEMs scale production with biodegradable and recyclable materials.

Growth Outlook for 3D Printed Packaging Kit Market India

India is projected to record the fastest growth at a CAGR of 5.4%, supported by expanding FMCG, pharmaceuticals, and export-focused industries. SMEs are adopting 3D printed packaging kits to cut production costs and improve speed-to-market. Demand is rising for lightweight, customizable designs that enhance product presentation while reducing material waste. Government initiatives in additive manufacturing and sustainability regulations are boosting adoption, making India a hub for both domestic and export-oriented 3D packaging solutions.

  • Pharma exporters use 3D printed kits for protective sterile packaging.
  • FMCG brands adopt lightweight kits to reduce logistics costs.
  • SMEs embrace short-run 3D printing for cost-effective packaging.

Growth Outlook for 3D Printed Packaging Kit Market Japan

Japan’s market is expected to grow at a CAGR of 4.0%, driven by high adoption in electronics, precision equipment, and premium food packaging. Companies are innovating with 3D printed packaging kits that ensure high durability and compactness while reducing excess materials. Minimalist designs aligned with Japan’s cultural aesthetics are becoming prominent. Innovation focuses on eco-friendly polymers and rapid prototyping to align with sustainability standards. Manufacturers emphasize precision and reliability in 3D printing packaging systems for sensitive goods.

  • Electronics firms adopt precision-printed kits for fragile device protection.
  • Food packaging firms adopt eco-friendly 3D printed formats.
  • OEMs develop minimalist packaging aligned with cultural preferences.

Expansion Outlook for 3D Printed Packaging Kit Market South Korea

South Korea’s market is projected to grow at a CAGR of 3.6%, led by adoption in cosmetics, electronics, and e-commerce sectors. Local companies are exploring innovative designs combining smart technology with sustainable packaging. Demand is rising for personalized, reusable kits aligned with global export standards. With strong connectivity and manufacturing infrastructure, South Korea is focusing on scaling digital packaging solutions that integrate smart tags, traceability, and premium finishing for enhanced consumer engagement.
  • Cosmetics firms integrate smart 3D packaging kits for luxury exports.
  • Electronics brands adopt durable kits for fragile component shipping.
  • OEMs innovate reusable kits with embedded traceability features.

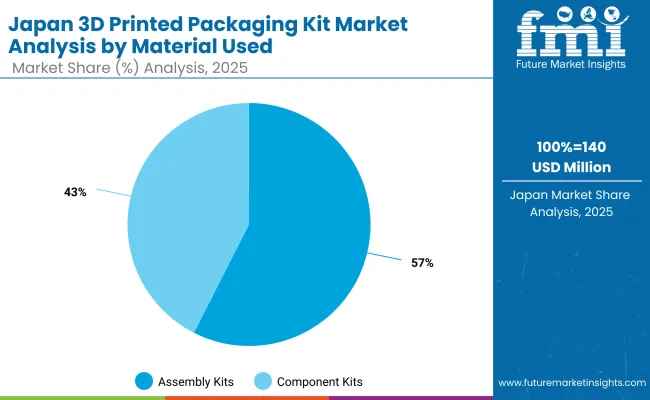
Analysis of Japan 3D printed packaging kit market by Kit Type

3d Printed Packaging Kit Market Japan

Japan’s 3D printed packaging kit market in 2025 is valued at USD 140 million, with assembly kits taking the lead at 55.8% (USD 78 million). Component kits follow at 44.2% (USD 62 million). Assembly kits dominate due to their efficiency in providing ready-to-use solutions, especially for industries seeking faster prototyping and functional packaging. Component kits remain important for flexibility, customization, and advanced design needs across diverse applications.
Analysis of South Korea3D printed packaging kit market by Material

3d Printed Packaging Kit Market South Korea

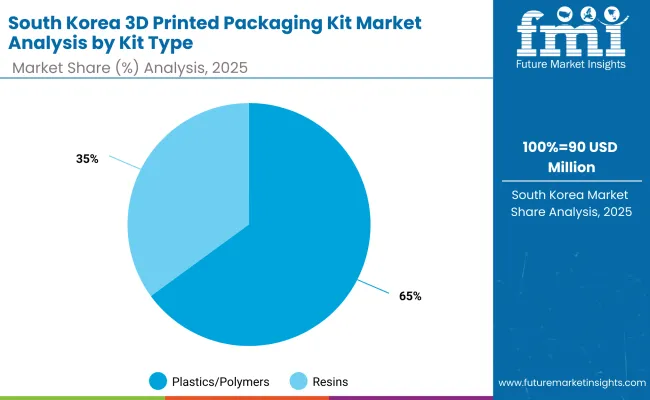
South Korea’s 3D printed packaging kit market, estimated at USD 90 million in 2025, is primarily driven by plastics/polymers holding 65.1% (USD 59 million). Resins capture 34.9% (USD 31 million), while metals, composites, and bioprinting materials show minimal activity. Polymers dominate due to cost-effectiveness, adaptability, and strong mechanical performance in packaging applications. Resins, though smaller, are gaining ground with their role in producing high-precision and specialized packaging solutions.
Competitive Landscape of 3D Printed Packaging Kit Market

3d Printed Packaging Kit Market By Company

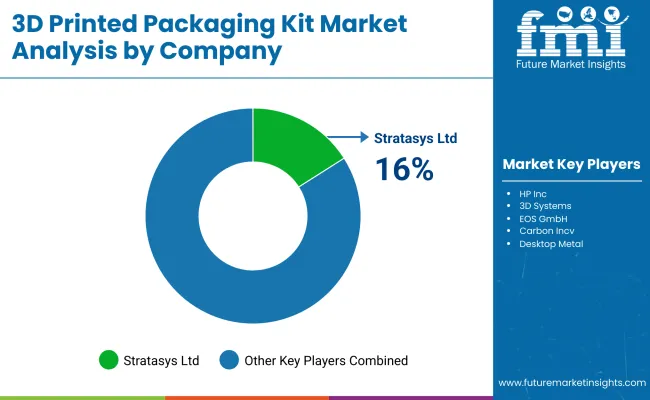
The 3D printed packaging kit market is moderately fragmented, with additive manufacturing leaders, material innovators, and digital prototyping firms competing across consumer goods, healthcare, and luxury packaging sectors. Global leaders such as Stratasys Ltd., HP Inc., and 3D Systems hold notable market share, driven by advanced polymer printing, high-resolution prototyping, and compliance with packaging safety standards. Their strategies increasingly emphasize mass customization, sustainable material use, and integration with digital design platforms.

Established mid-sized players including EOS GmbH, Carbon, Inc., and Desktop Metal, Inc. are supporting adoption of 3D printed packaging kits featuring lightweight lattice structures, recyclable polymers, and rapid tooling technologies. These companies are especially active in personalized packaging, protective inserts, and high-performance prototypes, offering scalable production, precision detailing, and cost-effective short-run solutions for premium brands.

Specialized providers such as Protolabs, Sculpteo, and Voxeljet AG focus on tailored solutions for regional markets and niche applications. Their strengths lie in on-demand 3D printing services, rapid turnaround, and multi-material integration, enabling brands to experiment with complex geometries, reduce lead times, and adopt eco-friendly innovations in packaging for consumer engagement and supply chain efficiency.

Key Developments

  • In November 2024, Stratasys announced a collaboration with Baralan, a cosmetic packaging provider, to create 3D-printed, fully decorated, customizable cosmetic packaging using PolyJet technology. The partnership enables low-volume production runs with personalized designs.
  • On February 23, 2024, Carbon officially announced its Automatic Operation (AO) Suite, a set of solutions for dental labs designed to automate the 3D printing workflow. It includes Automatic Print Preparation software, the AO Backpack (enabling up to 14 hours of unattended printing), and the AO Polishing Cassette. These tools enhance efficiency and reduce labor in production labs.

Key Companies

  • Stratasys Ltd.
  • HP Inc.
  • 3D Systems
  • EOS GmbH
  • Carbon, Inc.
  • Desktop Metal, Inc.
  • Protolabs
  • Sculpteo
  • Voxeljet AG

Scope of the Report

Item Value
Quantitative Units USD 1.5 Billion
By Kit Type Assembly Kits, FDM/FFF Printer Kits, Resin Printer Kits, Metal 3D Printer Kits, Hybrid CNC + 3D Print Kits, Component Kits, Educational Kits, Medical/Anatomical Kits, Industrial Prototyping Kits, Consumer Kits, Repair & Spare-Part Kits
By Material Used Plastics/Polymers, PLA, ABS, PETG, Nylon, Resins, Metals, Composites, Bioprinting Materials
By End-Use Industry Education & Training, Healthcare, Industrial/Professional, Consumer/Hobby
Key Companies Profiled Stratasys Ltd., HP Inc., 3D Systems, EOS GmbH, Carbon, Inc., Desktop Metal, Inc., Protolabs, Sculpteo, Voxeljet AG
Additional Attributes Expanding adoption of educational kits to promote 3D printing literacy, increasing demand for healthcare anatomical models and medical kits, rising preference for FDM/FFF and resin kits among consumers and professionals, hybrid systems integrating CNC and 3D printing gaining traction in industrial prototyping, growing use of sustainable materials like PLA and composites, and rapid development of bioprinting kits for specialized applications in research and personalized healthcare.

Key Segmentation

By Kit Type:

  • Assembly Kits
  • FDM/FFF printer kits
  • Resin printer kits
  • Metal 3D printer kits
  • Hybrid CNC + 3D print kits
  • Component Kits
  • Educational kits
  • Medical/anatomical kits
  • Industrial prototyping kits
  • Consumer kits
  • Repair & spare-part kits

By Material Used:

  • Plastics/Polymers
  • PLA
  • ABS
  • PETG
  • Nylon
  • Resins
  • Metals
  • Composites
  • Bioprinting materials

By End-Use Industry:

  • Education & Training
  • Healthcare
  • Industrial/Professional
  • Consumer/Hobby

By Region:

  • North America
  • Europe
  • Asia-Pacific
  • Latin America
  • Middle East & Africa

Table of Content

  1. Executive Summary
    • Global Market Outlook
    • Demand-side Trends
    • Supply-side Trends
    • Technology Roadmap Analysis
    • Analysis and Recommendations
  2. Market Overview
    • Market Coverage / Taxonomy
    • Market Definition / Scope / Limitations
  3. Market Background
    • Market Dynamics
      • Drivers
      • Restraints
      • Opportunity
      • Trends
    • Scenario Forecast
      • Demand in Optimistic Scenario
      • Demand in Likely Scenario
      • Demand in Conservative Scenario
    • Opportunity Map Analysis
    • Product Life Cycle Analysis
    • Supply Chain Analysis
      • Supply Side Participants and their Roles
        • Producers
        • Mid-Level Participants (Traders/ Agents/ Brokers)
        • Wholesalers and Distributors
      • Value Added and Value Created at Node in the Supply Chain
      • List of Raw Material Suppliers
      • List of Existing and Potential Buyer’s
    • Investment Feasibility Matrix
    • Value Chain Analysis
      • Profit Margin Analysis
      • Wholesalers and Distributors
      • Retailers
    • PESTLE and Porter’s Analysis
    • Regulatory Landscape
      • By Key Regions
      • By Key Countries
    • Regional Parent Market Outlook
    • Production and Consumption Statistics
    • Import and Export Statistics
  4. Global Market Analysis 2020 to 2024 and Forecast, 2025 to 2035
    • Historical Market Size Value (USD Billion) & Volume (Units) Analysis, 2020 to 2024
    • Current and Future Market Size Value (USD Billion) & Volume (Units) Projections, 2025 to 2035
      • Y-o-Y Growth Trend Analysis
      • Absolute $ Opportunity Analysis
  5. Global Market Analysis 2020 to 2024 and Forecast 2025 to 2035, By Kit Type
    • Introduction / Key Findings
    • Historical Market Size Value (USD Billion) & Volume (Units) Analysis By Kit Type, 2020 to 2024
    • Current and Future Market Size Value (USD Billion) & Volume (Units) Analysis and Forecast By Kit Type, 2025 to 2035
      • Assembly Kits
        • FDM/FFF printer kits
        • Resin printer kits
        • Metal 3D printer kits
        • Hybrid CNC + 3D print kits
      • Component Kits
        • Educational kits
        • Medical/anatomical kits
        • Industrial prototyping kits
        • Consumer kits
        • Repair & spare-part kits
      • Minimally Invasive BCIs
      • HSDFHDS
    • Y-o-Y Growth Trend Analysis By Kit Type, 2020 to 2024
    • Absolute $ Opportunity Analysis By Kit Type, 2025 to 2035
  6. Global Market Analysis 2020 to 2024 and Forecast 2025 to 2035, By Material Used
    • Introduction / Key Findings
    • Historical Market Size Value (USD Billion) & Volume (Units) Analysis By Material Used, 2020 to 2024
    • Current and Future Market Size Value (USD Billion) & Volume (Units) Analysis and Forecast By Material Used, 2025 to 2035
      • Plastics/Polymers
        • PLA
        • ABS
        • PETG
        • Nylon
      • Resins
      • Metals
      • Composites
      • Bioprinting materials
    • Y-o-Y Growth Trend Analysis By Material Used, 2020 to 2024
    • Absolute $ Opportunity Analysis By Material Used, 2025 to 2035
  7. Global Market Analysis 2020 to 2024 and Forecast 2025 to 2035, By End-Use Industry
    • Introduction / Key Findings
    • Historical Market Size Value (USD Billion) & Volume (Units) Analysis By End-Use Industry, 2020 to 2024
    • Current and Future Market Size Value (USD Billion) & Volume (Units) Analysis and Forecast By End-Use Industry, 2025 to 2035
      • Education & Training
      • Healthcare
      • Industrial/Professional
      • Consumer/Hobby
    • Y-o-Y Growth Trend Analysis By End-Use Industry, 2020 to 2024
    • Absolute $ Opportunity Analysis By End-Use Industry, 2025 to 2035
  8. Global Market Analysis 2020 to 2024 and Forecast 2025 to 2035, By Region
    • Introduction
    • Historical Market Size Value (USD Billion) & Volume (Units) Analysis By Region, 2020 to 2024
    • Current Market Size Value (USD Billion) & Volume (Units) Analysis and Forecast By Region, 2025 to 2035
      • North America
      • Latin America
      • East Asia
      • South Asia & Pacific
      • Western Europe
      • Eastern Europe
      • Middle East & Africa
    • Market Attractiveness Analysis By Region
  9. North America Market Analysis 2020 to 2024 and Forecast 2025 to 2035, By Country
    • Historical Market Size Value (USD Billion) & Volume (Units) Trend Analysis By Market Taxonomy, 2020 to 2024
    • Market Size Value (USD Billion) & Volume (Units) Forecast By Market Taxonomy, 2025 to 2035
      • By Country
        • USA
        • Canada
        • Mexico
      • By Kit Type
      • By Material Used
      • By End-Use Industry
    • Market Attractiveness Analysis
      • By Country
      • By Kit Type
      • By Material Used
      • By End-Use Industry
    • Key Takeaways
  10. Latin America Market Analysis 2020 to 2024 and Forecast 2025 to 2035, By Country
    • Historical Market Size Value (USD Billion) & Volume (Units) Trend Analysis By Market Taxonomy, 2020 to 2024
    • Market Size Value (USD Billion) & Volume (Units) Forecast By Market Taxonomy, 2025 to 2035
      • By Country
        • Brazil
        • Argentina
        • Rest of Latin America
      • By Kit Type
      • By Material Used
      • By End-Use Industry
    • Market Attractiveness Analysis
      • By Country
      • By Kit Type
      • By Material Used
      • By End-Use Industry
    • Key Takeaways
  11. East Asia Market Analysis 2020 to 2024 and Forecast 2025 to 2035, By Country
    • Historical Market Size Value (USD Billion) & Volume (Units) Trend Analysis By Market Taxonomy, 2020 to 2024
    • Market Size Value (USD Billion) & Volume (Units) Forecast By Market Taxonomy, 2025 to 2035
      • By Country
        • China
        • Japan
        • South Korea
      • By Kit Type
      • By Material Used
      • By End-Use Industry
    • Market Attractiveness Analysis
      • By Country
      • By Kit Type
      • By Material Used
      • By End-Use Industry
    • Key Takeaways
  12. South Asia & Pacific Market Analysis 2020 to 2024 and Forecast 2025 to 2035, By Country
    • Historical Market Size Value (USD Billion) & Volume (Units) Trend Analysis By Market Taxonomy, 2020 to 2024
    • Market Size Value (USD Billion) & Volume (Units) Forecast By Market Taxonomy, 2025 to 2035
      • By Country
        • India
        • ASEAN Countries
        • Australia& New Zealand
        • Rest of South Asia
      • By Kit Type
      • By Material Used
      • By End-Use Industry
    • Market Attractiveness Analysis
      • By Country
      • By Kit Type
      • By Material Used
      • By End-Use Industry
    • Key Takeaways
  13. Western Europe Market Analysis 2020 to 2024 and Forecast 2025 to 2035, By Country
    • Historical Market Size Value (USD Billion) & Volume (Units) Trend Analysis By Market Taxonomy, 2020 to 2024
    • Market Size Value (USD Billion) & Volume (Units) Forecast By Market Taxonomy, 2025 to 2035
      • By Country
        • Germany
        • UK
        • France
        • Italy
        • Spain
        • BENELUX
        • Nordic Countries
        • Rest of Western Europe
      • By Kit Type
      • By Material Used
      • By End-Use Industry
    • Market Attractiveness Analysis
      • By Country
      • By Kit Type
      • By Material Used
      • By End-Use Industry
    • Key Takeaways
  14. Eastern Europe Market Analysis 2020 to 2024 and Forecast 2025 to 2035, By Country
    • Historical Market Size Value (USD Billion) & Volume (Units) Trend Analysis By Market Taxonomy, 2020 to 2024
    • Market Size Value (USD Billion) & Volume (Units) Forecast By Market Taxonomy, 2025 to 2035
      • By Country
        • Russia
        • Hungary
        • Poland
        • Rest of Eastern Europe
      • By Kit Type
      • By Material Used
      • By End-Use Industry
    • Market Attractiveness Analysis
      • By Country
      • By Kit Type
      • By Material Used
      • By End-Use Industry
    • Key Takeaways
  15. Middle East & Africa Market Analysis 2020 to 2024 and Forecast 2025 to 2035, By Country
    • Historical Market Size Value (USD Billion) & Volume (Units) Trend Analysis By Market Taxonomy, 2020 to 2024
    • Market Size Value (USD Billion) & Volume (Units) Forecast By Market Taxonomy, 2025 to 2035
      • By Country
        • Saudi Arabia
        • Türkiye
        • South Africa
        • Other African Union
        • Rest of Middle East & Africa
      • By Kit Type
      • By Material Used
      • By End-Use Industry
    • Market Attractiveness Analysis
      • By Country
      • By Kit Type
      • By Material Used
      • By End-Use Industry
    • Key Takeaways
  16. Key Countries Market Analysis
    • USA
      • Pricing Analysis
      • Market Share Analysis, 2024
        • By Kit Type
        • By Material Used
        • By End-Use Industry
    • Brazil
      • Pricing Analysis
      • Market Share Analysis, 2024
        • By Kit Type
        • By Material Used
        • By End-Use Industry
    • China
      • Pricing Analysis
      • Market Share Analysis, 2024
        • By Kit Type
        • By Material Used
        • By End-Use Industry
    • India
      • Pricing Analysis
      • Market Share Analysis, 2024
        • By Kit Type
        • By Material Used
        • By End-Use Industry
    • Europe
      • Pricing Analysis
      • Market Share Analysis, 2024
        • By Kit Type
        • By Material Used
        • By End-Use Industry
    • Germany
      • Pricing Analysis
      • Market Share Analysis, 2024
        • By Kit Type
        • By Material Used
        • By End-Use Industry
    • France
      • Pricing Analysis
      • Market Share Analysis, 2024
        • By Kit Type
        • By Material Used
        • By End-Use Industry
    • UK
      • Pricing Analysis
      • Market Share Analysis, 2024
        • By Kit Type
        • By Material Used
        • By End-Use Industry
  17. Market Structure Analysis
    • Competition Dashboard
    • Competition Benchmarking
    • Market Share Analysis of Top Players
      • By Regional
      • By Kit Type
      • By Material Used
      • By End-Use Industry
  18. Competition Analysis
    • Competition Deep Dive
      • Stratasys Ltd.
        • Overview
        • Product Portfolio
        • Profitability by Market Segments (Product/Age /Sales Channel/Region)
        • Sales Footprint
        • Strategy Overview
          • Marketing Strategy
          • Product Strategy
          • Channel Strategy
      • HP Inc.
        • Overview
        • Product Portfolio
        • Profitability by Market Segments (Product/Age /Sales Channel/Region)
        • Sales Footprint
        • Strategy Overview
          • Marketing Strategy
          • Product Strategy
          • Channel Strategy
      • 3D Systems
        • Overview
        • Product Portfolio
        • Profitability by Market Segments (Product/Age /Sales Channel/Region)
        • Sales Footprint
        • Strategy Overview
          • Marketing Strategy
          • Product Strategy
          • Channel Strategy
      • EOS GmbH
        • Overview
        • Product Portfolio
        • Profitability by Market Segments (Product/Age /Sales Channel/Region)
        • Sales Footprint
        • Strategy Overview
          • Marketing Strategy
          • Product Strategy
          • Channel Strategy
      • Carbon, Inc.
        • Overview
        • Product Portfolio
        • Profitability by Market Segments (Product/Age /Sales Channel/Region)
        • Sales Footprint
        • Strategy Overview
          • Marketing Strategy
          • Product Strategy
          • Channel Strategy
      • Desktop Metal, Inc.
        • Overview
        • Product Portfolio
        • Profitability by Market Segments (Product/Age /Sales Channel/Region)
        • Sales Footprint
        • Strategy Overview
          • Marketing Strategy
          • Product Strategy
          • Channel Strategy
      • Protolabs
        • Overview
        • Product Portfolio
        • Profitability by Market Segments (Product/Age /Sales Channel/Region)
        • Sales Footprint
        • Strategy Overview
          • Marketing Strategy
          • Product Strategy
          • Channel Strategy
      • Sculpteo
        • Overview
        • Product Portfolio
        • Profitability by Market Segments (Product/Age /Sales Channel/Region)
        • Sales Footprint
        • Strategy Overview
          • Marketing Strategy
          • Product Strategy
          • Channel Strategy
      • Voxeljet AG
        • Overview
        • Product Portfolio
        • Profitability by Market Segments (Product/Age /Sales Channel/Region)
        • Sales Footprint
        • Strategy Overview
          • Marketing Strategy
          • Product Strategy
          • Channel Strategy
  19. Assumptions & Acronyms Used
  20. Research Methodology

List of Tables

  • Table 1: Global Market Value (USD Billion) Forecast by Region, 2020-2035
  • Table 2: Global Market Volume (Units) Forecast by Region, 2020-2035
  • Table 3: Global Market Value (USD Billion) Forecast by Kit Type, 2020-2035
  • Table 4: Global Market Volume (Units) Forecast by Kit Type, 2020-2035
  • Table 5: Global Market Value (USD Billion) Forecast by Material Used, 2020-2035
  • Table 6: Global Market Volume (Units) Forecast by Material Used, 2020-2035
  • Table 7: Global Market Value (USD Billion) Forecast by End-Use Industry, 2020-2035
  • Table 8: Global Market Volume (Units) Forecast by End-Use Industry, 2020-2035
  • Table 9: North America Market Value (USD Billion) Forecast by Country, 2020-2035
  • Table 10: North America Market Volume (Units) Forecast by Country, 2020-2035
  • Table 11: North America Market Value (USD Billion) Forecast by Kit Type, 2020-2035
  • Table 12: North America Market Volume (Units) Forecast by Kit Type, 2020-2035
  • Table 13: North America Market Value (USD Billion) Forecast by Material Used, 2020-2035
  • Table 14: North America Market Volume (Units) Forecast by Material Used, 2020-2035
  • Table 15: North America Market Value (USD Billion) Forecast by End-Use Industry, 2020-2035
  • Table 16: North America Market Volume (Units) Forecast by End-Use Industry, 2020-2035
  • Table 17: Latin America Market Value (USD Billion) Forecast by Country, 2020-2035
  • Table 18: Latin America Market Volume (Units) Forecast by Country, 2020-2035
  • Table 19: Latin America Market Value (USD Billion) Forecast by Kit Type, 2020-2035
  • Table 20: Latin America Market Volume (Units) Forecast by Kit Type, 2020-2035
  • Table 21: Latin America Market Value (USD Billion) Forecast by Material Used, 2020-2035
  • Table 22: Latin America Market Volume (Units) Forecast by Material Used, 2020-2035
  • Table 23: Latin America Market Value (USD Billion) Forecast by End-Use Industry, 2020-2035
  • Table 24: Latin America Market Volume (Units) Forecast by End-Use Industry, 2020-2035
  • Table 25: East Asia Market Value (USD Billion) Forecast by Country, 2020-2035
  • Table 26: East Asia Market Volume (Units) Forecast by Country, 2020-2035
  • Table 27: East Asia Market Value (USD Billion) Forecast by Kit Type, 2020-2035
  • Table 28: East Asia Market Volume (Units) Forecast by Kit Type, 2020-2035
  • Table 29: East Asia Market Value (USD Billion) Forecast by Material Used, 2020-2035
  • Table 30: East Asia Market Volume (Units) Forecast by Material Used, 2020-2035
  • Table 31: East Asia Market Value (USD Billion) Forecast by End-Use Industry, 2020-2035
  • Table 32: East Asia Market Volume (Units) Forecast by End-Use Industry, 2020-2035
  • Table 33: South Asia & Pacific Market Value (USD Billion) Forecast by Country, 2020-2035
  • Table 34: South Asia & Pacific Market Volume (Units) Forecast by Country, 2020-2035
  • Table 35: South Asia & Pacific Market Value (USD Billion) Forecast by Kit Type, 2020-2035
  • Table 36: South Asia & Pacific Market Volume (Units) Forecast by Kit Type, 2020-2035
  • Table 37: South Asia & Pacific Market Value (USD Billion) Forecast by Material Used, 2020-2035
  • Table 38: South Asia & Pacific Market Volume (Units) Forecast by Material Used, 2020-2035
  • Table 39: South Asia & Pacific Market Value (USD Billion) Forecast by End-Use Industry, 2020-2035
  • Table 40: South Asia & Pacific Market Volume (Units) Forecast by End-Use Industry, 2020-2035
  • Table 41: Western Europe Market Value (USD Billion) Forecast by Country, 2020-2035
  • Table 42: Western Europe Market Volume (Units) Forecast by Country, 2020-2035
  • Table 43: Western Europe Market Value (USD Billion) Forecast by Kit Type, 2020-2035
  • Table 44: Western Europe Market Volume (Units) Forecast by Kit Type, 2020-2035
  • Table 45: Western Europe Market Value (USD Billion) Forecast by Material Used, 2020-2035
  • Table 46: Western Europe Market Volume (Units) Forecast by Material Used, 2020-2035
  • Table 47: Western Europe Market Value (USD Billion) Forecast by End-Use Industry, 2020-2035
  • Table 48: Western Europe Market Volume (Units) Forecast by End-Use Industry, 2020-2035
  • Table 49: Eastern Europe 3D Printed Packaging Kit Market Value (USD Billion) Forecast by Country, 2020-2035
  • Table 50: Eastern Europe 3D Printed Packaging Kit Market Volume (Units) Forecast by Country, 2020-2035
  • Table 51: Eastern Europe 3D Printed Packaging Kit Market Value (USD Billion) Forecast by Kit Type, 2020-2035
  • Table 52: Eastern Europe 3D Printed Packaging Kit Market Volume (Units) Forecast by Kit Type, 2020-2035
  • Table 53: Eastern Europe 3D Printed Packaging Kit Market Value (USD Billion) Forecast by Material Used, 2020-2035
  • Table 54: Eastern Europe 3D Printed Packaging Kit Market Volume (Units) Forecast by Material Used, 2020-2035
  • Table 55: Eastern Europe 3D Printed Packaging Kit Market Value (USD Billion) Forecast by End-Use Industry, 2020-2035
  • Table 56: Eastern Europe 3D Printed Packaging Kit Market Volume (Units) Forecast by End-Use Industry, 2020-2035
  • Table 57: Middle East & Africa Market Value (USD Billion) Forecast by Country, 2020-2035
  • Table 58: Middle East & Africa Market Volume (Units) Forecast by Country, 2020-2035
  • Table 59: Middle East & Africa Market Value (USD Billion) Forecast by Kit Type, 2020-2035
  • Table 60: Middle East & Africa Market Volume (Units) Forecast by Kit Type, 2020-2035
  • Table 61: Middle East & Africa Market Value (USD Billion) Forecast by Material Used, 2020-2035
  • Table 62: Middle East & Africa Market Volume (Units) Forecast by Material Used, 2020-2035
  • Table 63: Middle East & Africa Market Value (USD Billion) Forecast by End-Use Industry, 2020-2035
  • Table 64: Middle East & Africa Market Volume (Units) Forecast by End-Use Industry, 2020-2035

List of Figures

  • Figure 1: Global Market Value (USD Billion) by Kit Type, 2025-2035
  • Figure 2: Global Market Value (USD Billion) by Material Used, 2025-2035
  • Figure 3: Global Market Value (USD Billion) by End-Use Industry, 2025-2035
  • Figure 4: Global Market Value (USD Billion) by Region, 2025-2035
  • Figure 5: Global Market Value (USD Billion) Analysis by Region, 2020-2035
  • Figure 6: Global Market Volume (Units) Analysis by Region, 2020-2035
  • Figure 7: Global Market Value Share (%) and BPS Analysis by Region, 2025-2035
  • Figure 8: Global Market Y-o-Y Growth (%) Projections by Region, 2025-2035
  • Figure 9: Global Market Value (USD Billion) Analysis by Kit Type, 2020-2035
  • Figure 10: Global Market Volume (Units) Analysis by Kit Type, 2020-2035
  • Figure 11: Global Market Value Share (%) and BPS Analysis by Kit Type, 2025-2035
  • Figure 12: Global Market Y-o-Y Growth (%) Projections by Kit Type, 2025-2035
  • Figure 13: Global Market Value (USD Billion) Analysis by Material Used, 2020-2035
  • Figure 14: Global Market Volume (Units) Analysis by Material Used, 2020-2035
  • Figure 15: Global Market Value Share (%) and BPS Analysis by Material Used, 2025-2035
  • Figure 16: Global Market Y-o-Y Growth (%) Projections by Material Used, 2025-2035
  • Figure 17: Global Market Value (USD Billion) Analysis by End-Use Industry, 2020-2035
  • Figure 18: Global Market Volume (Units) Analysis by End-Use Industry, 2020-2035
  • Figure 19: Global Market Value Share (%) and BPS Analysis by End-Use Industry, 2025-2035
  • Figure 20: Global Market Y-o-Y Growth (%) Projections by End-Use Industry, 2025-2035
  • Figure 21: Global Market Attractiveness by Kit Type, 2025-2035
  • Figure 22: Global Market Attractiveness by Material Used, 2025-2035
  • Figure 23: Global Market Attractiveness by End-Use Industry, 2025-2035
  • Figure 24: Global Market Attractiveness by Region, 2025-2035
  • Figure 25: North America Market Value (USD Billion) by Kit Type, 2025-2035
  • Figure 26: North America Market Value (USD Billion) by Material Used, 2025-2035
  • Figure 27: North America Market Value (USD Billion) by End-Use Industry, 2025-2035
  • Figure 28: North America Market Value (USD Billion) by Country, 2025-2035
  • Figure 29: North America Market Value (USD Billion) Analysis by Country, 2020-2035
  • Figure 30: North America Market Volume (Units) Analysis by Country, 2020-2035
  • Figure 31: North America Market Value Share (%) and BPS Analysis by Country, 2025-2035
  • Figure 32: North America Market Y-o-Y Growth (%) Projections by Country, 2025-2035
  • Figure 33: North America Market Value (USD Billion) Analysis by Kit Type, 2020-2035
  • Figure 34: North America Market Volume (Units) Analysis by Kit Type, 2020-2035
  • Figure 35: North America Market Value Share (%) and BPS Analysis by Kit Type, 2025-2035
  • Figure 36: North America Market Y-o-Y Growth (%) Projections by Kit Type, 2025-2035
  • Figure 37: North America Market Value (USD Billion) Analysis by Material Used, 2020-2035
  • Figure 38: North America Market Volume (Units) Analysis by Material Used, 2020-2035
  • Figure 39: North America Market Value Share (%) and BPS Analysis by Material Used, 2025-2035
  • Figure 40: North America Market Y-o-Y Growth (%) Projections by Material Used, 2025-2035
  • Figure 41: North America Market Value (USD Billion) Analysis by End-Use Industry, 2020-2035
  • Figure 42: North America Market Volume (Units) Analysis by End-Use Industry, 2020-2035
  • Figure 43: North America Market Value Share (%) and BPS Analysis by End-Use Industry, 2025-2035
  • Figure 44: North America Market Y-o-Y Growth (%) Projections by End-Use Industry, 2025-2035
  • Figure 45: North America Market Attractiveness by Kit Type, 2025-2035
  • Figure 46: North America Market Attractiveness by Material Used, 2025-2035
  • Figure 47: North America Market Attractiveness by End-Use Industry, 2025-2035
  • Figure 48: North America Market Attractiveness by Country, 2025-2035
  • Figure 49: Latin America Market Value (USD Billion) by Kit Type, 2025-2035
  • Figure 50: Latin America Market Value (USD Billion) by Material Used, 2025-2035
  • Figure 51: Latin America Market Value (USD Billion) by End-Use Industry, 2025-2035
  • Figure 52: Latin America Market Value (USD Billion) by Country, 2025-2035
  • Figure 53: Latin America Market Value (USD Billion) Analysis by Country, 2020-2035
  • Figure 54: Latin America Market Volume (Units) Analysis by Country, 2020-2035
  • Figure 55: Latin America Market Value Share (%) and BPS Analysis by Country, 2025-2035
  • Figure 56: Latin America Market Y-o-Y Growth (%) Projections by Country, 2025-2035
  • Figure 57: Latin America Market Value (USD Billion) Analysis by Kit Type, 2020-2035
  • Figure 58: Latin America Market Volume (Units) Analysis by Kit Type, 2020-2035
  • Figure 59: Latin America Market Value Share (%) and BPS Analysis by Kit Type, 2025-2035
  • Figure 60: Latin America Market Y-o-Y Growth (%) Projections by Kit Type, 2025-2035
  • Figure 61: Latin America Market Value (USD Billion) Analysis by Material Used, 2020-2035
  • Figure 62: Latin America Market Volume (Units) Analysis by Material Used, 2020-2035
  • Figure 63: Latin America Market Value Share (%) and BPS Analysis by Material Used, 2025-2035
  • Figure 64: Latin America Market Y-o-Y Growth (%) Projections by Material Used, 2025-2035
  • Figure 65: Latin America Market Value (USD Billion) Analysis by End-Use Industry, 2020-2035
  • Figure 66: Latin America Market Volume (Units) Analysis by End-Use Industry, 2020-2035
  • Figure 67: Latin America Market Value Share (%) and BPS Analysis by End-Use Industry, 2025-2035
  • Figure 68: Latin America Market Y-o-Y Growth (%) Projections by End-Use Industry, 2025-2035
  • Figure 69: Latin America Market Attractiveness by Kit Type, 2025-2035
  • Figure 70: Latin America Market Attractiveness by Material Used, 2025-2035
  • Figure 71: Latin America Market Attractiveness by End-Use Industry, 2025-2035
  • Figure 72: Latin America Market Attractiveness by Country, 2025-2035
  • Figure 73: East Asia Market Value (USD Billion) by Kit Type, 2025-2035
  • Figure 74: East Asia Market Value (USD Billion) by Material Used, 2025-2035
  • Figure 75: East Asia Market Value (USD Billion) by End-Use Industry, 2025-2035
  • Figure 76: East Asia Market Value (USD Billion) by Country, 2025-2035
  • Figure 77: East Asia Market Value (USD Billion) Analysis by Country, 2020-2035
  • Figure 78: East Asia Market Volume (Units) Analysis by Country, 2020-2035
  • Figure 79: East Asia Market Value Share (%) and BPS Analysis by Country, 2025-2035
  • Figure 80: East Asia Market Y-o-Y Growth (%) Projections by Country, 2025-2035
  • Figure 81: East Asia Market Value (USD Billion) Analysis by Kit Type, 2020-2035
  • Figure 82: East Asia Market Volume (Units) Analysis by Kit Type, 2020-2035
  • Figure 83: East Asia Market Value Share (%) and BPS Analysis by Kit Type, 2025-2035
  • Figure 84: East Asia Market Y-o-Y Growth (%) Projections by Kit Type, 2025-2035
  • Figure 85: East Asia Market Value (USD Billion) Analysis by Material Used, 2020-2035
  • Figure 86: East Asia Market Volume (Units) Analysis by Material Used, 2020-2035
  • Figure 87: East Asia Market Value Share (%) and BPS Analysis by Material Used, 2025-2035
  • Figure 88: East Asia Market Y-o-Y Growth (%) Projections by Material Used, 2025-2035
  • Figure 89: East Asia Market Value (USD Billion) Analysis by End-Use Industry, 2020-2035
  • Figure 90: East Asia Market Volume (Units) Analysis by End-Use Industry, 2020-2035
  • Figure 91: East Asia Market Value Share (%) and BPS Analysis by End-Use Industry, 2025-2035
  • Figure 92: East Asia Market Y-o-Y Growth (%) Projections by End-Use Industry, 2025-2035
  • Figure 93: East Asia Market Attractiveness by Kit Type, 2025-2035
  • Figure 94: East Asia Market Attractiveness by Material Used, 2025-2035
  • Figure 95: East Asia Market Attractiveness by End-Use Industry, 2025-2035
  • Figure 96: East Asia Market Attractiveness by Country, 2025-2035
  • Figure 97: South Asia & Pacific Market Value (USD Billion) by Kit Type, 2025-2035
  • Figure 98: South Asia & Pacific Market Value (USD Billion) by Material Used, 2025-2035
  • Figure 99: South Asia & Pacific Market Value (USD Billion) by End-Use Industry, 2025-2035
  • Figure 100: South Asia & Pacific Market Value (USD Billion) by Country, 2025-2035
  • Figure 101: South Asia & Pacific Market Value (USD Billion) Analysis by Country, 2020-2035
  • Figure 102: South Asia & Pacific Market Volume (Units) Analysis by Country, 2020-2035
  • Figure 103: South Asia & Pacific Market Value Share (%) and BPS Analysis by Country, 2025-2035
  • Figure 104: South Asia & Pacific Market Y-o-Y Growth (%) Projections by Country, 2025-2035
  • Figure 105: South Asia & Pacific Market Value (USD Billion) Analysis by Kit Type, 2020-2035
  • Figure 106: South Asia & Pacific Market Volume (Units) Analysis by Kit Type, 2020-2035
  • Figure 107: South Asia & Pacific Market Value Share (%) and BPS Analysis by Kit Type, 2025-2035
  • Figure 108: South Asia & Pacific Market Y-o-Y Growth (%) Projections by Kit Type, 2025-2035
  • Figure 109: South Asia & Pacific Market Value (USD Billion) Analysis by Material Used, 2020-2035
  • Figure 110: South Asia & Pacific Market Volume (Units) Analysis by Material Used, 2020-2035
  • Figure 111: South Asia & Pacific Market Value Share (%) and BPS Analysis by Material Used, 2025-2035
  • Figure 112: South Asia & Pacific Market Y-o-Y Growth (%) Projections by Material Used, 2025-2035
  • Figure 113: South Asia & Pacific Market Value (USD Billion) Analysis by End-Use Industry, 2020-2035
  • Figure 114: South Asia & Pacific Market Volume (Units) Analysis by End-Use Industry, 2020-2035
  • Figure 115: South Asia & Pacific Market Value Share (%) and BPS Analysis by End-Use Industry, 2025-2035
  • Figure 116: South Asia & Pacific Market Y-o-Y Growth (%) Projections by End-Use Industry, 2025-2035
  • Figure 117: South Asia & Pacific Market Attractiveness by Kit Type, 2025-2035
  • Figure 118: South Asia & Pacific Market Attractiveness by Material Used, 2025-2035
  • Figure 119: South Asia & Pacific Market Attractiveness by End-Use Industry, 2025-2035
  • Figure 120: South Asia & Pacific Market Attractiveness by Country, 2025-2035
  • Figure 121: Western Europe Market Value (USD Billion) by Kit Type, 2025-2035
  • Figure 122: Western Europe Market Value (USD Billion) by Material Used, 2025-2035
  • Figure 123: Western Europe Market Value (USD Billion) by End-Use Industry, 2025-2035
  • Figure 124: Western Europe Market Value (USD Billion) by Country, 2025-2035
  • Figure 125: Western Europe Market Value (USD Billion) Analysis by Country, 2020-2035
  • Figure 126: Western Europe Market Volume (Units) Analysis by Country, 2020-2035
  • Figure 127: Western Europe Market Value Share (%) and BPS Analysis by Country, 2025-2035
  • Figure 128: Western Europe Market Y-o-Y Growth (%) Projections by Country, 2025-2035
  • Figure 129: Western Europe Market Value (USD Billion) Analysis by Kit Type, 2020-2035
  • Figure 130: Western Europe Market Volume (Units) Analysis by Kit Type, 2020-2035
  • Figure 131: Western Europe Market Value Share (%) and BPS Analysis by Kit Type, 2025-2035
  • Figure 132: Western Europe Market Y-o-Y Growth (%) Projections by Kit Type, 2025-2035
  • Figure 133: Western Europe Market Value (USD Billion) Analysis by Material Used, 2020-2035
  • Figure 134: Western Europe Market Volume (Units) Analysis by Material Used, 2020-2035
  • Figure 135: Western Europe Market Value Share (%) and BPS Analysis by Material Used, 2025-2035
  • Figure 136: Western Europe Market Y-o-Y Growth (%) Projections by Material Used, 2025-2035
  • Figure 137: Western Europe Market Value (USD Billion) Analysis by End-Use Industry, 2020-2035
  • Figure 138: Western Europe Market Volume (Units) Analysis by End-Use Industry, 2020-2035
  • Figure 139: Western Europe Market Value Share (%) and BPS Analysis by End-Use Industry, 2025-2035
  • Figure 140: Western Europe Market Y-o-Y Growth (%) Projections by End-Use Industry, 2025-2035
  • Figure 141: Western Europe Market Attractiveness by Kit Type, 2025-2035
  • Figure 142: Western Europe Market Attractiveness by Material Used, 2025-2035
  • Figure 143: Western Europe Market Attractiveness by End-Use Industry, 2025-2035
  • Figure 144: Western Europe Market Attractiveness by Country, 2025-2035
  • Figure 145: Eastern Europe 3D Printed Packaging Kit Market Value (USD Billion) by Kit Type, 2025-2035
  • Figure 146: Eastern Europe 3D Printed Packaging Kit Market Value (USD Billion) by Material Used, 2025-2035
  • Figure 147: Eastern Europe 3D Printed Packaging Kit Market Value (USD Billion) by End-Use Industry, 2025-2035
  • Figure 148: Eastern Europe 3D Printed Packaging Kit Market Value (USD Billion) by Country, 2025-2035
  • Figure 149: Eastern Europe 3D Printed Packaging Kit Market Value (USD Billion) Analysis by Country, 2020-2035
  • Figure 150: Eastern Europe 3D Printed Packaging Kit Market Volume (Units) Analysis by Country, 2020-2035
  • Figure 151: Eastern Europe 3D Printed Packaging Kit Market Value Share (%) and BPS Analysis by Country, 2025-2035
  • Figure 152: Eastern Europe 3D Printed Packaging Kit Market Y-o-Y Growth (%) Projections by Country, 2025-2035
  • Figure 153: Eastern Europe 3D Printed Packaging Kit Market Value (USD Billion) Analysis by Kit Type, 2020-2035
  • Figure 154: Eastern Europe 3D Printed Packaging Kit Market Volume (Units) Analysis by Kit Type, 2020-2035
  • Figure 155: Eastern Europe 3D Printed Packaging Kit Market Value Share (%) and BPS Analysis by Kit Type, 2025-2035
  • Figure 156: Eastern Europe 3D Printed Packaging Kit Market Y-o-Y Growth (%) Projections by Kit Type, 2025-2035
  • Figure 157: Eastern Europe 3D Printed Packaging Kit Market Value (USD Billion) Analysis by Material Used, 2020-2035
  • Figure 158: Eastern Europe 3D Printed Packaging Kit Market Volume (Units) Analysis by Material Used, 2020-2035
  • Figure 159: Eastern Europe 3D Printed Packaging Kit Market Value Share (%) and BPS Analysis by Material Used, 2025-2035
  • Figure 160: Eastern Europe 3D Printed Packaging Kit Market Y-o-Y Growth (%) Projections by Material Used, 2025-2035
  • Figure 161: Eastern Europe 3D Printed Packaging Kit Market Value (USD Billion) Analysis by End-Use Industry, 2020-2035
  • Figure 162: Eastern Europe 3D Printed Packaging Kit Market Volume (Units) Analysis by End-Use Industry, 2020-2035
  • Figure 163: Eastern Europe 3D Printed Packaging Kit Market Value Share (%) and BPS Analysis by End-Use Industry, 2025-2035
  • Figure 164: Eastern Europe 3D Printed Packaging Kit Market Y-o-Y Growth (%) Projections by End-Use Industry, 2025-2035
  • Figure 165: Eastern Europe 3D Printed Packaging Kit Market Attractiveness by Kit Type, 2025-2035
  • Figure 166: Eastern Europe 3D Printed Packaging Kit Market Attractiveness by Material Used, 2025-2035
  • Figure 167: Eastern Europe 3D Printed Packaging Kit Market Attractiveness by End-Use Industry, 2025-2035
  • Figure 168: Eastern Europe 3D Printed Packaging Kit Market Attractiveness by Country, 2025-2035
  • Figure 169: Middle East & Africa Market Value (USD Billion) by Kit Type, 2025-2035
  • Figure 170: Middle East & Africa Market Value (USD Billion) by Material Used, 2025-2035
  • Figure 171: Middle East & Africa Market Value (USD Billion) by End-Use Industry, 2025-2035
  • Figure 172: Middle East & Africa Market Value (USD Billion) by Country, 2025-2035
  • Figure 173: Middle East & Africa Market Value (USD Billion) Analysis by Country, 2020-2035
  • Figure 174: Middle East & Africa Market Volume (Units) Analysis by Country, 2020-2035
  • Figure 175: Middle East & Africa Market Value Share (%) and BPS Analysis by Country, 2025-2035
  • Figure 176: Middle East & Africa Market Y-o-Y Growth (%) Projections by Country, 2025-2035
  • Figure 177: Middle East & Africa Market Value (USD Billion) Analysis by Kit Type, 2020-2035
  • Figure 178: Middle East & Africa Market Volume (Units) Analysis by Kit Type, 2020-2035
  • Figure 179: Middle East & Africa Market Value Share (%) and BPS Analysis by Kit Type, 2025-2035
  • Figure 180: Middle East & Africa Market Y-o-Y Growth (%) Projections by Kit Type, 2025-2035
  • Figure 181: Middle East & Africa Market Value (USD Billion) Analysis by Material Used, 2020-2035
  • Figure 182: Middle East & Africa Market Volume (Units) Analysis by Material Used, 2020-2035
  • Figure 183: Middle East & Africa Market Value Share (%) and BPS Analysis by Material Used, 2025-2035
  • Figure 184: Middle East & Africa Market Y-o-Y Growth (%) Projections by Material Used, 2025-2035
  • Figure 185: Middle East & Africa Market Value (USD Billion) Analysis by End-Use Industry, 2020-2035
  • Figure 186: Middle East & Africa Market Volume (Units) Analysis by End-Use Industry, 2020-2035
  • Figure 187: Middle East & Africa Market Value Share (%) and BPS Analysis by End-Use Industry, 2025-2035
  • Figure 188: Middle East & Africa Market Y-o-Y Growth (%) Projections by End-Use Industry, 2025-2035
  • Figure 189: Middle East & Africa Market Attractiveness by Kit Type, 2025-2035
  • Figure 190: Middle East & Africa Market Attractiveness by Material Used, 2025-2035
  • Figure 191: Middle East & Africa Market Attractiveness by End-Use Industry, 2025-2035
  • Figure 192: Middle East & Africa Market Attractiveness by Country, 2025-2035

Frequently Asked Questions

How big is the 3D printed packaging kit market in 2025?

The global 3D printed packaging kit market is estimated to be valued at USD 1.5 billion in 2025.

What will be the size of the 3D printed packaging kit market in 2035?

The market size for the 3D printed packaging kit market is projected to reach USD 2.4 billion by 2035.

How much will be the 3D printed packaging kit market growth between 2025 and 2035?

The 3D printed packaging kit market is expected to grow at a CAGR of 4.8% between 2025 and 2035.

What are the key materials used in the 3D printed packaging kit market?

The key materials used in the 3D printed packaging kit market include plastics/polymers (PLA, ABS, PETG, Nylon), resins, metals, composites, and bioprinting materials.

Which material segment is expected to contribute significant share in the 3D printed packaging kit market in 2025?

The plastics/polymers segment is projected to account for the highest share of 62.4% in the 3D printed packaging kit market in 2025.

Explore Similar Insights

Future Market Insights

3D Printed Packaging Kit Market