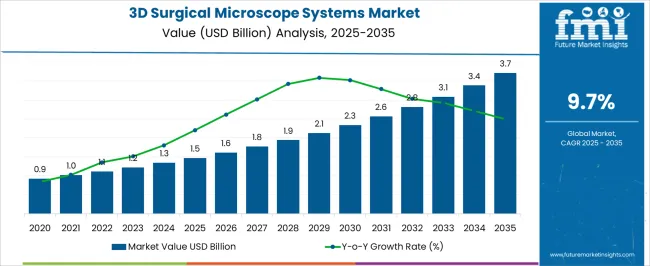
The 3D Surgical Microscope Systems Market is estimated to be valued at USD 1.5 billion in 2025 and is projected to reach USD 3.7 billion by 2035, registering a compound annual growth rate (CAGR) of 9.7% over the forecast period.
| Metric | Value |
|---|---|
| 3D Surgical Microscope Systems Market Estimated Value in (2025 E) | USD 1.5 billion |
| 3D Surgical Microscope Systems Market Forecast Value in (2035 F) | USD 3.7 billion |
| Forecast CAGR (2025 to 2035) | 9.7% |
The 3D Surgical Microscope Systems market is experiencing steady growth, driven by the increasing demand for minimally invasive surgical procedures and high-precision imaging in complex medical interventions. The adoption of 3D surgical microscopes is being supported by advancements in optics, digital imaging, and real-time visualization technologies, which provide enhanced depth perception, magnification, and spatial accuracy. Hospitals and specialty surgical centers are increasingly integrating these systems to improve surgical outcomes, reduce operation times, and enhance patient safety.
The growing focus on neuro and spine surgeries, ear, nose, and throat procedures, and microsurgical interventions is further accelerating market adoption. Investments in healthcare infrastructure, coupled with training programs for surgeons and clinical staff, are supporting wider acceptance of 3D surgical microscope systems.
As regulatory approvals and clinical validation expand, the market is expected to benefit from increased adoption in emerging regions and advanced healthcare facilities Continuous innovation in ergonomic design, image processing, and multi-angle visualization is shaping the market’s growth trajectory, ensuring long-term opportunities for manufacturers and healthcare providers alike.
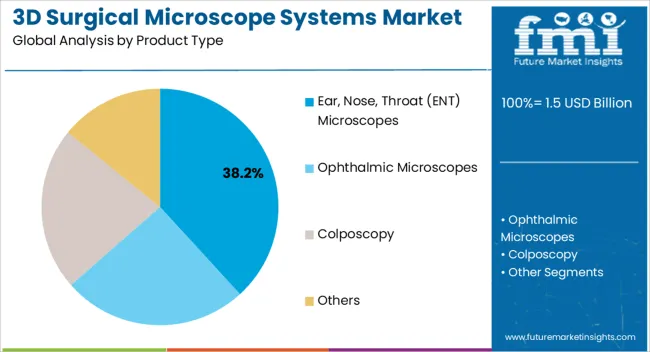
The ear, nose, and throat (ENT) microscopes segment is projected to hold 38.2% of the market revenue in 2025, establishing it as the leading product type. Growth in this segment is being driven by the increasing prevalence of ENT disorders, rising surgical procedures, and the need for high-precision visualization in delicate interventions. ENT microscopes provide superior image clarity, enhanced depth perception, and adjustable magnification, which enable surgeons to perform complex procedures with improved accuracy and reduced risks.
Integration of 3D imaging technology allows real-time visualization of anatomical structures, improving surgical outcomes and reducing post-operative complications. Hospitals and specialized surgical centers are adopting ENT microscopes to enhance patient safety and operational efficiency.
Continuous technological improvements, including better illumination systems and ergonomic designs, are further boosting adoption The combination of clinical effectiveness, precision, and workflow efficiency reinforces the leadership of the ENT microscopes segment, which is expected to maintain dominance as surgical demand and technological adoption continue to grow.
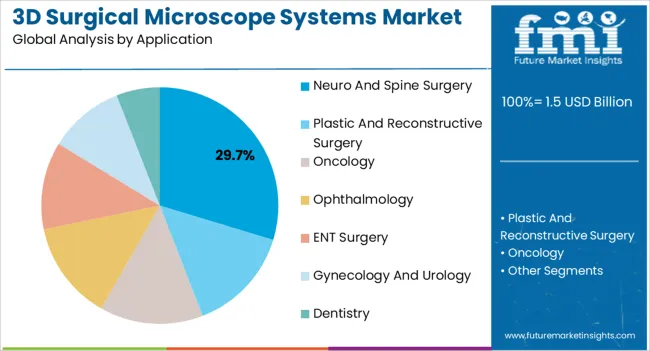
The neuro and spine surgery application segment is anticipated to account for 29.7% of the market revenue in 2025, making it the leading application area. Growth is being driven by the increasing incidence of neurological disorders, spinal deformities, and complex brain surgeries that require high-precision imaging and enhanced surgical visualization. 3D surgical microscopes provide surgeons with superior depth perception, stereoscopic imaging, and real-time anatomical visualization, which improve procedural accuracy and reduce the risk of complications.
Integration with navigation systems and digital recording capabilities further enhances surgical planning and post-operative analysis. Hospitals and surgical centers are investing in these technologies to optimize patient outcomes, improve efficiency, and enhance surgeon confidence during critical procedures.
Rising awareness of minimally invasive surgical approaches and the adoption of advanced imaging systems in specialized healthcare facilities continue to reinforce growth in this application segment As technology evolves, neuro and spine surgery is expected to remain a primary driver of 3D surgical microscope system adoption globally.
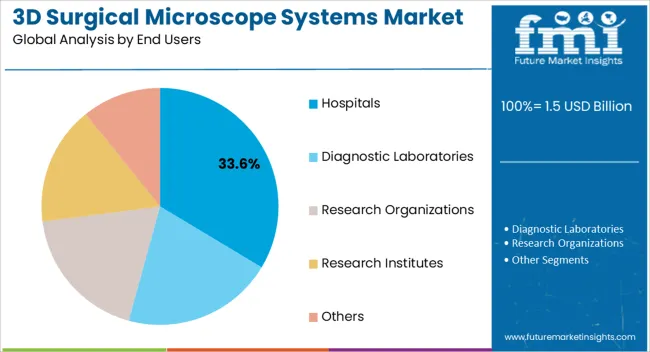
The hospitals end-user segment is projected to hold 33.6% of the market revenue in 2025, establishing it as the leading end-use category. Growth is being driven by the increasing investment in advanced surgical infrastructure and the rising number of complex surgical procedures being performed in hospitals. Hospitals are adopting 3D surgical microscope systems to enhance operational efficiency, improve patient safety, and provide superior imaging for various surgical specialties including neuro, ENT, ophthalmology, and plastic surgery.
The ability to integrate these systems into existing operating rooms and combine them with digital imaging and recording tools adds value and improves workflow efficiency. Staff training programs and enhanced ergonomics in microscope design further facilitate adoption.
The scalability of these systems for multiple surgical applications ensures cost efficiency and broad utility As hospitals continue to expand minimally invasive and high-precision surgical services, reliance on 3D surgical microscope systems is expected to grow, reinforcing the segment’s market leadership and supporting sustained demand for advanced imaging technologies.
Rising disease incidences, infection rates, increasing demand for improved diagnostic techniques, increasing spending on healthcare, government funding, and rising research and development efforts are some of the factors driving the overall market of 3D surgical microscope systems.
The creative present-day surgical magnifying instruments can be set on a tabletop, worn by the specialist on the head, or mounted on a stand, which empowers the specialist and patient to pick up a superior perspective of the objective site. Further, the 3D surgical microscope systems discover their applications in dentistry, gynecology, ophthalmology urology, neurosurgery, spine surgery, oncology, reconstructive surgeries, and so on.
According to WHO insights, growth was the main driver of 0.9 million deaths in 2020. The previously mentioned number is anticipated to ascend by around 70% by 2035, which, thus, is relied upon to increase the interest in 3D surgical microscope systems in the worldwide market. Moreover, innovative progressions as far as improved permeability, compactness, and steadiness are relied upon to be the key variables driving the overall growth of the market.
A few other factors driving the growth of the 3D surgical microscope systems incorporate the wide utilization of fluorescence picture-guided surgery (FIGS), ascend in several ophthalmic and dental surgeries, and progressions in customized microscopy solutions and healthcare facilities. Further, the popularity of 3D surgical microscope systems in hospitals, diagnostic centers, and research organizations is surging the growth of the market.
High capital investment in the equipment for 3D surgical microscope systems is derailing the progress of the market. In addition, heavy maintenance costs are curbing the overall growth of the adoption of the 3D surgical microscope systems market.
A small number of highly skilled operators along with stringent regulatory compliance is hindering the growth of the market.
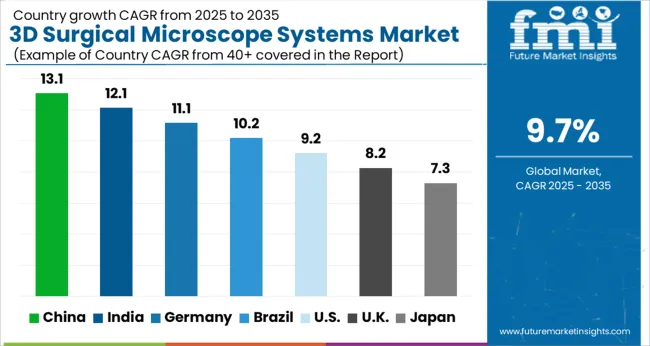
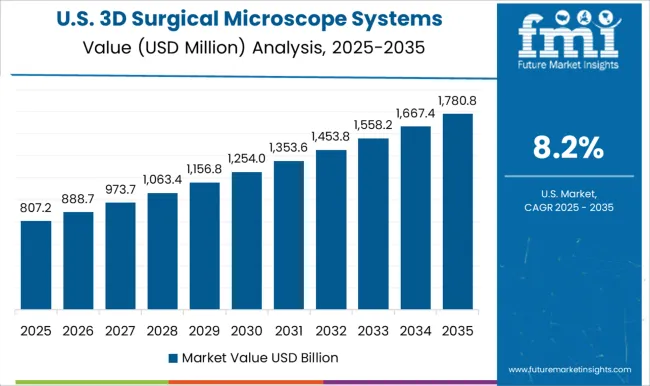
With high technological advancements, and research activities in molecular diagnostics, North America is expected to dominate the world market. Additionally, quality diagnostics, favorable reimbursement scenarios, government funding, established players in the market, and availability of trained technicians especially in the United States of America create the established market for 3D surgical microscope systems.
Owing to the reasons mentioned above, North America is expected to possess a market share of 36.3% from the forecast period 2025 to 2035.
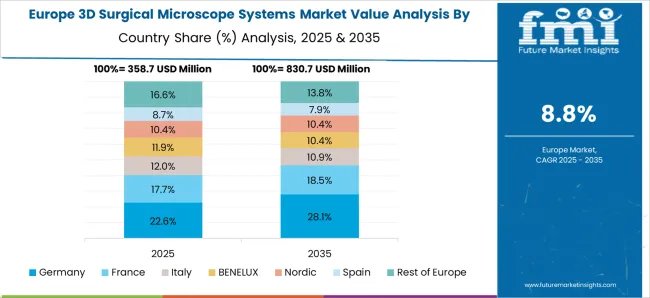
Europe is expected to be the next leading market for digital surgical manufacturers. Concerning growth rate, Europe is leading because of growing economies, increasing advanced surgical procedures & research activities, increasing patient pool, and improved healthcare opportunities. Moreover, the development of advanced healthcare facilities in the United Kingdom and Germany is driving the growth of the 3D surgical microscope systems market. Due to all these factors, Europe is expected to hold a market share of 28.3% in the assessment period 2025 to 2035.
Market to Witness a Transformative 11.2% CAGR between the Analysis Periods
There is a rise in chronic diseases and investments in healthcare infrastructure. Advanced systems provide surgeons with enhanced visualization and precision during surgical procedures, leading to improved patient outcomes.
The Indian government's initiatives to improve healthcare facilities and promote medical advancements have further contributed to the adoption of 3D surgical microscope systems. However, cost constraints and the need for specialized training remain challenges in the market.
These advanced microscopes offer high-resolution imaging, improved depth perception, and advanced optics, enabling ENT surgeons to perform intricate surgeries with precision. Further, the growing prevalence of ENT-related disorders and advancements in ENT surgical techniques drive the demand for ENT microscopes.
Technological advancements, such as integrated cameras for real-time video recording and documentation, enhance collaboration and improve patient care. Further, the share of ENT microscopes in the 3D surgical microscope systems market is expected to continue expanding as the field of otolaryngology evolves and the demand for advanced ENT procedures and diagnostics increases.
Hospitals hold a substantial share of 62.10% in the 3D surgical microscope systems market. These systems are extensively utilized within hospital settings for various surgical procedures across different specialties such as neurosurgery, ophthalmology, otolaryngology, orthopedics, and plastic surgery.
Hospitals can provide surgeons with enhanced visualization capabilities, enabling precise and accurate interventions, by incorporating 3D surgical microscope systems. These advanced systems offer features like high-definition imaging, real-time video recording, and integrated documentation solutions, supporting surgical planning, training, and research. In addition, hospitals collaborate with medical device manufacturers and suppliers to acquire the latest systems, considering factors such as performance, compatibility, cost-effectiveness, and after-sales support.
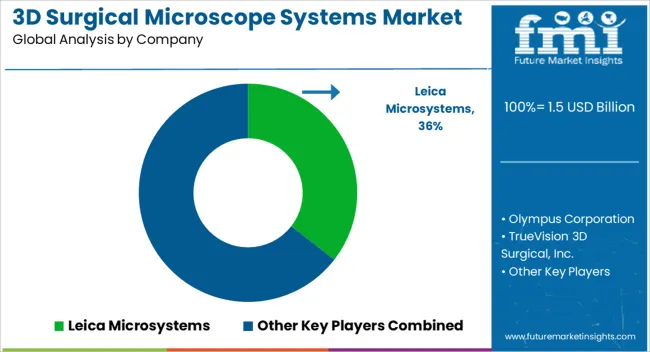
Some of the key players operating in the 3D surgical microscope systems market include Leica Microsystems, Olympus Corporation, TrueVision 3D Surgical, Inc., Alcon, Carl Zeiss Meditec AG, Chammed Co., Ltd., Seiler Instrument, Inc., Hagg-Streit Surgical GmbH, Synaptive Medical, Topcon Corp., Takagi Seiko Co., Ltd., Hagg-Streit Surgical GmbH, Synaptive Medical, ARI Medical Technology Co., Ltd., and others.
There are several leading players in the market and established brands increase the competition. New technologies in this sector are cutting-edge for the market. Further, strategic mergers and partnerships between companies and academic institutions are also booming growth.
| Attributes | Details |
|---|---|
| Growth Rate | CAGR of 9.7% from 2025 to 2035 |
| Base Year of Estimation | 2025 |
| Historical Data | 2020 to 2025 |
| Forecast Period | 2025 to 2035 |
| Quantitative Units | Revenue in USD million and Volume in Units and F-CAGR from 2025 to 2035 |
| Report Coverage | Revenue Forecast, Volume Forecast, Company Ranking, Competitive Landscape, growth factors, Trends, and Pricing Analysis |
| Key Segments Covered | Product Type, Application, End User, By Region |
| Regions Covered | North America; Latin America; Europe; East Asia; South Asia; The Middle East & Africa; Oceania |
| Key Countries Profiled | The United States, Canada, Brazil, Mexico, Germany, Italy, France, The United Kingdom, Spain, Russia, China, Japan, India, GCC Countries, Australia |
| Key Companies Profiled | Leica Microsystems; Olympus Corporation; TrueVision 3D Surgical, Inc.; Alcon |
| Customization & Pricing | Available upon Request |
The global 3D surgical microscope systems market is estimated to be valued at USD 1.5 billion in 2025.
The market size for the 3D surgical microscope systems market is projected to reach USD 3.7 billion by 2035.
The 3D surgical microscope systems market is expected to grow at a 9.7% CAGR between 2025 and 2035.
The key product types in 3D surgical microscope systems market are ear, nose, throat (ent) microscopes, ophthalmic microscopes, colposcopy and others.
In terms of application, neuro and spine surgery segment to command 29.7% share in the 3D surgical microscope systems market in 2025.


Our Research Products

The "Full Research Suite" delivers actionable market intel, deep dives on markets or technologies, so clients act faster, cut risk, and unlock growth.

The Leaderboard benchmarks and ranks top vendors, classifying them as Established Leaders, Leading Challengers, or Disruptors & Challengers.

Locates where complements amplify value and substitutes erode it, forecasting net impact by horizon

We deliver granular, decision-grade intel: market sizing, 5-year forecasts, pricing, adoption, usage, revenue, and operational KPIs—plus competitor tracking, regulation, and value chains—across 60 countries broadly.

Spot the shifts before they hit your P&L. We track inflection points, adoption curves, pricing moves, and ecosystem plays to show where demand is heading, why it is changing, and what to do next across high-growth markets and disruptive tech

Real-time reads of user behavior. We track shifting priorities, perceptions of today’s and next-gen services, and provider experience, then pace how fast tech moves from trial to adoption, blending buyer, consumer, and channel inputs with social signals (#WhySwitch, #UX).

Partner with our analyst team to build a custom report designed around your business priorities. From analysing market trends to assessing competitors or crafting bespoke datasets, we tailor insights to your needs.
Supplier Intelligence
Discovery & Profiling
Capacity & Footprint
Performance & Risk
Compliance & Governance
Commercial Readiness
Who Supplies Whom
Scorecards & Shortlists
Playbooks & Docs
Category Intelligence
Definition & Scope
Demand & Use Cases
Cost Drivers
Market Structure
Supply Chain Map
Trade & Policy
Operating Norms
Deliverables
Buyer Intelligence
Account Basics
Spend & Scope
Procurement Model
Vendor Requirements
Terms & Policies
Entry Strategy
Pain Points & Triggers
Outputs
Pricing Analysis
Benchmarks
Trends
Should-Cost
Indexation
Landed Cost
Commercial Terms
Deliverables
Brand Analysis
Positioning & Value Prop
Share & Presence
Customer Evidence
Go-to-Market
Digital & Reputation
Compliance & Trust
KPIs & Gaps
Outputs
Full Research Suite comprises of:
Market outlook & trends analysis
Interviews & case studies
Strategic recommendations
Vendor profiles & capabilities analysis
5-year forecasts
8 regions and 60+ country-level data splits
Market segment data splits
12 months of continuous data updates
DELIVERED AS:
PDF EXCEL ONLINE
3D Imaging Surgical Solution Market Size and Share Forecast Outlook 2025 to 2035
3D Printed Surgical Models Market Analysis - Size, Share, and Forecast 2025 to 2035
Surgical Operating Microscope Market Forecast and Outlook 2025 to 2035
3D Orthopedic Scanning Systems Market
Demand for 3D Imaging Surgical Solution in Japan Size and Share Forecast Outlook 2025 to 2035
Demand for 3D Imaging Surgical Solution in USA Size and Share Forecast Outlook 2025 to 2035
Robot Assisted Surgical Microscope Market Size and Share Forecast Outlook 2025 to 2035
Advanced (3D/4D) Visualization Systems Market Analysis by Platform, End User, Application, and Region through 2035
Directed Energy-Based Surgical Systems Market Growth – Forecast 2025 to 2035
3D Somatosensory Virtual Fitting Market Size and Share Forecast Outlook 2025 to 2035
3D Printing Industry Analysis in Middle East Size and Share Forecast Outlook 2025 to 2035
Surgical Tourniquet Market Size and Share Forecast Outlook 2025 to 2035
3D Printed Dental Brace Market Size and Share Forecast Outlook 2025 to 2035
3D Reverse Engineering Software Market Forecast and Outlook 2025 to 2035
3D Automatic Optical Inspection Machine Market Size and Share Forecast Outlook 2025 to 2035
3D Ready Organoid Expansion Service Market Size and Share Forecast Outlook 2025 to 2035
3D-Printed Prosthetic Implants Market Size and Share Forecast Outlook 2025 to 2035
3D Printing Ceramics Market Size and Share Forecast Outlook 2025 to 2035
Microscope Digital Camera Market Size and Share Forecast Outlook 2025 to 2035
3D NAND Flash Memory Market Size and Share Forecast Outlook 2025 to 2035

Thank you!
You will receive an email from our Business Development Manager. Please be sure to check your SPAM/JUNK folder too.
Chat With
MaRIA