3D Laser Scanner Market Size and Share Forecast Outlook 2025 to 2035

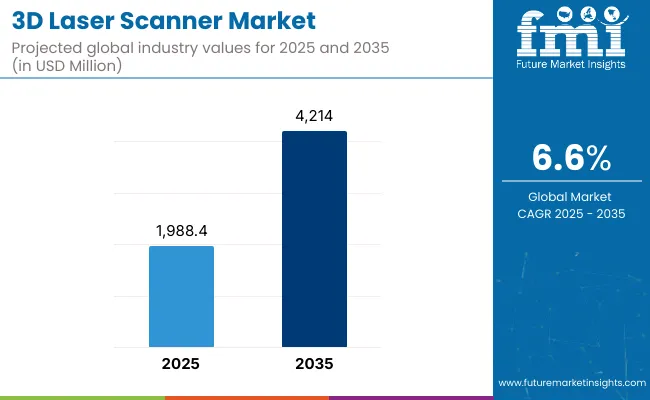
The global 3D laser scanner market is projected to reach USD 1,988.4 million in 2025 and is expected to grow to USD 4,214.0 million by 2035, reflecting a CAGR of 6.6% during the forecast period. Growth is supported by the increasing demand for accurate, real-time data acquisition across sectors such as aerospace, automotive, healthcare, and industrial manufacturing.
Quick Stats for 3D Laser Scanner Market

  • Industry Value (2025): USD 1,988.4 million
  • Forecast Value (2035): USD 4,214.0 million
  • Forecast CAGR: 6.6%
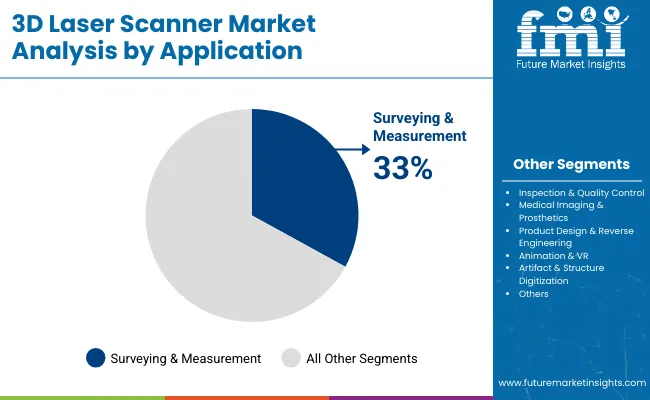
  • Leading Application (2025): Surveying & Measurement (33% share)
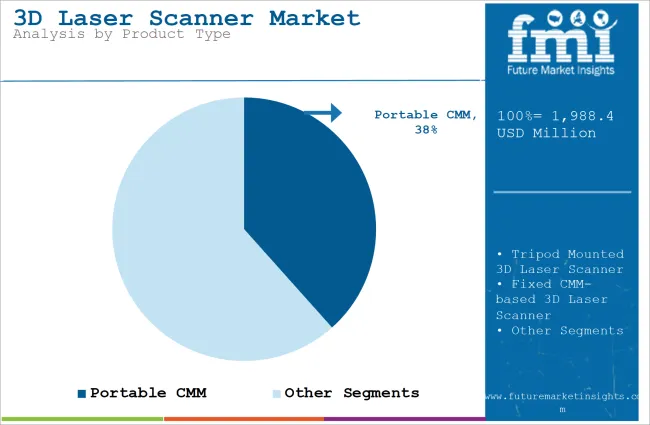
  • Top Product Type: Handheld 3D Laser Scanners (37% share in 2025)
  • Key Growth Region: Asia-Pacific (highest growth rate)
  • Top Key Players: FARO Technologies, Hexagon AB, Leica Geosystems, Trimble, RIEGL

3d Laser Scanner Market

Attributes Key Insights
Estimated Market Value, 2025 USD 1,988.4 million
Projected Market Value, 2035 USD 4,214.0 million
Market Value CAGR (2025 to 2035) 6.6%

These devices offer non-contact measurement capabilities that enable precise geometry capture and digital modeling of physical objects. 3D laser scanning technology uses laser light or structured beams to capture the dimensions of objects, generating point clouds that can be processed into high-fidelity 3D models.

The adoption of this technology helps reduce labor costs and material waste while improving productivity and quality assurance. These advantages have accelerated its application in reverse engineering, product design, quality inspection, and construction management.

Key growth drivers include the increasing integration of 3D scanning in industrial automation, infrastructure development, and healthcare applications such as prosthetics design and surgical planning. The automotive industry continues to adopt 3D scanning for component validation and prototyping, while aerospace manufacturers use it for maintenance, repair, and overhaul (MRO) processes. In healthcare, scanning systems are being deployed to create customized implants and assist in diagnostic imaging workflows.

Technological advancements have led to the development of portable and tripod-mounted scanners, improving mobility and reducing dependency on fixed installations. Tripod-mounted scanners are expected to dominate due to their suitability for high-precision tasks in construction and large-scale industrial applications. Integration with cloud-based platforms and software for data analytics and visualization further enhances the utility of these systems, supporting digital twin creation and real-time project monitoring.

North America and Europe are expected to remain key markets, driven by strong industrial bases, early technology adoption, and supportive infrastructure for advanced manufacturing. Asia-Pacific is emerging as a high-growth region, supported by rapid industrialization, automotive production, and smart manufacturing initiatives.

Semi-annual Market Update

The table below presents a comparative assessment of the variation in CAGR over six months for the base year (2024) and current year (2025) for the global 3D Laser Scanner market. This analysis reveals crucial shifts in market performance and indicates revenue realization patterns, thus providing stakeholders with a better vision of the market growth trajectory over the year. The first half of the year, or H1, spans from January to June. The second half, H2, includes the months from July to December.

The below table presents the expected CAGR for the global 3D Laser Scanner sales over several semi-annual periods spanning from 2024 to 2034. In the first half (H1) from 2024 to 2034, the business is predicted to surge at a CAGR of 6.1%, followed by a slightly higher growth rate of 6.8% in the second half (H2).

Particular Value CAGR
H1 (2024 to 2034) 6.1%
H2 (2024 to 2034) 6.8%
H1 (2025 to 2035) 6.3%
H2 (2025 to 2035) 6.9%

Moving into the subsequent period, from H1 2025 to H2 2035, the CAGR is projected to increase slightly to 6.3% in the first half and remain relatively moderate at 6.8% in the second half. In the first half (H1) the market witnessed an increase of 20 BPS while in the second half (H2), the market witnessed an increase of 10 BPS.
Analyzing 3d Laser Scanner Market by Top Investment Segments

Surveying and Measurement Applications to Lead Adoption in Geospatial and Construction Sectors

3d Laser Scanner Market Analysis By Application

Surveying and measurement applications are estimated to hold 33% share of the 3D laser scanner market in 2025 and are projected to grow at a CAGR of 6.8% through 2035. Increased deployment has been driven by the demand for high-precision topographical data in infrastructure projects, including highways, tunnels, and rail networks.

These scanners enable accurate 3D mapping for site planning, digital twins, and structural analysis, reducing rework and enhancing safety compliance. Integration with GIS systems and compatibility with BIM platforms has strengthened adoption in urban planning and civil engineering. Government-led smart city projects across Asia-Pacific and regulatory mandates for digital construction models in Europe are further reinforcing application growth in this segment.
Handheld Scanners Expected to Dominate Product Use for Portability and On-Site Efficiency

3d Laser Scanner Market Analysis By Product Type

Handheld 3D laser scanners are projected to capture 37% of the global market share in 2025 and are forecast to register a CAGR of 6.9% through 2035. These devices have been adopted extensively due to their mobility, which facilitates scanning in confined spaces and dynamic environments.

The segment has gained traction in automotive reverse engineering, healthcare prosthetic design, and quality assurance operations, where portability and flexibility are critical. Recent technological enhancements such as wireless connectivity, lightweight design, and real-time point cloud visualization have improved usability for on-field engineers and inspection teams. Demand is further supported by cost efficiency compared to stationary systems, particularly in small-scale industrial and heritage digitization projects.
Time-of-Flight Technology to Remain Leading Due to Long-Range Measurement Capabilities

3d Laser Scanner Market Analysis By Technology

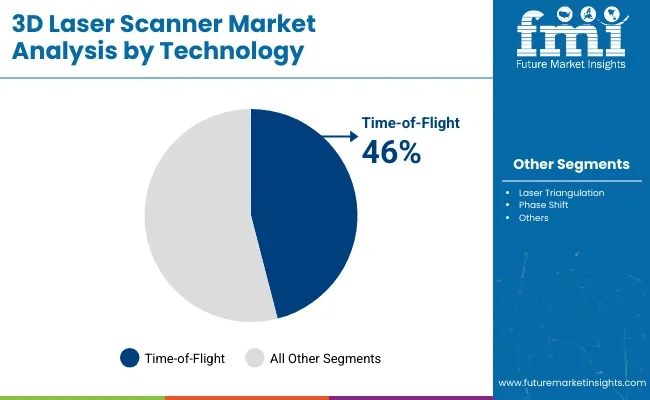
Time-of-Flight (ToF) technology is estimated to account for 46% share of the 3D laser scanner market in 2025 and is expected to grow at a CAGR of 6.7% through 2035. This dominance is driven by its ability to capture accurate measurements over long distances, making it ideal for surveying large infrastructure projects, mines, and utility networks.

ToF scanners are extensively used in geospatial mapping and energy sector applications due to their rapid scanning capability and operational efficiency in outdoor environments. Advancements in laser pulse precision and integration with LiDAR systems have further enhanced their adoption in autonomous navigation and aerial mapping. Investment in ToF-based mobile mapping solutions for smart transportation projects continues to boost its application footprint globally.
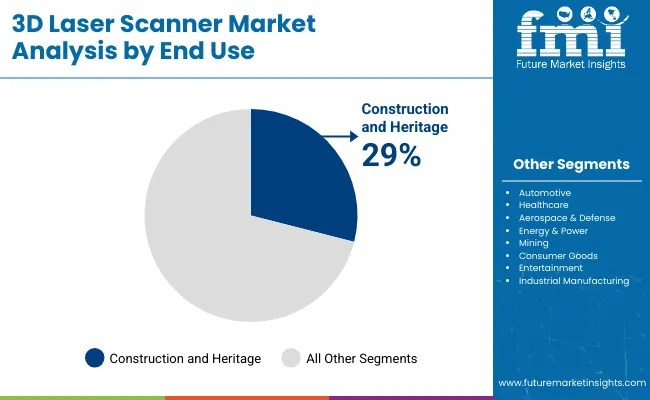
Construction and Heritage Preservation End-Use Driving Demand for Precision and Structural Integrity Assessment

3d Laser Scanner Market Analysis By End Use

Construction and heritage preservation applications are projected to represent 29% of the 3D laser scanner market in 2025, advancing at a CAGR of 6.5% through 2035. These scanners have been deployed widely for as-built documentation, deformation monitoring, and restoration planning of historic structures. Adoption has been driven by the need for accurate digital models to reduce construction errors and preserve cultural assets.

Building Information Modeling (BIM) integration has enhanced the utility of scanners in structural audits and facility management. Governments across Europe and the Middle East have invested significantly in heritage conservation projects, accelerating technology uptake. Increasing emphasis on sustainable construction practices and regulatory compliance in safety inspections is expected to maintain growth momentum for this segment.

Key Industry Highlights

Rising Advances and Adoption of Innovative Technologies in the Construction Sector Will Increase Demand for 3D Scanners

Asia Pacific is one of the areas with a sizable proportion of the 3D laser scanner market. With its rising application in surveying at forthcoming onshore and offshore projects, pipelines and subsea models, etc., emerging economies in Asia Pacific are likely to exhibit prospective chances in the 3D laser scanners market.

The 3D Laser Scanner market is expanding at a rapid pace, thanks to rapid technological improvements. Artificial intelligence and machine learning advancements will boost 3D Laser Scanner applications and drive demand throughout the projected period.

Furthermore, a new generation 3D Laser Scanner with improved performance offers greater precision and versatility, with easy integration into systems, boosting expansion in the region's 3D Laser Scanner sector.

However, a paradigm shift toward a connected world, as well as a rising need for downsizing, are driving additional improvements in the 3D Laser Scanner market and the development of smarter goods. Because of the aforementioned factors, the Asia Pacific market for 3D laser scanners will rise at a 7.7% CAGR till 2035.

Extensive Applications in a Variety of End-Use Industries to Boost Market Growth

The flexibility of mobility included into the device is one of the most active reasons driving the growth of the 3D laser scanner industry. It is the most dependable technology for providing real-time visualization and a better degree of accuracy than other market options. The adoption of novel technologies in many businesses, regardless of industry, is projected to boost the 3D laser scanner market in the near future.

Countries such as the United States are expected to use 3D laser scanners to analyze crime scenes. Recent demos in Nevada employed 3D laser scanning capabilities to assist detectives in solving crimes involving weapon trajectories. Furthermore, these 0-R3 tiny artificially intelligent cars are likely to be seen on Dubai streets for patrolling and security purposes. The truck will be outfitted with a deployed drone 3D laser scanners slam technology to check for criminals, automobiles, and suspected explosives from a distance of 330 feet.

3D laser scanners are quickly becoming a crucial component in the building industry. A 3D laser scanner can collect topographical information at regions that people cannot access via the Internet of Things (IoT) using cutting-edge technology. During the forecast period, such desire to boost automated workflow adapted with reduced chance of human mistake is likely to drive the 3D laser scanners market.

Expanding Applications in Infrastructure Development and Smart Cities

Growth of infrastructure modernization and smart cities worldwide is significantly creating an opportunity for the market of 3D laser scanner. Governments everywhere are investing so heavily in improving transportation networks, utilities, and urban planning through upgrading projects. For instance, the design, development, and maintenance of these smart cities must be done efficiently on layouts, transport systems, and the energy grid and hence require such mappings.

3D laser scanners are providing spatial data of the utmost accuracy and detail to enable the development of digital twins of the urban environment. Authorities can, therefore, track infrastructure, upgrade plans, and predict real-time maintenance requirements. Furthermore, the development of smart buildings relies on 3D laser scanning to take measurements for accurate energy efficiency and structural integrity.

High Maintenance and Installation Costs are Impeding Market Growth

Despite various advantages, 3D laser scanners have some limitations in terms of applications, which limit market growth. For example, the high initial cost of high-resolution 3D scanners, together with the sector’s reliance on non-3D industries, is two important factors restraining the 3D scanning market.

The 3D laser scanner market is significantly impacted by high installation and maintenance costs, which in turn are a strong restraint to widespread adoption. In particular, sophisticated models of this scanner are often used in industries and infrastructure projects requiring significant initial expenditure for purchase and installation. This technology is quite complex, necessitating highly qualified personnel for appropriate installation and calibration, thereby also increasing costs.

The costs of maintenance add to the expense. Regular servicing, software updates, and replacing parts like lasers or sensors will ensure accuracy and efficiency. This cost is typically more for sectors requiring precision scanning, such as automotive, aerospace, and construction. For SMEs, the cost may be too high for them to be able to use it even though the potential benefits are promising.

Market Concentration

Tier 1 companies include industry leaders with annual revenues exceeding USD 100 Million. These companies are currently capturing a significant share of 55% to 60% globally. These frontrunners are characterized by high production capacity and a wide product portfolio.

They are distinguished by extensive expertise in manufacturing and a broad geographical reach, underpinned by a robust consumer base. These firms provide a wide range of products and utilize the latest technology to meet regulatory standards. Prominent companies within Tier 1 include Basis Software, Inc., FARO, Hexagon AB, 3D Digital Corporation, ShapeGrabber Inc., JoeScan, Kreon Technologies and others.

Tier 2 includes most of the small-scale companies operating at the local level-serving niche 3D Laser Scanner vendors with low revenue. These companies are notably oriented toward fulfilling local demands. They are small-scale players and have limited geographical reach. Tier 2, within this context, is recognized as an unorganized segment, denoting a sector characterized by a lack of extensive structure and formalization when compared to organized competitors.
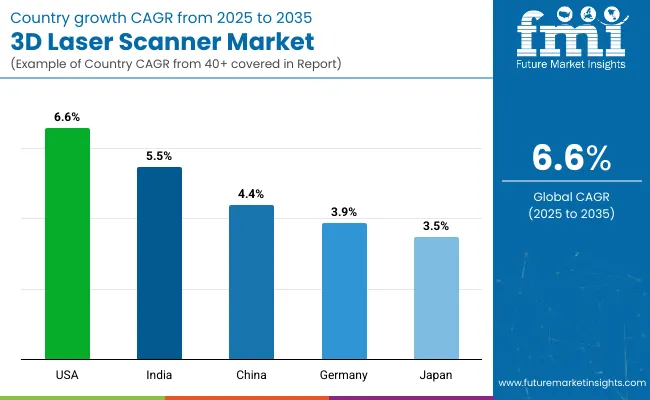
Country-wise Insights

3d Laser Scanner Market Country Wise Analysis

Countries CAGR, 2025 to 2035
The USA 6.6%
India 5.5%
China 4.4%
Germany 3.9%
Japan 3.5%

The section below covers the analysis of the 3D Laser Scanner industry in different countries. Demand analysis of key countries in several regions of the globe, including North America, Asia Pacific, Europe, and others, is provided. The USA is anticipated to remain at the forefront in North America, with a value share of 72.7% in 2035. In South Asia, India is projected to witness a CAGR of 5.5% through 2035.

USA 3D Laser Scanner Market Advancing by Growing Adoption of 3D Scanning Technology

North America is the second-largest region accounting for 28% of the share in the global 3D laser scanner market during the forecast period. The USA is leading the region due to retaining its growth pace during the forecast period, according to the Future Market Insights report. The USA 3D laser scanner market size is rising due to the increased use of 3D laser scanners in cameras to investigate deadly traffic incidents.

Furthermore, the presence of well-known players, face recognition, and iris scanning is driving the market during the forecast period. Computing systems for 3D virtualization are becoming increasingly common as the cost of computers and graphics processors has fallen in recent years.

Moreover, rising 3D scanning enables quick, tailored part replacement increasing the 3D laser scanner market growth during the forecast period. Similarly, these scanners are widely employed in a variety of end-use sectors, including automotive and healthcare which is propelling the US 3D laser scanner market size.

UK 3D Laser Scanner Market Thriving by Rising Automotive Sector Demand

Europe is the largest revenue region, accounting for approximately 30% of the share in the 3D laser scanner market. The UK is leading the market size due to the rising adoption of 3D laser scanner technology in the study of palaeontology. This technique is being used by researchers to explore the interplay between plants and extinct creatures in the UK 3D laser scanner market during the forecast period. Moreover, expanding automotive sector and supremacy in passenger vehicle manufacture, demand is expected to rise throughout the forecast period.

On the other hand, Germany is expected to acquire the lion's share, thanks to the industry's rapid development of 3D scanning technologies. The DAVID Structured Light Scanner (SLS-3) is a 3D scanner designed by DAVID, a German company. The scanner costs roughly USD 4,000 and is suitable for a wide range of applications, including reverse engineering, inspection, and archaeology. The rising use of reverse engineering procedures is propelling the Germany 3D laser scanner market. BMW, a German vehicle manufacturer, was an early adopter of 3D printing and 3D scanning technologies.

China: Construction Boom and Industrial Expansion Propel Growth

China is one of the major market players for 3D laser scanners due to its fast infrastructural development and increasing manufacturing sector. Large-scale investments in smart cities and transportation-related projects boost scanner demand in the construction mapping and surveying space.

An interesting aspect is that the automotive and electronics industries of China demand prototyping and quality assurance through 3D scanners. Another growth factor for this field is the push for digital transformation in manufacturing and industrial automation by the government. Implementing policies in its favour boosts growth further. For SMEs, low prices of locally manufactured scanners act as a driving force.

Positioned as the 'world's workshop', China can maintain demand for high-tech scanning technologies with its continued manufacturing hub status.

Competition Outlook

Companies are advancing their position in the market by developing products with multi-mode scanning capabilities, enhancing versatility for applications such as reverse engineering, industrial inspection, and design. Investment is being made in advanced metrology solutions that improve scanning speed, accuracy, and data processing, particularly in complex sectors like aerospace, automotive, and heavy machinery. These efforts ensure companies can meet the growing demand for high-performance scanning tools.

  • On January 7, 2025, SHINING 3D introduced EinScan Rigil, the world’s first tri-mode laser 3D scanner. The device combines three scanning modes including fine detail, fast capture, and hybrid which offers unmatched flexibility for applications in reverse engineering, industrial inspection, and digital design. The launch strengthens SHINING 3D’s position in high-precision scanning solutions for manufacturing and design sectors.
  • On February 10, 2025, FARO Technologies announced the release of FARO® Leap ST, a next-generation 3D metrology solution designed to improve scanning speed, accuracy, and data processing for complex industrial environments. Leap ST integrates enhanced laser technology and AI-driven software, targeting aerospace, automotive, and heavy machinery applications for precision measurement.

Key Companies

  • FARO Technologies
  • Hexagon AB
  • Leica Geosystems
  • Trimble
  • RIEGL Laser Measurement Systems
  • Artec 3D
  • Shining 3D
  • Creaform
  • Zivid
  • Teledyne Optech
  • Zeiss
  • Nikon Metrology
  • Topcon
  • Revopoint 3D Technologies
  • Polyga Inc.

Key Segments of Market Report

By Application:

On the basis of application the market is segmented into Surveying & Measurement, Inspection & Quality Control, Medical Imaging & Prosthetics, Product Design & Reverse Engineering, Animation & VR, Artifact & Structure Digitization, and Others

By End Use:

On the basis of end use the market is segmented into Automotive, Healthcare, Aerospace & Defense, Energy & Power, Mining, Construction & Heritage Preservation, Consumer Goods, Entertainment, and Industrial Manufacturing

By Product Type:

On the basis of product type the market is segmented into Handheld, Stationary (Tripod Mounted, Fixed), and Airborne

By Technology:

On the basis of technology the market is segmented into Laser Triangulation, Time-of-Flight, and Phase Shift

By Region:

On the basis of region the market is segmented into North America, Latin America, Eastern Europe, Western Europe, South Asia & Pacific, East Asia, Middle East & Africa

Table of Content

  1. Executive Summary
  2. Industry Introduction, including Taxonomy and Market Definition
  3. Market Trends and Success Factors, including Macro-economic Factors, Market Dynamics, and Recent Industry Developments
  4. Global Market Demand Analysis 2020 to 2024 and Forecast 2025 to 2035, including Historical Analysis and Future Projections
  5. Pricing Analysis
  6. Global Market Analysis 2020 to 2024 and Forecast 2025 to 2035
    • Product Type
    • Offerings
    • Frequency Range
    • Application
    • End Use Industries
  7. Global Market Analysis 2020 to 2024 and Forecast 2025 to 2035, By Product Type
    • Tripod Mounted 3D Laser Scanner
    • Fixed CMM-based 3D Laser Scanner
    • Portable CMM Based 3D Laser Scanner
    • Desktop 3D Laser Scanner
  8. Global Market Analysis 2020 to 2024 and Forecast 2025 to 2035, By Offerings
    • Hardware & Software
    • After Services
  9. Global Market Analysis 2020 to 2024 and Forecast 2025 to 2035, By Frequency Range
    • Low Range 3D Laser Scanner
    • Medium Range 3D Laser Scanner
    • High Range 3D Laser Scanner
  10. Global Market Analysis 2020 to 2024 and Forecast 2025 to 2035, By Application
    • Reverse Engineering
    • Quality Control and Inspection
    • Virtual Simulation
    • Face Body Scanning
    • Rapid Prototyping
  11. Global Market Analysis 2020 to 2024 and Forecast 2025 to 2035, By End Use Industries
    • Automotive
    • Health Care
    • Aerospace & Defense
    • Architecture & Construction
    • Energy & Power
    • Tunnel & Mining
  12. Global Market Analysis 2020 to 2024 and Forecast 2025 to 2035, By Region
    • North America
    • Latin America
    • Western Europe
    • Eastern Europe
    • East Asia
    • South Asia Pacific
    • Middle East and Africa
  13. North America Sales Analysis 2020 to 2024 and Forecast 2025 to 2035, by Key Segments and Countries
  14. Latin America Sales Analysis 2020 to 2024 and Forecast 2025 to 2035, by Key Segments and Countries
  15. Western Europe Sales Analysis 2020 to 2024 and Forecast 2025 to 2035, by Key Segments and Countries
  16. Eastern Europe Sales Analysis 2020 to 2024 and Forecast 2025 to 2035, by Key Segments and Countries
  17. East Asia Sales Analysis 2020 to 2024 and Forecast 2025 to 2035, by Key Segments and Countries
  18. South Asia Pacific Sales Analysis 2020 to 2024 and Forecast 2025 to 2035, by Key Segments and Countries
  19. Middle East and Africa Sales Analysis 2020 to 2024 and Forecast 2025 to 2035, by Key Segments and Countries
  20. Sales Forecast 2025 to 2035 by Product Type, Offerings, Frequency Range, Application, and End Use Industries for 30 Countries
  21. Competition Outlook, including Market Structure Analysis, Company Share Analysis by Key Players, and Competition Dashboard
  22. Company Profile
    • Basis Software, Inc.
    • FARO
    • Hexagon AB
    • 3D Digital Corporation
    • ShapeGrabber Inc.
    • JoeScan
    • Kreon Technologies
    • CREAFORM
    • Perceptron Inc.
    • Nikon Metrology NV

List of Tables

  • Table 1: Global Market Value (USD Million) Forecast by Region, 2020-2035
  • Table 2: Global Market Volume (Units) Forecast by Region, 2020-2035
  • Table 3: Global Market Value (USD Million) Forecast by Product Type, 2020-2035
  • Table 4: Global Market Volume (Units) Forecast by Product Type, 2020-2035
  • Table 5: Global Market Value (USD Million) Forecast by Offering, 2020-2035
  • Table 6: Global Market Volume (Units) Forecast by Offering, 2020-2035
  • Table 7: Global Market Value (USD Million) Forecast by Frequency Range, 2020-2035
  • Table 8: Global Market Volume (Units) Forecast by Frequency Range, 2020-2035
  • Table 9: Global Market Value (USD Million) Forecast by Application, 2020-2035
  • Table 10: Global Market Volume (Units) Forecast by Application, 2020-2035
  • Table 11: Global Market Value (USD Million) Forecast by End Use Industry, 2020-2035
  • Table 12: Global Market Volume (Units) Forecast by End Use Industry, 2020-2035
  • Table 13: North America Market Value (USD Million) Forecast by Country, 2020-2035
  • Table 14: North America Market Volume (Units) Forecast by Country, 2020-2035
  • Table 15: North America Market Value (USD Million) Forecast by Product Type, 2020-2035
  • Table 16: North America Market Volume (Units) Forecast by Product Type, 2020-2035
  • Table 17: North America Market Value (USD Million) Forecast by Offering, 2020-2035
  • Table 18: North America Market Volume (Units) Forecast by Offering, 2020-2035
  • Table 19: North America Market Value (USD Million) Forecast by Frequency Range, 2020-2035
  • Table 20: North America Market Volume (Units) Forecast by Frequency Range, 2020-2035
  • Table 21: North America Market Value (USD Million) Forecast by Application, 2020-2035
  • Table 22: North America Market Volume (Units) Forecast by Application, 2020-2035
  • Table 23: North America Market Value (USD Million) Forecast by End Use Industry, 2020-2035
  • Table 24: North America Market Volume (Units) Forecast by End Use Industry, 2020-2035
  • Table 25: Latin America Market Value (USD Million) Forecast by Country, 2020-2035
  • Table 26: Latin America Market Volume (Units) Forecast by Country, 2020-2035
  • Table 27: Latin America Market Value (USD Million) Forecast by Product Type, 2020-2035
  • Table 28: Latin America Market Volume (Units) Forecast by Product Type, 2020-2035
  • Table 29: Latin America Market Value (USD Million) Forecast by Offering, 2020-2035
  • Table 30: Latin America Market Volume (Units) Forecast by Offering, 2020-2035
  • Table 31: Latin America Market Value (USD Million) Forecast by Frequency Range, 2020-2035
  • Table 32: Latin America Market Volume (Units) Forecast by Frequency Range, 2020-2035
  • Table 33: Latin America Market Value (USD Million) Forecast by Application, 2020-2035
  • Table 34: Latin America Market Volume (Units) Forecast by Application, 2020-2035
  • Table 35: Latin America Market Value (USD Million) Forecast by End Use Industry, 2020-2035
  • Table 36: Latin America Market Volume (Units) Forecast by End Use Industry, 2020-2035
  • Table 37: Europe Market Value (USD Million) Forecast by Country, 2020-2035
  • Table 38: Europe Market Volume (Units) Forecast by Country, 2020-2035
  • Table 39: Europe Market Value (USD Million) Forecast by Product Type, 2020-2035
  • Table 40: Europe Market Volume (Units) Forecast by Product Type, 2020-2035
  • Table 41: Europe Market Value (USD Million) Forecast by Offering, 2020-2035
  • Table 42: Europe Market Volume (Units) Forecast by Offering, 2020-2035
  • Table 43: Europe Market Value (USD Million) Forecast by Frequency Range, 2020-2035
  • Table 44: Europe Market Volume (Units) Forecast by Frequency Range, 2020-2035
  • Table 45: Europe Market Value (USD Million) Forecast by Application, 2020-2035
  • Table 46: Europe Market Volume (Units) Forecast by Application, 2020-2035
  • Table 47: Europe Market Value (USD Million) Forecast by End Use Industry, 2020-2035
  • Table 48: Europe Market Volume (Units) Forecast by End Use Industry, 2020-2035
  • Table 49: Asia Pacific Market Value (USD Million) Forecast by Country, 2020-2035
  • Table 50: Asia Pacific Market Volume (Units) Forecast by Country, 2020-2035
  • Table 51: Asia Pacific Market Value (USD Million) Forecast by Product Type, 2020-2035
  • Table 52: Asia Pacific Market Volume (Units) Forecast by Product Type, 2020-2035
  • Table 53: Asia Pacific Market Value (USD Million) Forecast by Offering, 2020-2035
  • Table 54: Asia Pacific Market Volume (Units) Forecast by Offering, 2020-2035
  • Table 55: Asia Pacific Market Value (USD Million) Forecast by Frequency Range, 2020-2035
  • Table 56: Asia Pacific Market Volume (Units) Forecast by Frequency Range, 2020-2035
  • Table 57: Asia Pacific Market Value (USD Million) Forecast by Application, 2020-2035
  • Table 58: Asia Pacific Market Volume (Units) Forecast by Application, 2020-2035
  • Table 59: Asia Pacific Market Value (USD Million) Forecast by End Use Industry, 2020-2035
  • Table 60: Asia Pacific Market Volume (Units) Forecast by End Use Industry, 2020-2035
  • Table 61: MEA Market Value (USD Million) Forecast by Country, 2020-2035
  • Table 62: MEA Market Volume (Units) Forecast by Country, 2020-2035
  • Table 63: MEA Market Value (USD Million) Forecast by Product Type, 2020-2035
  • Table 64: MEA Market Volume (Units) Forecast by Product Type, 2020-2035
  • Table 65: MEA Market Value (USD Million) Forecast by Offering, 2020-2035
  • Table 66: MEA Market Volume (Units) Forecast by Offering, 2020-2035
  • Table 67: MEA Market Value (USD Million) Forecast by Frequency Range, 2020-2035
  • Table 68: MEA Market Volume (Units) Forecast by Frequency Range, 2020-2035
  • Table 69: MEA Market Value (USD Million) Forecast by Application, 2020-2035
  • Table 70: MEA Market Volume (Units) Forecast by Application, 2020-2035
  • Table 71: MEA Market Value (USD Million) Forecast by End Use Industry, 2020-2035
  • Table 72: MEA Market Volume (Units) Forecast by End Use Industry, 2020-2035

List of Figures

  • Figure 1: Global Market Value (USD Million) by Product Type, 2025-2035
  • Figure 2: Global Market Value (USD Million) by Offering, 2025-2035
  • Figure 3: Global Market Value (USD Million) by Frequency Range, 2025-2035
  • Figure 4: Global Market Value (USD Million) by Application, 2025-2035
  • Figure 5: Global Market Value (USD Million) by End Use Industry, 2025-2035
  • Figure 6: Global Market Value (USD Million) by Region, 2025-2035
  • Figure 7: Global Market Value (USD Million) Analysis by Region, 2020-2035
  • Figure 8: Global Market Volume (Units) Analysis by Region, 2020-2035
  • Figure 9: Global Market Value Share (%) and BPS Analysis by Region, 2025-2035
  • Figure 10: Global Market Y-o-Y Growth (%) Projections by Region, 2025-2035
  • Figure 11: Global Market Value (USD Million) Analysis by Product Type, 2020-2035
  • Figure 12: Global Market Volume (Units) Analysis by Product Type, 2020-2035
  • Figure 13: Global Market Value Share (%) and BPS Analysis by Product Type, 2025-2035
  • Figure 14: Global Market Y-o-Y Growth (%) Projections by Product Type, 2025-2035
  • Figure 15: Global Market Value (USD Million) Analysis by Offering, 2020-2035
  • Figure 16: Global Market Volume (Units) Analysis by Offering, 2020-2035
  • Figure 17: Global Market Value Share (%) and BPS Analysis by Offering, 2025-2035
  • Figure 18: Global Market Y-o-Y Growth (%) Projections by Offering, 2025-2035
  • Figure 19: Global Market Value (USD Million) Analysis by Frequency Range, 2020-2035
  • Figure 20: Global Market Volume (Units) Analysis by Frequency Range, 2020-2035
  • Figure 21: Global Market Value Share (%) and BPS Analysis by Frequency Range, 2025-2035
  • Figure 22: Global Market Y-o-Y Growth (%) Projections by Frequency Range, 2025-2035
  • Figure 23: Global Market Value (USD Million) Analysis by Application, 2020-2035
  • Figure 24: Global Market Volume (Units) Analysis by Application, 2020-2035
  • Figure 25: Global Market Value Share (%) and BPS Analysis by Application, 2025-2035
  • Figure 26: Global Market Y-o-Y Growth (%) Projections by Application, 2025-2035
  • Figure 27: Global Market Value (USD Million) Analysis by End Use Industry, 2020-2035
  • Figure 28: Global Market Volume (Units) Analysis by End Use Industry, 2020-2035
  • Figure 29: Global Market Value Share (%) and BPS Analysis by End Use Industry, 2025-2035
  • Figure 30: Global Market Y-o-Y Growth (%) Projections by End Use Industry, 2025-2035
  • Figure 31: Global Market Attractiveness by Product Type, 2025-2035
  • Figure 32: Global Market Attractiveness by Offering, 2025-2035
  • Figure 33: Global Market Attractiveness by Frequency Range, 2025-2035
  • Figure 34: Global Market Attractiveness by Application, 2025-2035
  • Figure 35: Global Market Attractiveness by End Use Industry, 2025-2035
  • Figure 36: Global Market Attractiveness by Region, 2025-2035
  • Figure 37: North America Market Value (USD Million) by Product Type, 2025-2035
  • Figure 38: North America Market Value (USD Million) by Offering, 2025-2035
  • Figure 39: North America Market Value (USD Million) by Frequency Range, 2025-2035
  • Figure 40: North America Market Value (USD Million) by Application, 2025-2035
  • Figure 41: North America Market Value (USD Million) by End Use Industry, 2025-2035
  • Figure 42: North America Market Value (USD Million) by Country, 2025-2035
  • Figure 43: North America Market Value (USD Million) Analysis by Country, 2020-2035
  • Figure 44: North America Market Volume (Units) Analysis by Country, 2020-2035
  • Figure 45: North America Market Value Share (%) and BPS Analysis by Country, 2025-2035
  • Figure 46: North America Market Y-o-Y Growth (%) Projections by Country, 2025-2035
  • Figure 47: North America Market Value (USD Million) Analysis by Product Type, 2020-2035
  • Figure 48: North America Market Volume (Units) Analysis by Product Type, 2020-2035
  • Figure 49: North America Market Value Share (%) and BPS Analysis by Product Type, 2025-2035
  • Figure 50: North America Market Y-o-Y Growth (%) Projections by Product Type, 2025-2035
  • Figure 51: North America Market Value (USD Million) Analysis by Offering, 2020-2035
  • Figure 52: North America Market Volume (Units) Analysis by Offering, 2020-2035
  • Figure 53: North America Market Value Share (%) and BPS Analysis by Offering, 2025-2035
  • Figure 54: North America Market Y-o-Y Growth (%) Projections by Offering, 2025-2035
  • Figure 55: North America Market Value (USD Million) Analysis by Frequency Range, 2020-2035
  • Figure 56: North America Market Volume (Units) Analysis by Frequency Range, 2020-2035
  • Figure 57: North America Market Value Share (%) and BPS Analysis by Frequency Range, 2025-2035
  • Figure 58: North America Market Y-o-Y Growth (%) Projections by Frequency Range, 2025-2035
  • Figure 59: North America Market Value (USD Million) Analysis by Application, 2020-2035
  • Figure 60: North America Market Volume (Units) Analysis by Application, 2020-2035
  • Figure 61: North America Market Value Share (%) and BPS Analysis by Application, 2025-2035
  • Figure 62: North America Market Y-o-Y Growth (%) Projections by Application, 2025-2035
  • Figure 63: North America Market Value (USD Million) Analysis by End Use Industry, 2020-2035
  • Figure 64: North America Market Volume (Units) Analysis by End Use Industry, 2020-2035
  • Figure 65: North America Market Value Share (%) and BPS Analysis by End Use Industry, 2025-2035
  • Figure 66: North America Market Y-o-Y Growth (%) Projections by End Use Industry, 2025-2035
  • Figure 67: North America Market Attractiveness by Product Type, 2025-2035
  • Figure 68: North America Market Attractiveness by Offering, 2025-2035
  • Figure 69: North America Market Attractiveness by Frequency Range, 2025-2035
  • Figure 70: North America Market Attractiveness by Application, 2025-2035
  • Figure 71: North America Market Attractiveness by End Use Industry, 2025-2035
  • Figure 72: North America Market Attractiveness by Country, 2025-2035
  • Figure 73: Latin America Market Value (USD Million) by Product Type, 2025-2035
  • Figure 74: Latin America Market Value (USD Million) by Offering, 2025-2035
  • Figure 75: Latin America Market Value (USD Million) by Frequency Range, 2025-2035
  • Figure 76: Latin America Market Value (USD Million) by Application, 2025-2035
  • Figure 77: Latin America Market Value (USD Million) by End Use Industry, 2025-2035
  • Figure 78: Latin America Market Value (USD Million) by Country, 2025-2035
  • Figure 79: Latin America Market Value (USD Million) Analysis by Country, 2020-2035
  • Figure 80: Latin America Market Volume (Units) Analysis by Country, 2020-2035
  • Figure 81: Latin America Market Value Share (%) and BPS Analysis by Country, 2025-2035
  • Figure 82: Latin America Market Y-o-Y Growth (%) Projections by Country, 2025-2035
  • Figure 83: Latin America Market Value (USD Million) Analysis by Product Type, 2020-2035
  • Figure 84: Latin America Market Volume (Units) Analysis by Product Type, 2020-2035
  • Figure 85: Latin America Market Value Share (%) and BPS Analysis by Product Type, 2025-2035
  • Figure 86: Latin America Market Y-o-Y Growth (%) Projections by Product Type, 2025-2035
  • Figure 87: Latin America Market Value (USD Million) Analysis by Offering, 2020-2035
  • Figure 88: Latin America Market Volume (Units) Analysis by Offering, 2020-2035
  • Figure 89: Latin America Market Value Share (%) and BPS Analysis by Offering, 2025-2035
  • Figure 90: Latin America Market Y-o-Y Growth (%) Projections by Offering, 2025-2035
  • Figure 91: Latin America Market Value (USD Million) Analysis by Frequency Range, 2020-2035
  • Figure 92: Latin America Market Volume (Units) Analysis by Frequency Range, 2020-2035
  • Figure 93: Latin America Market Value Share (%) and BPS Analysis by Frequency Range, 2025-2035
  • Figure 94: Latin America Market Y-o-Y Growth (%) Projections by Frequency Range, 2025-2035
  • Figure 95: Latin America Market Value (USD Million) Analysis by Application, 2020-2035
  • Figure 96: Latin America Market Volume (Units) Analysis by Application, 2020-2035
  • Figure 97: Latin America Market Value Share (%) and BPS Analysis by Application, 2025-2035
  • Figure 98: Latin America Market Y-o-Y Growth (%) Projections by Application, 2025-2035
  • Figure 99: Latin America Market Value (USD Million) Analysis by End Use Industry, 2020-2035
  • Figure 100: Latin America Market Volume (Units) Analysis by End Use Industry, 2020-2035
  • Figure 101: Latin America Market Value Share (%) and BPS Analysis by End Use Industry, 2025-2035
  • Figure 102: Latin America Market Y-o-Y Growth (%) Projections by End Use Industry, 2025-2035
  • Figure 103: Latin America Market Attractiveness by Product Type, 2025-2035
  • Figure 104: Latin America Market Attractiveness by Offering, 2025-2035
  • Figure 105: Latin America Market Attractiveness by Frequency Range, 2025-2035
  • Figure 106: Latin America Market Attractiveness by Application, 2025-2035
  • Figure 107: Latin America Market Attractiveness by End Use Industry, 2025-2035
  • Figure 108: Latin America Market Attractiveness by Country, 2025-2035
  • Figure 109: Europe Market Value (USD Million) by Product Type, 2025-2035
  • Figure 110: Europe Market Value (USD Million) by Offering, 2025-2035
  • Figure 111: Europe Market Value (USD Million) by Frequency Range, 2025-2035
  • Figure 112: Europe Market Value (USD Million) by Application, 2025-2035
  • Figure 113: Europe Market Value (USD Million) by End Use Industry, 2025-2035
  • Figure 114: Europe Market Value (USD Million) by Country, 2025-2035
  • Figure 115: Europe Market Value (USD Million) Analysis by Country, 2020-2035
  • Figure 116: Europe Market Volume (Units) Analysis by Country, 2020-2035
  • Figure 117: Europe Market Value Share (%) and BPS Analysis by Country, 2025-2035
  • Figure 118: Europe Market Y-o-Y Growth (%) Projections by Country, 2025-2035
  • Figure 119: Europe Market Value (USD Million) Analysis by Product Type, 2020-2035
  • Figure 120: Europe Market Volume (Units) Analysis by Product Type, 2020-2035
  • Figure 121: Europe Market Value Share (%) and BPS Analysis by Product Type, 2025-2035
  • Figure 122: Europe Market Y-o-Y Growth (%) Projections by Product Type, 2025-2035
  • Figure 123: Europe Market Value (USD Million) Analysis by Offering, 2020-2035
  • Figure 124: Europe Market Volume (Units) Analysis by Offering, 2020-2035
  • Figure 125: Europe Market Value Share (%) and BPS Analysis by Offering, 2025-2035
  • Figure 126: Europe Market Y-o-Y Growth (%) Projections by Offering, 2025-2035
  • Figure 127: Europe Market Value (USD Million) Analysis by Frequency Range, 2020-2035
  • Figure 128: Europe Market Volume (Units) Analysis by Frequency Range, 2020-2035
  • Figure 129: Europe Market Value Share (%) and BPS Analysis by Frequency Range, 2025-2035
  • Figure 130: Europe Market Y-o-Y Growth (%) Projections by Frequency Range, 2025-2035
  • Figure 131: Europe Market Value (USD Million) Analysis by Application, 2020-2035
  • Figure 132: Europe Market Volume (Units) Analysis by Application, 2020-2035
  • Figure 133: Europe Market Value Share (%) and BPS Analysis by Application, 2025-2035
  • Figure 134: Europe Market Y-o-Y Growth (%) Projections by Application, 2025-2035
  • Figure 135: Europe Market Value (USD Million) Analysis by End Use Industry, 2020-2035
  • Figure 136: Europe Market Volume (Units) Analysis by End Use Industry, 2020-2035
  • Figure 137: Europe Market Value Share (%) and BPS Analysis by End Use Industry, 2025-2035
  • Figure 138: Europe Market Y-o-Y Growth (%) Projections by End Use Industry, 2025-2035
  • Figure 139: Europe Market Attractiveness by Product Type, 2025-2035
  • Figure 140: Europe Market Attractiveness by Offering, 2025-2035
  • Figure 141: Europe Market Attractiveness by Frequency Range, 2025-2035
  • Figure 142: Europe Market Attractiveness by Application, 2025-2035
  • Figure 143: Europe Market Attractiveness by End Use Industry, 2025-2035
  • Figure 144: Europe Market Attractiveness by Country, 2025-2035
  • Figure 145: Asia Pacific Market Value (USD Million) by Product Type, 2025-2035
  • Figure 146: Asia Pacific Market Value (USD Million) by Offering, 2025-2035
  • Figure 147: Asia Pacific Market Value (USD Million) by Frequency Range, 2025-2035
  • Figure 148: Asia Pacific Market Value (USD Million) by Application, 2025-2035
  • Figure 149: Asia Pacific Market Value (USD Million) by End Use Industry, 2025-2035
  • Figure 150: Asia Pacific Market Value (USD Million) by Country, 2025-2035
  • Figure 151: Asia Pacific Market Value (USD Million) Analysis by Country, 2020-2035
  • Figure 152: Asia Pacific Market Volume (Units) Analysis by Country, 2020-2035
  • Figure 153: Asia Pacific Market Value Share (%) and BPS Analysis by Country, 2025-2035
  • Figure 154: Asia Pacific Market Y-o-Y Growth (%) Projections by Country, 2025-2035
  • Figure 155: Asia Pacific Market Value (USD Million) Analysis by Product Type, 2020-2035
  • Figure 156: Asia Pacific Market Volume (Units) Analysis by Product Type, 2020-2035
  • Figure 157: Asia Pacific Market Value Share (%) and BPS Analysis by Product Type, 2025-2035
  • Figure 158: Asia Pacific Market Y-o-Y Growth (%) Projections by Product Type, 2025-2035
  • Figure 159: Asia Pacific Market Value (USD Million) Analysis by Offering, 2020-2035
  • Figure 160: Asia Pacific Market Volume (Units) Analysis by Offering, 2020-2035
  • Figure 161: Asia Pacific Market Value Share (%) and BPS Analysis by Offering, 2025-2035
  • Figure 162: Asia Pacific Market Y-o-Y Growth (%) Projections by Offering, 2025-2035
  • Figure 163: Asia Pacific Market Value (USD Million) Analysis by Frequency Range, 2020-2035
  • Figure 164: Asia Pacific Market Volume (Units) Analysis by Frequency Range, 2020-2035
  • Figure 165: Asia Pacific Market Value Share (%) and BPS Analysis by Frequency Range, 2025-2035
  • Figure 166: Asia Pacific Market Y-o-Y Growth (%) Projections by Frequency Range, 2025-2035
  • Figure 167: Asia Pacific Market Value (USD Million) Analysis by Application, 2020-2035
  • Figure 168: Asia Pacific Market Volume (Units) Analysis by Application, 2020-2035
  • Figure 169: Asia Pacific Market Value Share (%) and BPS Analysis by Application, 2025-2035
  • Figure 170: Asia Pacific Market Y-o-Y Growth (%) Projections by Application, 2025-2035
  • Figure 171: Asia Pacific Market Value (USD Million) Analysis by End Use Industry, 2020-2035
  • Figure 172: Asia Pacific Market Volume (Units) Analysis by End Use Industry, 2020-2035
  • Figure 173: Asia Pacific Market Value Share (%) and BPS Analysis by End Use Industry, 2025-2035
  • Figure 174: Asia Pacific Market Y-o-Y Growth (%) Projections by End Use Industry, 2025-2035
  • Figure 175: Asia Pacific Market Attractiveness by Product Type, 2025-2035
  • Figure 176: Asia Pacific Market Attractiveness by Offering, 2025-2035
  • Figure 177: Asia Pacific Market Attractiveness by Frequency Range, 2025-2035
  • Figure 178: Asia Pacific Market Attractiveness by Application, 2025-2035
  • Figure 179: Asia Pacific Market Attractiveness by End Use Industry, 2025-2035
  • Figure 180: Asia Pacific Market Attractiveness by Country, 2025-2035
  • Figure 181: MEA Market Value (USD Million) by Product Type, 2025-2035
  • Figure 182: MEA Market Value (USD Million) by Offering, 2025-2035
  • Figure 183: MEA Market Value (USD Million) by Frequency Range, 2025-2035
  • Figure 184: MEA Market Value (USD Million) by Application, 2025-2035
  • Figure 185: MEA Market Value (USD Million) by End Use Industry, 2025-2035
  • Figure 186: MEA Market Value (USD Million) by Country, 2025-2035
  • Figure 187: MEA Market Value (USD Million) Analysis by Country, 2020-2035
  • Figure 188: MEA Market Volume (Units) Analysis by Country, 2020-2035
  • Figure 189: MEA Market Value Share (%) and BPS Analysis by Country, 2025-2035
  • Figure 190: MEA Market Y-o-Y Growth (%) Projections by Country, 2025-2035
  • Figure 191: MEA Market Value (USD Million) Analysis by Product Type, 2020-2035
  • Figure 192: MEA Market Volume (Units) Analysis by Product Type, 2020-2035
  • Figure 193: MEA Market Value Share (%) and BPS Analysis by Product Type, 2025-2035
  • Figure 194: MEA Market Y-o-Y Growth (%) Projections by Product Type, 2025-2035
  • Figure 195: MEA Market Value (USD Million) Analysis by Offering, 2020-2035
  • Figure 196: MEA Market Volume (Units) Analysis by Offering, 2020-2035
  • Figure 197: MEA Market Value Share (%) and BPS Analysis by Offering, 2025-2035
  • Figure 198: MEA Market Y-o-Y Growth (%) Projections by Offering, 2025-2035
  • Figure 199: MEA Market Value (USD Million) Analysis by Frequency Range, 2020-2035
  • Figure 200: MEA Market Volume (Units) Analysis by Frequency Range, 2020-2035
  • Figure 201: MEA Market Value Share (%) and BPS Analysis by Frequency Range, 2025-2035
  • Figure 202: MEA Market Y-o-Y Growth (%) Projections by Frequency Range, 2025-2035
  • Figure 203: MEA Market Value (USD Million) Analysis by Application, 2020-2035
  • Figure 204: MEA Market Volume (Units) Analysis by Application, 2020-2035
  • Figure 205: MEA Market Value Share (%) and BPS Analysis by Application, 2025-2035
  • Figure 206: MEA Market Y-o-Y Growth (%) Projections by Application, 2025-2035
  • Figure 207: MEA Market Value (USD Million) Analysis by End Use Industry, 2020-2035
  • Figure 208: MEA Market Volume (Units) Analysis by End Use Industry, 2020-2035
  • Figure 209: MEA Market Value Share (%) and BPS Analysis by End Use Industry, 2025-2035
  • Figure 210: MEA Market Y-o-Y Growth (%) Projections by End Use Industry, 2025-2035
  • Figure 211: MEA Market Attractiveness by Product Type, 2025-2035
  • Figure 212: MEA Market Attractiveness by Offering, 2025-2035
  • Figure 213: MEA Market Attractiveness by Frequency Range, 2025-2035
  • Figure 214: MEA Market Attractiveness by Application, 2025-2035
  • Figure 215: MEA Market Attractiveness by End Use Industry, 2025-2035
  • Figure 216: MEA Market Attractiveness by Country, 2025-2035

Frequently Asked Questions

What was the industry value in 2024?

The industry was valued at USD 1,844.5 Million in 2024

How big is the global 3D Laser Scanner market?

The industry is set to reach USD 1,988.4 Million in 2025

At what rate will the global industry value rise through 2035?

The industry value is anticipated to rise at 6.6% CAGR through 2035

What would be the global industry size by 2035?

The industry is anticipated to reach USD 4,214 Million by 2035

Which Country is the Dominant Shareholder in the 3D Laser Scanner Market?

Germany accounts for 17.2% of the global 3D Laser Scanner market revenue share alone.

Which Country has the Highest Growth Potential in the 3D Laser Scanner Market?

India is predicted to witness the highest CAGR of 5.5% in the 3D Laser Scanner market.

Explore Similar Insights

Future Market Insights

3D Laser Scanner Market