Reports

- Global Locations -

Headquarters

Future Market Insights, Inc.

Christiana Corporate, 200
Continental Drive, Suite 401,
Newark, Delaware - 19713,
United States

T: +1-845-579-5705

Americas

Future Market Insights, Inc.

616 Corporate Way, Suite 2-9018,
Valley Cottage, NY 10989, United States

T: +1-347-918-3531

MEA

Future Market Insights

1602-6 Jumeirah Bay X2 Tower, Plot No: JLT-PH2-X2A,
Jumeirah Lakes Towers, Dubai,
United Arab Emirates

Europe

Future Market Insights

3rd Floor, 207 Regent Street,
W1B 3HH London
United Kingdom

T: + 44 (0) 20 8123 9659
D: +44 (0) 20 3287 4268

Asia Pacific

Future Market Insights

IndiaLand Global Tech Park, Unit UG-1, Behind Grand HighStreet, Phase 1, Hinjawadi, MH, Pune – 411057, India

3D Cell Culture Market Outlook from (2023 to 2033)

The 3D cell culture market size is projected to be worth US$ 1.26 billion in 2023. The market is likely to reach US$ 3 billion by 2033. The market is further expected to surge at a CAGR of 9% during the forecast period 2023 to 2033.

Key Market Trends and Highlights

  • Increased adoption of high-content screening techniques for detailed analysis and improved drug development accuracy.
  • Collaborations between pharmaceutical giants and 3D cell culture technology providers to accelerate drug discovery.
  • Growing emphasis on immunology research, employing 3D cell cultures for disease modeling and immunotherapy development.
  • Integration of microfluidic systems for precise control and analysis within 3D cell culture environments.
  • Expanding applications in regenerative medicine, with 3D cell cultures enabling tissue engineering and organ transplantation advancements.
Attributes Key Insights
3D Cell Culture Market Estimated Size in 2023 US$ 1.26 billion
Projected Market Value in 2033 US$ 3 billion
Value-based CAGR from 2023 to 2033 9%

Don't pay for what you don't need

Customize your report by selecting specific countries or regions and save 30%!

2018 to 2022 Historical Analysis vs. 2023 to 2033 Forecast Projections

The scope for 3D Cell Culture rose at an 8.3% CAGR between 2018 and 2022. The global market for 3D Cell Culture is anticipated to grow at a moderate CAGR of 9% over the forecast period 2023 to 2033.

The period from 2018 to 2022 witnessed substantial growth in the 3D cell culture market. Several key factors contributed to this expansion. Rising drug development needs, driven by the need for more accurate in vitro testing, led to increased adoption of 3D cell culture systems. Advancements in technology, notably innovations in bioprinting and organ-on-a-chip technologies, propelled the market forward.

The expanding focus on cancer research played a significant role, with oncology studies relying heavily on 3D cell culture models to mimic complex tumor environments. The trend towards personalized medicine created a surge in demand for customized models, enabling tailored therapies for patients.

Environmental and ethical concerns also fueled the shift away from traditional animal testing methods, boosting the adoption of 3D cell cultures as a more ethical and accurate alternative. Academic-industry collaborations flourished during this period, fostering innovation and contributing to market expansion.

Looking ahead to 2023 to 2033, the 3D cell culture market is poised for even more impressive growth. The forecast indicates that personalized medicine will continue to be a significant driver, with an increasing emphasis on patient-specific models to revolutionize treatments.

Technological advancements will remain pivotal, with bioprinting and organ-on-a-chip technologies evolving further, enhancing the precision and efficiency of drug testing and disease modeling. Expanding research in fields beyond oncology, such as neurobiology and toxicology, will open new avenues for market growth.

Environmental and ethical concerns will persist as strong motivators, accelerating the shift away from animal testing methods. This ethical stance will be complemented by regulatory support for alternative testing methods, further boosting the market.

3D Cell Culture Market Key Drivers

  • Rising demand for precise in vitro testing speeds up drug discovery efforts.
  • Innovations in bioprinting and organ-on-a-chip technologies propel market growth.
  • Expanding cancer research intensifies the need for 3D cell culture systems.
  • Personalized medicine's focus fuels customized model adoption for patient-specific treatments.
  • Environmental and ethical concerns drive the shift from animal testing to 3D cell cultures.
Sabyasachi Ghosh
Sabyasachi Ghosh

Principal Consultant

Talk to Analyst

Find your sweet spots for generating winning opportunities in this market.

Challenges in the 3D Cell Culture Market

  • Creating and maintaining 3D cultures can be technically challenging due to their intricate structure.
  • 3D cell culture can be more expensive than traditional 2D methods.
  • Lack of standardized protocols hinders consistency in results and adoption.
  • Transitioning from lab-scale to industrial-scale 3D culture can be problematic.
  • Complex organoid and tissue models raise ethical questions, necessitating ethical guidelines and regulations.

Comparative View of Adjacent Markets

Future Market Insights has compared two other markets, namely anesthesia monitoring devices market and dehydration monitoring systems market below. This highlights that 3D cell culture industry is set to dominate out of these three markets over the forecast period 2023 to 2033.

3D Cell Culture Market:

CAGR from 2023 to 2033 9%
Market Value in 2033 US$ 3 billion
Key Trends
  • A prominent trend in the market is the increasing adoption of multi-organ-on-a-chip technology, allowing researchers to model the interactions between different organs for more comprehensive and accurate drug testing and disease studies.
Opportunity
  • A promising opportunity in the 3D cell culture market lies in revolutionizing drug screening. 3D models offer more accurate representation of human tissues, enhancing the efficiency and precision of drug testing, reducing costs, and expediting drug development.

Anesthesia Monitoring Devices Market:

CAGR from 2023 to 2033 12.0%
Market Value in 2033 US$ 5.6 billion
Key Trends
  • The growing need for improved mesh is driving the creation of innovative new products.
Opportunity
  • The emergence of innovative items such as biological mesh, coupled with the substantial growth prospects in emerging nations, is expected to drive captivating expansion within the market.

Dehydration Monitoring Systems Market:

CAGR from 2023 to 2033 7.3%
Market Value in 2033 US$ 1,083.1 million
Key Trends
  • The diverse array of dehydration monitoring systems available in various shapes and colors is anticipated to be the primary catalyst propelling the expansion of the dehydration monitoring systems market.
Opportunity
  • Dehydration monitoring systems find extensive uses in disease diagnosis, identifying drug abuse, and enhancing athletic performance, contributing to the rising demand for such systems.

Get the data you need at a Fraction of the cost

Personalize your report by choosing insights you need
and save 40%!

Country-wise Insights

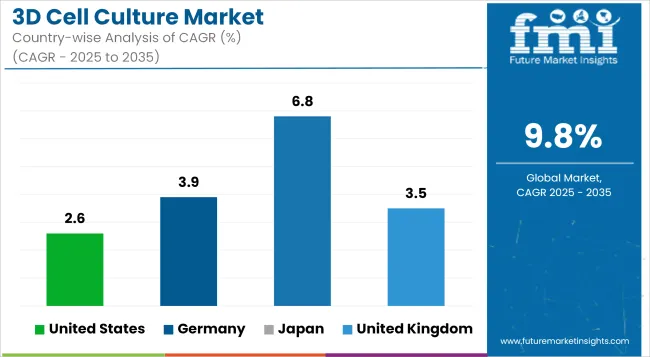
The below table showcases revenues in terms of the top 5 leading countries, spearheaded by the United States and China.

Forecast CAGRs from 2023 to 2033

The United States 8.9%
The United Kingdom 8.8%
China 8.7%
Japan 8.6%
South Korea 8.5%

Pioneering Precision- Trends in the United States 3D Cell Culture Market

In the United States, the 3D cell culture market is witnessing transformative trends. Personalized medicine drives research, with a focus on patient-specific models for precision treatments.

Organ-on-a-chip technology is booming, enabling the replication of human organ functions for drug testing and disease modeling while reducing animal testing. Bioprinting is advancing, with the potential to create complex tissues and even small organs.

High-throughput screening is accelerating drug discovery, and co-culture models are enhancing research in fields like cancer biology. Academic-industry collaborations foster innovation, while neuroscience models are gaining prominence. The United States remains at the forefront of these trends, shaping the global 3D cell culture landscape.

3D Cell Culture Innovation- Navigating the United Kingdom's Landscape

In the United Kingdom, the 3D cell culture market is experiencing a surge in opportunities driven by a fusion of innovation and increasing research demands. The emergence of cutting-edge biotechnology clusters and research hubs fosters collaboration between academia and industry.

Growing investments in regenerative medicine and personalized healthcare open avenues for tailored therapies. The rising focus on reducing animal testing fuels demand for advanced in vitro models like organoids and organ-on-a-chip technology.

As the United Kingdom solidifies its position as a biotech leader, opportunities in the 3D cell culture market continue to expand, offering a promising landscape for research and commercial ventures.

China's 3D Cell Culture Market - Pioneering a New Era in Biotechnology

The China 3D cell culture market is rapidly evolving, primarily driven by several key factors. The surging pharmaceutical and biotechnology sectors in China have intensified the demand for advanced in vitro models for drug discovery.

A growing emphasis on personalized medicine and precision therapies has fueled the adoption of 3D cell culture techniques, allowing researchers to develop treatments tailored to individual patients.

Government initiatives and funding to boost life sciences research further propel the market's growth. Increasing collaborations between Chinese and international research institutions contribute to knowledge sharing and technology transfer, enhancing the market's potential.

Sculpting Success - The 3D Cell Culture Renaissance in Japan

Japan presents a promising landscape for 3D cell culture. With a strong commitment to research and innovation, Japanese biotech and pharmaceutical industries are increasingly embracing advanced cell culture techniques. The aging population and rising healthcare demands create opportunities for personalized medicine and regenerative therapies, where 3D cell culture plays a pivotal role.

Collaborations between academia and industry drive knowledge exchange, further fueling growth. Government support and regulatory frameworks prioritize biotechnology, positioning Japan as a key player in the global 3D cell culture market. As the nation continues to invest in cutting-edge technology, the prospects for 3D cell culture in Japan are bright.

South Korea's Soaring Success- A Glimpse into the 3D Cell Culture Market

South Korea emerges as a formidable player in the 3D cell culture domain, exhibiting substantial promise. With a robust biotechnology sector, cutting-edge research infrastructure, and a focus on innovation, South Korean institutions and companies are driving advancements in 3D cell culture techniques.

Their contributions span personalized medicine, drug discovery, and regenerative therapies. Collaborations between academia and industry bolster this progress. As South Korea continues to invest in research and development, it positions itself as a key influencer in the global 3D cell culture landscape, offering solutions that may reshape the future of healthcare and biotechnology.

Category-wise Insights

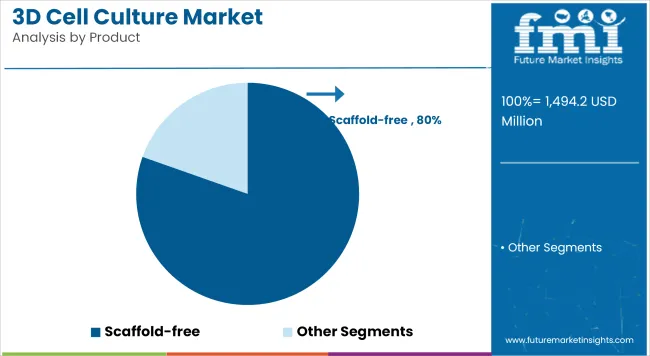
The below table highlights how scaffold-free 3D cell culture is projected to lead the market in terms of application, growing at 9.1% CAGR through 2033.

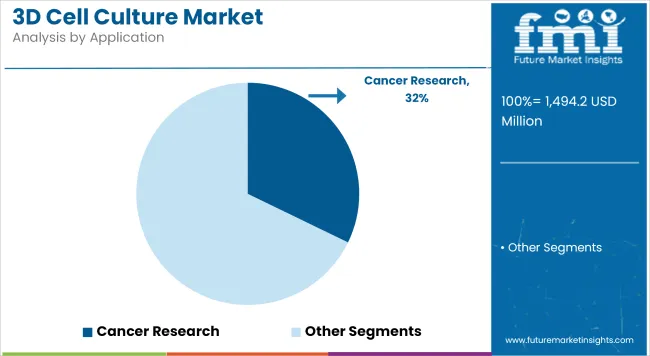
The cancer research segment is likely to spearhead sales based on application and is anticipated to witness a CAGR of 9.3% through 2033.

Category CAGR from 2023 to 2033
Scaffold-free 3D cell culture 9.1%
Cancer research 9.3%

Elevating Possibilities- The Scaffold-Free Revolution in 3D Cell Culture Dominates

Scaffold-free 3D cell culture reigns supreme in the market due to its versatility and physiological relevance. Offering a more accurate representation of in vivo conditions, it is ideal for diverse applications, including drug screening, tissue engineering, and disease modeling. Researchers favor its adaptability and potential for groundbreaking discoveries.

Unquestionable Reign - Cancer Research Takes Center Stage

Cancer research commands dominance in the 3D cell culture market due to its pressing global significance. 3D models accurately mimic tumor behavior, aiding drug development and personalized therapies.

The urgency to find effective cancer treatments ensures sustained growth and investment in this application segment.

Competitive Landscape

The competitive landscape of the 3D cell culture market is dynamic and highly competitive, characterized by a mix of established industry leaders and innovative startups. Key players like Thermo Fisher Scientific, Merck KGaA, and Corning Incorporated dominate with a broad product portfolio and extensive global reach.

Niche players like InSphero and SynVivo are gaining prominence with specialized solutions. Collaboration and partnerships between academic institutions and industry giants drive innovation. As the market expands, mergers and acquisitions are also common, consolidating expertise and resources. With increasing demand for personalized medicine and advanced drug discovery tools, the 3D cell culture market remains ripe for innovation and competition.

Recent Developments

  • In September 2023, Agilent Technologies Inc., recently inked an MOU with Singapore's Advanced Cell Therapy and Research Institute (ACTRIS) for three-year collaboration in advancing cell and gene therapy.
  • In August 2023, Kuraray Co., Ltd. is set to boost ethylene vinyl alcohol copolymer (EVOH resin) production capacity in the USA and Europe. In 2024, 5,000 tons/year will be added to both locations, with another 5,000 tons/year scheduled for 2026. This expansion will raise global capacity from 103,000 to 113,000 tons/year. As part of the PASSION 2026 medium-term management plan, a project team is exploring the establishment of a new base in Asia.

Report Scope

Attribute Details
Estimated Market Size in 2023 US$ 1.26 billion
Projected Market Valuation in 2033 US$ 3 billion
Value-based CAGR from 2023 to 2033 9%
Forecast Period 2023 to 2033
Historical Data Available for 2018 to 2022
Market Analysis Value in US$ billion
Key Regions Covered
  • North America
  • Latin America
  • Western Europe
  • Eastern Europe
  • South Asia and Pacific
  • East Asia
  • The Middle East & Africa
Key Market Segments Covered
  • Product
  • Application
  • End User
  • Region
Key Countries Profiled
  • The United States
  • Canada
  • Brazil
  • Mexico
  • Germany
  • The United Kingdom
  • France
  • Spain
  • Italy
  • Russia
  • Poland
  • Czech Republic
  • Romania
  • India
  • Bangladesh
  • Australia
  • New Zealand
  • China
  • Japan
  • South Korea
  • GCC countries
  • South Africa
  • Israel
Key Companies Profiled
  • 3D Biotek LLC
  • Advanced Biomatrix Inc.
  • Thermo Fisher Scientific Inc.
  • Kuraray Co. Ltd.
  • Lonza Group Ltd.
  • Corning Incorporated
  • Merck & Co. Inc.
  • BiomimX SRL
  • CN Bio Innovations
  • Hurel Corporation
  • InSphero AG
  • MIMETAS BV

Segmentation Analysis of the 3D Cell Culture Market

By Product:

  • Scaffold-free
  • Scaffold-based

By Application:

  • Drug Discovery
  • Tissue Regeneration & Regenerative Methods
  • Cancer Research
  • Stem Cell Technology
  • Others

By End User:

  • Biotechnology and Pharmaceutical Industries
  • Hospital Laboratories
  • Academic Research and Institutes
  • Contract Research Organizations

By Region:

  • North America
  • Latin America
  • Western Europe
  • Eastern Europe
  • South Asia & Pacific
  • East Asia
  • The Middle East & Africa

Frequently Asked Questions

What is the expected worth of the 3D Cell Culture Market in 2023?

The 3D cell culture market is expected to reach US$ 1.26 billion in 2023.

What is the expected CAGR for the 3D Cell Culture Market until 2033?

The market for 3D cell culture is set to expand by a CAGR of 9% by 2033.

How much valuation is projected for the 3D Cell Culture Market in 2033?

The 3D cell culture industry is forecast to reach US$ 3 billion by 2033.

Which country is likely to be at the pinnacle of the 3D Cell Culture Market?

The United States is likely to be the top performing market, with a CAGR of 8.9% in 2033.

Which is the leading application in the 3D Cell Culture domain?

Cancer research is preferred, expected to rise at a 9.3% CAGR through 2033.

Table of Content

1. Executive Summary

    1.1. Global Market Outlook

    1.2. Demand-side Trends

    1.3. Supply-side Trends

    1.4. Technology Roadmap Analysis

    1.5. Analysis and Recommendations

2. Market Overview

    2.1. Market Coverage / Taxonomy

    2.2. Market Definition / Scope / Limitations

3. Market Background

    3.1. Market Dynamics

        3.1.1. Drivers

        3.1.2. Restraints

        3.1.3. Opportunity

        3.1.4. Trends

    3.2. Scenario Forecast

        3.2.1. Demand in Optimistic Scenario

        3.2.2. Demand in Likely Scenario

        3.2.3. Demand in Conservative Scenario

    3.3. Opportunity Map Analysis

    3.4. Investment Feasibility Matrix

    3.5. PESTLE and Porter’s Analysis

    3.6. Regulatory Landscape

        3.6.1. By Key Regions

        3.6.2. By Key Countries

    3.7. Regional Parent Market Outlook

4. Global Market Analysis 2018 to 2022 and Forecast, 2023 to 2033

    4.1. Historical Market Size Value (US$ Million) Analysis, 2018 to 2022

    4.2. Current and Future Market Size Value (US$ Million) Projections, 2023 to 2033

        4.2.1. Y-o-Y Growth Trend Analysis

        4.2.2. Absolute $ Opportunity Analysis

5. Global Market Analysis 2018 to 2022 and Forecast 2023 to 2033, By Product

    5.1. Introduction / Key Findings

    5.2. Historical Market Size Value (US$ Million) Analysis By Product, 2018 to 2022

    5.3. Current and Future Market Size Value (US$ Million) Analysis and Forecast By Product, 2023 to 2033

        5.3.1. Scaffold-free

        5.3.2. Scaffold-based

    5.4. Y-o-Y Growth Trend Analysis By Product, 2018 to 2022

    5.5. Absolute $ Opportunity Analysis By Product, 2023 to 2033

6. Global Market Analysis 2018 to 2022 and Forecast 2023 to 2033, By Application

    6.1. Introduction / Key Findings

    6.2. Historical Market Size Value (US$ Million) Analysis By Application, 2018 to 2022

    6.3. Current and Future Market Size Value (US$ Million) Analysis and Forecast By Application, 2023 to 2033

        6.3.1. Drug Discovery

        6.3.2. Tissue Regeneration & Regenerative Methods

        6.3.3. Cancer Research

        6.3.4. Stem Cell Technology

        6.3.5. Others

    6.4. Y-o-Y Growth Trend Analysis By Application, 2018 to 2022

    6.5. Absolute $ Opportunity Analysis By Application, 2023 to 2033

7. Global Market Analysis 2018 to 2022 and Forecast 2023 to 2033, By End User 

    7.1. Introduction / Key Findings

    7.2. Historical Market Size Value (US$ Million) Analysis By End User, 2018 to 2022

    7.3. Current and Future Market Size Value (US$ Million) Analysis and Forecast By End User, 2023 to 2033

        7.3.1. Biotechnology and Pharmaceutical Industries

        7.3.2. Hospital Laboratories

        7.3.3. Academic Research and Institutes

        7.3.4. Contract Research Organizations

    7.4. Y-o-Y Growth Trend Analysis By End User, 2018 to 2022

    7.5. Absolute $ Opportunity Analysis By End User, 2023 to 2033

8. Global Market Analysis 2018 to 2022 and Forecast 2023 to 2033, By Region

    8.1. Introduction

    8.2. Historical Market Size Value (US$ Million) Analysis By Region, 2018 to 2022

    8.3. Current Market Size Value (US$ Million) Analysis and Forecast By Region, 2023 to 2033

        8.3.1. North America

        8.3.2. Latin America

        8.3.3. Western Europe

        8.3.4. Eastern Europe

        8.3.5. South Asia and Pacific

        8.3.6. East Asia

        8.3.7. Middle East and Africa

    8.4. Market Attractiveness Analysis By Region

9. North America Market Analysis 2018 to 2022 and Forecast 2023 to 2033, By Country

    9.1. Historical Market Size Value (US$ Million) Trend Analysis By Market Taxonomy, 2018 to 2022

    9.2. Market Size Value (US$ Million) Forecast By Market Taxonomy, 2023 to 2033

        9.2.1. By Country

            9.2.1.1. USA

            9.2.1.2. Canada

        9.2.2. By Product

        9.2.3. By Application

        9.2.4. By End User

    9.3. Market Attractiveness Analysis

        9.3.1. By Country

        9.3.2. By Product

        9.3.3. By Application

        9.3.4. By End User

    9.4. Key Takeaways

10. Latin America Market Analysis 2018 to 2022 and Forecast 2023 to 2033, By Country

    10.1. Historical Market Size Value (US$ Million) Trend Analysis By Market Taxonomy, 2018 to 2022

    10.2. Market Size Value (US$ Million) Forecast By Market Taxonomy, 2023 to 2033

        10.2.1. By Country

            10.2.1.1. Brazil

            10.2.1.2. Mexico

            10.2.1.3. Rest of Latin America

        10.2.2. By Product

        10.2.3. By Application

        10.2.4. By End User

    10.3. Market Attractiveness Analysis

        10.3.1. By Country

        10.3.2. By Product

        10.3.3. By Application

        10.3.4. By End User

    10.4. Key Takeaways

11. Western Europe Market Analysis 2018 to 2022 and Forecast 2023 to 2033, By Country

    11.1. Historical Market Size Value (US$ Million) Trend Analysis By Market Taxonomy, 2018 to 2022

    11.2. Market Size Value (US$ Million) Forecast By Market Taxonomy, 2023 to 2033

        11.2.1. By Country

            11.2.1.1. Germany

            11.2.1.2. UK

            11.2.1.3. France

            11.2.1.4. Spain

            11.2.1.5. Italy

            11.2.1.6. Rest of Western Europe

        11.2.2. By Product

        11.2.3. By Application

        11.2.4. By End User

    11.3. Market Attractiveness Analysis

        11.3.1. By Country

        11.3.2. By Product

        11.3.3. By Application

        11.3.4. By End User

    11.4. Key Takeaways

12. Eastern Europe Market Analysis 2018 to 2022 and Forecast 2023 to 2033, By Country

    12.1. Historical Market Size Value (US$ Million) Trend Analysis By Market Taxonomy, 2018 to 2022

    12.2. Market Size Value (US$ Million) Forecast By Market Taxonomy, 2023 to 2033

        12.2.1. By Country

            12.2.1.1. Poland

            12.2.1.2. Russia

            12.2.1.3. Czech Republic

            12.2.1.4. Romania

            12.2.1.5. Rest of Eastern Europe

        12.2.2. By Product

        12.2.3. By Application

        12.2.4. By End User

    12.3. Market Attractiveness Analysis

        12.3.1. By Country

        12.3.2. By Product

        12.3.3. By Application

        12.3.4. By End User

    12.4. Key Takeaways

13. South Asia and Pacific Market Analysis 2018 to 2022 and Forecast 2023 to 2033, By Country

    13.1. Historical Market Size Value (US$ Million) Trend Analysis By Market Taxonomy, 2018 to 2022

    13.2. Market Size Value (US$ Million) Forecast By Market Taxonomy, 2023 to 2033

        13.2.1. By Country

            13.2.1.1. India

            13.2.1.2. Bangladesh

            13.2.1.3. Australia

            13.2.1.4. New Zealand

            13.2.1.5. Rest of South Asia and Pacific

        13.2.2. By Product

        13.2.3. By Application

        13.2.4. By End User

    13.3. Market Attractiveness Analysis

        13.3.1. By Country

        13.3.2. By Product

        13.3.3. By Application

        13.3.4. By End User

    13.4. Key Takeaways

14. East Asia Market Analysis 2018 to 2022 and Forecast 2023 to 2033, By Country

    14.1. Historical Market Size Value (US$ Million) Trend Analysis By Market Taxonomy, 2018 to 2022

    14.2. Market Size Value (US$ Million) Forecast By Market Taxonomy, 2023 to 2033

        14.2.1. By Country

            14.2.1.1. China

            14.2.1.2. Japan

            14.2.1.3. South Korea

        14.2.2. By Product

        14.2.3. By Application

        14.2.4. By End User

    14.3. Market Attractiveness Analysis

        14.3.1. By Country

        14.3.2. By Product

        14.3.3. By Application

        14.3.4. By End User

    14.4. Key Takeaways

15. Middle East and Africa Market Analysis 2018 to 2022 and Forecast 2023 to 2033, By Country

    15.1. Historical Market Size Value (US$ Million) Trend Analysis By Market Taxonomy, 2018 to 2022

    15.2. Market Size Value (US$ Million) Forecast By Market Taxonomy, 2023 to 2033

        15.2.1. By Country

            15.2.1.1. GCC Countries

            15.2.1.2. South Africa

            15.2.1.3. Israel

            15.2.1.4. Rest of MEA

        15.2.2. By Product

        15.2.3. By Application

        15.2.4. By End User

    15.3. Market Attractiveness Analysis

        15.3.1. By Country

        15.3.2. By Product

        15.3.3. By Application

        15.3.4. By End User

    15.4. Key Takeaways

16. Key Countries Market Analysis

    16.1. USA

        16.1.1. Pricing Analysis

        16.1.2. Market Share Analysis, 2022

            16.1.2.1. By Product

            16.1.2.2. By Application

            16.1.2.3. By End User

    16.2. Canada

        16.2.1. Pricing Analysis

        16.2.2. Market Share Analysis, 2022

            16.2.2.1. By Product

            16.2.2.2. By Application

            16.2.2.3. By End User

    16.3. Brazil

        16.3.1. Pricing Analysis

        16.3.2. Market Share Analysis, 2022

            16.3.2.1. By Product

            16.3.2.2. By Application

            16.3.2.3. By End User

    16.4. Mexico

        16.4.1. Pricing Analysis

        16.4.2. Market Share Analysis, 2022

            16.4.2.1. By Product

            16.4.2.2. By Application

            16.4.2.3. By End User

    16.5. Germany

        16.5.1. Pricing Analysis

        16.5.2. Market Share Analysis, 2022

            16.5.2.1. By Product

            16.5.2.2. By Application

            16.5.2.3. By End User

    16.6. UK

        16.6.1. Pricing Analysis

        16.6.2. Market Share Analysis, 2022

            16.6.2.1. By Product

            16.6.2.2. By Application

            16.6.2.3. By End User

    16.7. France

        16.7.1. Pricing Analysis

        16.7.2. Market Share Analysis, 2022

            16.7.2.1. By Product

            16.7.2.2. By Application

            16.7.2.3. By End User

    16.8. Spain

        16.8.1. Pricing Analysis

        16.8.2. Market Share Analysis, 2022

            16.8.2.1. By Product

            16.8.2.2. By Application

            16.8.2.3. By End User

    16.9. Italy

        16.9.1. Pricing Analysis

        16.9.2. Market Share Analysis, 2022

            16.9.2.1. By Product

            16.9.2.2. By Application

            16.9.2.3. By End User

    16.10. Poland

        16.10.1. Pricing Analysis

        16.10.2. Market Share Analysis, 2022

            16.10.2.1. By Product

            16.10.2.2. By Application

            16.10.2.3. By End User

    16.11. Russia

        16.11.1. Pricing Analysis

        16.11.2. Market Share Analysis, 2022

            16.11.2.1. By Product

            16.11.2.2. By Application

            16.11.2.3. By End User

    16.12. Czech Republic

        16.12.1. Pricing Analysis

        16.12.2. Market Share Analysis, 2022

            16.12.2.1. By Product

            16.12.2.2. By Application

            16.12.2.3. By End User

    16.13. Romania

        16.13.1. Pricing Analysis

        16.13.2. Market Share Analysis, 2022

            16.13.2.1. By Product

            16.13.2.2. By Application

            16.13.2.3. By End User

    16.14. India

        16.14.1. Pricing Analysis

        16.14.2. Market Share Analysis, 2022

            16.14.2.1. By Product

            16.14.2.2. By Application

            16.14.2.3. By End User

    16.15. Bangladesh

        16.15.1. Pricing Analysis

        16.15.2. Market Share Analysis, 2022

            16.15.2.1. By Product

            16.15.2.2. By Application

            16.15.2.3. By End User

    16.16. Australia

        16.16.1. Pricing Analysis

        16.16.2. Market Share Analysis, 2022

            16.16.2.1. By Product

            16.16.2.2. By Application

            16.16.2.3. By End User

    16.17. New Zealand

        16.17.1. Pricing Analysis

        16.17.2. Market Share Analysis, 2022

            16.17.2.1. By Product

            16.17.2.2. By Application

            16.17.2.3. By End User

    16.18. China

        16.18.1. Pricing Analysis

        16.18.2. Market Share Analysis, 2022

            16.18.2.1. By Product

            16.18.2.2. By Application

            16.18.2.3. By End User

    16.19. Japan

        16.19.1. Pricing Analysis

        16.19.2. Market Share Analysis, 2022

            16.19.2.1. By Product

            16.19.2.2. By Application

            16.19.2.3. By End User

    16.20. South Korea

        16.20.1. Pricing Analysis

        16.20.2. Market Share Analysis, 2022

            16.20.2.1. By Product

            16.20.2.2. By Application

            16.20.2.3. By End User

    16.21. GCC Countries

        16.21.1. Pricing Analysis

        16.21.2. Market Share Analysis, 2022

            16.21.2.1. By Product

            16.21.2.2. By Application

            16.21.2.3. By End User

    16.22. South Africa

        16.22.1. Pricing Analysis

        16.22.2. Market Share Analysis, 2022

            16.22.2.1. By Product

            16.22.2.2. By Application

            16.22.2.3. By End User

    16.23. Israel

        16.23.1. Pricing Analysis

        16.23.2. Market Share Analysis, 2022

            16.23.2.1. By Product

            16.23.2.2. By Application

            16.23.2.3. By End User

17. Market Structure Analysis

    17.1. Competition Dashboard

    17.2. Competition Benchmarking

    17.3. Market Share Analysis of Top Players

        17.3.1. By Regional

        17.3.2. By Product

        17.3.3. By Application

        17.3.4. By End User

18. Competition Analysis

    18.1. Competition Deep Dive

        18.1.1. 3D Biotek LLC

            18.1.1.1. Overview

            18.1.1.2. Product Portfolio

            18.1.1.3. Profitability by Market Segments

            18.1.1.4. Sales Footprint

            18.1.1.5. Strategy Overview

                18.1.1.5.1. Marketing Strategy

        18.1.2. Advanced Biomatrix Inc.

            18.1.2.1. Overview

            18.1.2.2. Product Portfolio

            18.1.2.3. Profitability by Market Segments

            18.1.2.4. Sales Footprint

            18.1.2.5. Strategy Overview

                18.1.2.5.1. Marketing Strategy

        18.1.3. Thermo Fisher Scientific Inc.

            18.1.3.1. Overview

            18.1.3.2. Product Portfolio

            18.1.3.3. Profitability by Market Segments

            18.1.3.4. Sales Footprint

            18.1.3.5. Strategy Overview

                18.1.3.5.1. Marketing Strategy

        18.1.4. Kuraray Co. Ltd.

            18.1.4.1. Overview

            18.1.4.2. Product Portfolio

            18.1.4.3. Profitability by Market Segments

            18.1.4.4. Sales Footprint

            18.1.4.5. Strategy Overview

                18.1.4.5.1. Marketing Strategy

        18.1.5. Lonza Group Ltd.

            18.1.5.1. Overview

            18.1.5.2. Product Portfolio

            18.1.5.3. Profitability by Market Segments

            18.1.5.4. Sales Footprint

            18.1.5.5. Strategy Overview

                18.1.5.5.1. Marketing Strategy

        18.1.6. Corning Incorporated

            18.1.6.1. Overview

            18.1.6.2. Product Portfolio

            18.1.6.3. Profitability by Market Segments

            18.1.6.4. Sales Footprint

            18.1.6.5. Strategy Overview

                18.1.6.5.1. Marketing Strategy

        18.1.7. Merck & Co. Inc.

            18.1.7.1. Overview

            18.1.7.2. Product Portfolio

            18.1.7.3. Profitability by Market Segments

            18.1.7.4. Sales Footprint

            18.1.7.5. Strategy Overview

                18.1.7.5.1. Marketing Strategy

        18.1.8. BiomimX SRL

            18.1.8.1. Overview

            18.1.8.2. Product Portfolio

            18.1.8.3. Profitability by Market Segments

            18.1.8.4. Sales Footprint

            18.1.8.5. Strategy Overview

                18.1.8.5.1. Marketing Strategy

        18.1.9. CN Bio Innovations

            18.1.9.1. Overview

            18.1.9.2. Product Portfolio

            18.1.9.3. Profitability by Market Segments

            18.1.9.4. Sales Footprint

            18.1.9.5. Strategy Overview

                18.1.9.5.1. Marketing Strategy

        18.1.10. Hurel Corporation

            18.1.10.1. Overview

            18.1.10.2. Product Portfolio

            18.1.10.3. Profitability by Market Segments

            18.1.10.4. Sales Footprint

            18.1.10.5. Strategy Overview

                18.1.10.5.1. Marketing Strategy

        18.1.11. InSphero AG

            18.1.11.1. Overview

            18.1.11.2. Product Portfolio

            18.1.11.3. Profitability by Market Segments

            18.1.11.4. Sales Footprint

            18.1.11.5. Strategy Overview

                18.1.11.5.1. Marketing Strategy

        18.1.12. MIMETAS BV

            18.1.12.1. Overview

            18.1.12.2. Product Portfolio

            18.1.12.3. Profitability by Market Segments

            18.1.12.4. Sales Footprint

            18.1.12.5. Strategy Overview

                18.1.12.5.1. Marketing Strategy

19. Assumptions & Acronyms Used

20. Research Methodology

Don't pay for what you don't need

Customize your report by selecting specific countries or regions and save 30%!

List of Tables

Table 1: Global Market Value (US$ Million) Forecast by Region, 2018 to 2033

Table 2: Global Market Value (US$ Million) Forecast by Product, 2018 to 2033

Table 3: Global Market Value (US$ Million) Forecast by Application, 2018 to 2033

Table 4: Global Market Value (US$ Million) Forecast by End User, 2018 to 2033

Table 5: North America Market Value (US$ Million) Forecast by Country, 2018 to 2033

Table 6: North America Market Value (US$ Million) Forecast by Product, 2018 to 2033

Table 7: North America Market Value (US$ Million) Forecast by Application, 2018 to 2033

Table 8: North America Market Value (US$ Million) Forecast by End User, 2018 to 2033

Table 9: Latin America Market Value (US$ Million) Forecast by Country, 2018 to 2033

Table 10: Latin America Market Value (US$ Million) Forecast by Product, 2018 to 2033

Table 11: Latin America Market Value (US$ Million) Forecast by Application, 2018 to 2033

Table 12: Latin America Market Value (US$ Million) Forecast by End User, 2018 to 2033

Table 13: Western Europe Market Value (US$ Million) Forecast by Country, 2018 to 2033

Table 14: Western Europe Market Value (US$ Million) Forecast by Product, 2018 to 2033

Table 15: Western Europe Market Value (US$ Million) Forecast by Application, 2018 to 2033

Table 16: Western Europe Market Value (US$ Million) Forecast by End User, 2018 to 2033

Table 17: Eastern Europe Market Value (US$ Million) Forecast by Country, 2018 to 2033

Table 18: Eastern Europe Market Value (US$ Million) Forecast by Product, 2018 to 2033

Table 19: Eastern Europe Market Value (US$ Million) Forecast by Application, 2018 to 2033

Table 20: Eastern Europe Market Value (US$ Million) Forecast by End User, 2018 to 2033

Table 21: South Asia and Pacific Market Value (US$ Million) Forecast by Country, 2018 to 2033

Table 22: South Asia and Pacific Market Value (US$ Million) Forecast by Product, 2018 to 2033

Table 23: South Asia and Pacific Market Value (US$ Million) Forecast by Application, 2018 to 2033

Table 24: South Asia and Pacific Market Value (US$ Million) Forecast by End User, 2018 to 2033

Table 25: East Asia Market Value (US$ Million) Forecast by Country, 2018 to 2033

Table 26: East Asia Market Value (US$ Million) Forecast by Product, 2018 to 2033

Table 27: East Asia Market Value (US$ Million) Forecast by Application, 2018 to 2033

Table 28: East Asia Market Value (US$ Million) Forecast by End User, 2018 to 2033

Table 29: Middle East and Africa Market Value (US$ Million) Forecast by Country, 2018 to 2033

Table 30: Middle East and Africa Market Value (US$ Million) Forecast by Product, 2018 to 2033

Table 31: Middle East and Africa Market Value (US$ Million) Forecast by Application, 2018 to 2033

Table 32: Middle East and Africa Market Value (US$ Million) Forecast by End User, 2018 to 2033
Sabyasachi Ghosh
Sabyasachi Ghosh

Principal Consultant

Talk to Analyst

Find your sweet spots for generating winning opportunities in this market.

List of Charts

Figure 1: Global Market Value (US$ Million) by Product, 2023 to 2033

Figure 2: Global Market Value (US$ Million) by Application, 2023 to 2033

Figure 3: Global Market Value (US$ Million) by End User, 2023 to 2033

Figure 4: Global Market Value (US$ Million) by Region, 2023 to 2033

Figure 5: Global Market Value (US$ Million) Analysis by Region, 2018 to 2033

Figure 6: Global Market Value Share (%) and BPS Analysis by Region, 2023 to 2033

Figure 7: Global Market Y-o-Y Growth (%) Projections by Region, 2023 to 2033

Figure 8: Global Market Value (US$ Million) Analysis by Product, 2018 to 2033

Figure 9: Global Market Value Share (%) and BPS Analysis by Product, 2023 to 2033

Figure 10: Global Market Y-o-Y Growth (%) Projections by Product, 2023 to 2033

Figure 11: Global Market Value (US$ Million) Analysis by Application, 2018 to 2033

Figure 12: Global Market Value Share (%) and BPS Analysis by Application, 2023 to 2033

Figure 13: Global Market Y-o-Y Growth (%) Projections by Application, 2023 to 2033

Figure 14: Global Market Value (US$ Million) Analysis by End User, 2018 to 2033

Figure 15: Global Market Value Share (%) and BPS Analysis by End User, 2023 to 2033

Figure 16: Global Market Y-o-Y Growth (%) Projections by End User, 2023 to 2033

Figure 17: Global Market Attractiveness by Product, 2023 to 2033

Figure 18: Global Market Attractiveness by Application, 2023 to 2033

Figure 19: Global Market Attractiveness by End User, 2023 to 2033

Figure 20: Global Market Attractiveness by Region, 2023 to 2033

Figure 21: North America Market Value (US$ Million) by Product, 2023 to 2033

Figure 22: North America Market Value (US$ Million) by Application, 2023 to 2033

Figure 23: North America Market Value (US$ Million) by End User, 2023 to 2033

Figure 24: North America Market Value (US$ Million) by Country, 2023 to 2033

Figure 25: North America Market Value (US$ Million) Analysis by Country, 2018 to 2033

Figure 26: North America Market Value Share (%) and BPS Analysis by Country, 2023 to 2033

Figure 27: North America Market Y-o-Y Growth (%) Projections by Country, 2023 to 2033

Figure 28: North America Market Value (US$ Million) Analysis by Product, 2018 to 2033

Figure 29: North America Market Value Share (%) and BPS Analysis by Product, 2023 to 2033

Figure 30: North America Market Y-o-Y Growth (%) Projections by Product, 2023 to 2033

Figure 31: North America Market Value (US$ Million) Analysis by Application, 2018 to 2033

Figure 32: North America Market Value Share (%) and BPS Analysis by Application, 2023 to 2033

Figure 33: North America Market Y-o-Y Growth (%) Projections by Application, 2023 to 2033

Figure 34: North America Market Value (US$ Million) Analysis by End User, 2018 to 2033

Figure 35: North America Market Value Share (%) and BPS Analysis by End User, 2023 to 2033

Figure 36: North America Market Y-o-Y Growth (%) Projections by End User, 2023 to 2033

Figure 37: North America Market Attractiveness by Product, 2023 to 2033

Figure 38: North America Market Attractiveness by Application, 2023 to 2033

Figure 39: North America Market Attractiveness by End User, 2023 to 2033

Figure 40: North America Market Attractiveness by Country, 2023 to 2033

Figure 41: Latin America Market Value (US$ Million) by Product, 2023 to 2033

Figure 42: Latin America Market Value (US$ Million) by Application, 2023 to 2033

Figure 43: Latin America Market Value (US$ Million) by End User, 2023 to 2033

Figure 44: Latin America Market Value (US$ Million) by Country, 2023 to 2033

Figure 45: Latin America Market Value (US$ Million) Analysis by Country, 2018 to 2033

Figure 46: Latin America Market Value Share (%) and BPS Analysis by Country, 2023 to 2033

Figure 47: Latin America Market Y-o-Y Growth (%) Projections by Country, 2023 to 2033

Figure 48: Latin America Market Value (US$ Million) Analysis by Product, 2018 to 2033

Figure 49: Latin America Market Value Share (%) and BPS Analysis by Product, 2023 to 2033

Figure 50: Latin America Market Y-o-Y Growth (%) Projections by Product, 2023 to 2033

Figure 51: Latin America Market Value (US$ Million) Analysis by Application, 2018 to 2033

Figure 52: Latin America Market Value Share (%) and BPS Analysis by Application, 2023 to 2033

Figure 53: Latin America Market Y-o-Y Growth (%) Projections by Application, 2023 to 2033

Figure 54: Latin America Market Value (US$ Million) Analysis by End User, 2018 to 2033

Figure 55: Latin America Market Value Share (%) and BPS Analysis by End User, 2023 to 2033

Figure 56: Latin America Market Y-o-Y Growth (%) Projections by End User, 2023 to 2033

Figure 57: Latin America Market Attractiveness by Product, 2023 to 2033

Figure 58: Latin America Market Attractiveness by Application, 2023 to 2033

Figure 59: Latin America Market Attractiveness by End User, 2023 to 2033

Figure 60: Latin America Market Attractiveness by Country, 2023 to 2033

Figure 61: Western Europe Market Value (US$ Million) by Product, 2023 to 2033

Figure 62: Western Europe Market Value (US$ Million) by Application, 2023 to 2033

Figure 63: Western Europe Market Value (US$ Million) by End User, 2023 to 2033

Figure 64: Western Europe Market Value (US$ Million) by Country, 2023 to 2033

Figure 65: Western Europe Market Value (US$ Million) Analysis by Country, 2018 to 2033

Figure 66: Western Europe Market Value Share (%) and BPS Analysis by Country, 2023 to 2033

Figure 67: Western Europe Market Y-o-Y Growth (%) Projections by Country, 2023 to 2033

Figure 68: Western Europe Market Value (US$ Million) Analysis by Product, 2018 to 2033

Figure 69: Western Europe Market Value Share (%) and BPS Analysis by Product, 2023 to 2033

Figure 70: Western Europe Market Y-o-Y Growth (%) Projections by Product, 2023 to 2033

Figure 71: Western Europe Market Value (US$ Million) Analysis by Application, 2018 to 2033

Figure 72: Western Europe Market Value Share (%) and BPS Analysis by Application, 2023 to 2033

Figure 73: Western Europe Market Y-o-Y Growth (%) Projections by Application, 2023 to 2033

Figure 74: Western Europe Market Value (US$ Million) Analysis by End User, 2018 to 2033

Figure 75: Western Europe Market Value Share (%) and BPS Analysis by End User, 2023 to 2033

Figure 76: Western Europe Market Y-o-Y Growth (%) Projections by End User, 2023 to 2033

Figure 77: Western Europe Market Attractiveness by Product, 2023 to 2033

Figure 78: Western Europe Market Attractiveness by Application, 2023 to 2033

Figure 79: Western Europe Market Attractiveness by End User, 2023 to 2033

Figure 80: Western Europe Market Attractiveness by Country, 2023 to 2033

Figure 81: Eastern Europe Market Value (US$ Million) by Product, 2023 to 2033

Figure 82: Eastern Europe Market Value (US$ Million) by Application, 2023 to 2033

Figure 83: Eastern Europe Market Value (US$ Million) by End User, 2023 to 2033

Figure 84: Eastern Europe Market Value (US$ Million) by Country, 2023 to 2033

Figure 85: Eastern Europe Market Value (US$ Million) Analysis by Country, 2018 to 2033

Figure 86: Eastern Europe Market Value Share (%) and BPS Analysis by Country, 2023 to 2033

Figure 87: Eastern Europe Market Y-o-Y Growth (%) Projections by Country, 2023 to 2033

Figure 88: Eastern Europe Market Value (US$ Million) Analysis by Product, 2018 to 2033

Figure 89: Eastern Europe Market Value Share (%) and BPS Analysis by Product, 2023 to 2033

Figure 90: Eastern Europe Market Y-o-Y Growth (%) Projections by Product, 2023 to 2033

Figure 91: Eastern Europe Market Value (US$ Million) Analysis by Application, 2018 to 2033

Figure 92: Eastern Europe Market Value Share (%) and BPS Analysis by Application, 2023 to 2033

Figure 93: Eastern Europe Market Y-o-Y Growth (%) Projections by Application, 2023 to 2033

Figure 94: Eastern Europe Market Value (US$ Million) Analysis by End User, 2018 to 2033

Figure 95: Eastern Europe Market Value Share (%) and BPS Analysis by End User, 2023 to 2033

Figure 96: Eastern Europe Market Y-o-Y Growth (%) Projections by End User, 2023 to 2033

Figure 97: Eastern Europe Market Attractiveness by Product, 2023 to 2033

Figure 98: Eastern Europe Market Attractiveness by Application, 2023 to 2033

Figure 99: Eastern Europe Market Attractiveness by End User, 2023 to 2033

Figure 100: Eastern Europe Market Attractiveness by Country, 2023 to 2033

Figure 101: South Asia and Pacific Market Value (US$ Million) by Product, 2023 to 2033

Figure 102: South Asia and Pacific Market Value (US$ Million) by Application, 2023 to 2033

Figure 103: South Asia and Pacific Market Value (US$ Million) by End User, 2023 to 2033

Figure 104: South Asia and Pacific Market Value (US$ Million) by Country, 2023 to 2033

Figure 105: South Asia and Pacific Market Value (US$ Million) Analysis by Country, 2018 to 2033

Figure 106: South Asia and Pacific Market Value Share (%) and BPS Analysis by Country, 2023 to 2033

Figure 107: South Asia and Pacific Market Y-o-Y Growth (%) Projections by Country, 2023 to 2033

Figure 108: South Asia and Pacific Market Value (US$ Million) Analysis by Product, 2018 to 2033

Figure 109: South Asia and Pacific Market Value Share (%) and BPS Analysis by Product, 2023 to 2033

Figure 110: South Asia and Pacific Market Y-o-Y Growth (%) Projections by Product, 2023 to 2033

Figure 111: South Asia and Pacific Market Value (US$ Million) Analysis by Application, 2018 to 2033

Figure 112: South Asia and Pacific Market Value Share (%) and BPS Analysis by Application, 2023 to 2033

Figure 113: South Asia and Pacific Market Y-o-Y Growth (%) Projections by Application, 2023 to 2033

Figure 114: South Asia and Pacific Market Value (US$ Million) Analysis by End User, 2018 to 2033

Figure 115: South Asia and Pacific Market Value Share (%) and BPS Analysis by End User, 2023 to 2033

Figure 116: South Asia and Pacific Market Y-o-Y Growth (%) Projections by End User, 2023 to 2033

Figure 117: South Asia and Pacific Market Attractiveness by Product, 2023 to 2033

Figure 118: South Asia and Pacific Market Attractiveness by Application, 2023 to 2033

Figure 119: South Asia and Pacific Market Attractiveness by End User, 2023 to 2033

Figure 120: South Asia and Pacific Market Attractiveness by Country, 2023 to 2033

Figure 121: East Asia Market Value (US$ Million) by Product, 2023 to 2033

Figure 122: East Asia Market Value (US$ Million) by Application, 2023 to 2033

Figure 123: East Asia Market Value (US$ Million) by End User, 2023 to 2033

Figure 124: East Asia Market Value (US$ Million) by Country, 2023 to 2033

Figure 125: East Asia Market Value (US$ Million) Analysis by Country, 2018 to 2033

Figure 126: East Asia Market Value Share (%) and BPS Analysis by Country, 2023 to 2033

Figure 127: East Asia Market Y-o-Y Growth (%) Projections by Country, 2023 to 2033

Figure 128: East Asia Market Value (US$ Million) Analysis by Product, 2018 to 2033

Figure 129: East Asia Market Value Share (%) and BPS Analysis by Product, 2023 to 2033

Figure 130: East Asia Market Y-o-Y Growth (%) Projections by Product, 2023 to 2033

Figure 131: East Asia Market Value (US$ Million) Analysis by Application, 2018 to 2033

Figure 132: East Asia Market Value Share (%) and BPS Analysis by Application, 2023 to 2033

Figure 133: East Asia Market Y-o-Y Growth (%) Projections by Application, 2023 to 2033

Figure 134: East Asia Market Value (US$ Million) Analysis by End User, 2018 to 2033

Figure 135: East Asia Market Value Share (%) and BPS Analysis by End User, 2023 to 2033

Figure 136: East Asia Market Y-o-Y Growth (%) Projections by End User, 2023 to 2033

Figure 137: East Asia Market Attractiveness by Product, 2023 to 2033

Figure 138: East Asia Market Attractiveness by Application, 2023 to 2033

Figure 139: East Asia Market Attractiveness by End User, 2023 to 2033

Figure 140: East Asia Market Attractiveness by Country, 2023 to 2033

Figure 141: Middle East and Africa Market Value (US$ Million) by Product, 2023 to 2033

Figure 142: Middle East and Africa Market Value (US$ Million) by Application, 2023 to 2033

Figure 143: Middle East and Africa Market Value (US$ Million) by End User, 2023 to 2033

Figure 144: Middle East and Africa Market Value (US$ Million) by Country, 2023 to 2033

Figure 145: Middle East and Africa Market Value (US$ Million) Analysis by Country, 2018 to 2033

Figure 146: Middle East and Africa Market Value Share (%) and BPS Analysis by Country, 2023 to 2033

Figure 147: Middle East and Africa Market Y-o-Y Growth (%) Projections by Country, 2023 to 2033

Figure 148: Middle East and Africa Market Value (US$ Million) Analysis by Product, 2018 to 2033

Figure 149: Middle East and Africa Market Value Share (%) and BPS Analysis by Product, 2023 to 2033

Figure 150: Middle East and Africa Market Y-o-Y Growth (%) Projections by Product, 2023 to 2033

Figure 151: Middle East and Africa Market Value (US$ Million) Analysis by Application, 2018 to 2033

Figure 152: Middle East and Africa Market Value Share (%) and BPS Analysis by Application, 2023 to 2033

Figure 153: Middle East and Africa Market Y-o-Y Growth (%) Projections by Application, 2023 to 2033

Figure 154: Middle East and Africa Market Value (US$ Million) Analysis by End User, 2018 to 2033

Figure 155: Middle East and Africa Market Value Share (%) and BPS Analysis by End User, 2023 to 2033

Figure 156: Middle East and Africa Market Y-o-Y Growth (%) Projections by End User, 2023 to 2033

Figure 157: Middle East and Africa Market Attractiveness by Product, 2023 to 2033

Figure 158: Middle East and Africa Market Attractiveness by Application, 2023 to 2033

Figure 159: Middle East and Africa Market Attractiveness by End User, 2023 to 2033

Figure 160: Middle East and Africa Market Attractiveness by Country, 2023 to 2033

Recommendations

Healthcare

Cell Culture Media Market

Published : January 2024

Healthcare

Cell Culture Incubator Market

Published : July 2023

Healthcare

Cell Culture Market

Published : January 2023

Explore Healthcare Insights

View Reports