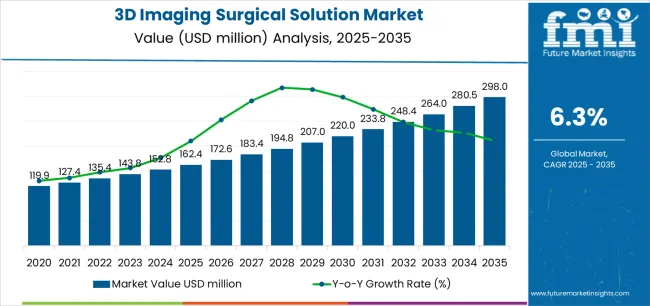
The global 3D imaging surgical solution market is valued at USD 162.4 million in 2025. It is slated to reach USD 299.2 million by 2035, recording an absolute increase of USD 135.6 million over the forecast period. This translates into a total growth of 83.5%, with the market forecast to expand at a CAGR of 6.3% between 2025 and 2035. The market size is expected to grow by nearly 1.84X during the same period, supported by increasing demand for minimally invasive surgical procedures, growing adoption of advanced visualization technologies in operating rooms, and rising emphasis on surgical precision and patient safety across diverse hospital, specialty clinic, and ambulatory surgical center applications.
Between 2025 and 2030, the 3D imaging surgical solution market is projected to expand from USD 162.4 million to USD 220.0 million, resulting in a value increase of USD 57.6 million, which represents 42.5% of the total forecast growth for the decade. This phase of development will be shaped by increasing surgical procedure volumes and demand for enhanced visualization, rising adoption of robotic-assisted surgery platforms requiring advanced imaging integration, and growing investment in operating room modernization programs across healthcare facilities. Hospital administrators and surgical departments are expanding their 3D imaging capabilities to address the growing demand for precision surgical solutions that ensure improved clinical outcomes and operational efficiency while enhancing surgeon performance.
Equipment integration challenges emerge when 3D imaging systems must coordinate with existing surgical infrastructure while maintaining sterility protocols and electromagnetic compatibility requirements within operating theater environments. Installation complexity increases when facilities must accommodate bulky imaging equipment alongside traditional surgical instruments while preserving surgical team workflow patterns established over decades. Engineering coordination becomes complicated when power requirements for high-resolution imaging processors exceed existing electrical infrastructure capabilities within older medical facilities.
Maintenance scheduling creates operational difficulties when imaging system calibration requires specialized technicians while surgical schedules cannot accommodate extended downtime periods for preventive service activities. Service coordination becomes challenging when equipment manufacturers provide limited after-hours support while emergency surgical procedures require immediate system availability. Vendor management creates ongoing tensions when software updates potentially disrupt established workflows while failing to update systems creates security vulnerabilities and compliance risks.
Regulatory compliance coordination creates administrative burdens when FDA and international medical device regulations require extensive validation documentation while technology advancement cycles exceed regulatory approval timelines. Clinical evidence gathering becomes challenging when demonstrating improved patient outcomes requires long-term studies while competitive pressures demand immediate technology adoption to maintain surgical program rankings within this rapidly evolving medical technology market.
| Metric | Value |
|---|---|
| Estimated Value in (2025E) | USD 162.4 million |
| Forecast Value in (2035F) | USD 299.2 million |
| Forecast CAGR (2025 to 2035) | 6.3% |
From 2030 to 2035, the market is forecast to grow from USD 220.0 million to USD 299.2 million, adding another USD 78.0 million, which constitutes 57.5% of the ten-year expansion. This period is expected to be characterized by the expansion of artificial intelligence integration and augmented reality surgical navigation systems, the development of portable 3D imaging solutions and point-of-care surgical visualization technologies, and the growth of specialized applications for neurosurgery, cardiovascular procedures, and orthopedic interventions. The growing adoption of value-based healthcare models and surgical outcome optimization strategies will drive demand for 3D imaging surgical solutions with enhanced visualization capabilities and clinical decision support features.
Between 2020 and 2025, the 3D imaging surgical solution market experienced steady growth, driven by increasing minimally invasive surgical adoption and growing recognition of advanced visualization technologies as essential tools for enhancing surgical precision and patient outcomes across diverse surgical specialties and healthcare settings. The market developed as surgeons and hospital administrators recognized the potential for 3D imaging technology to improve depth perception, enhance anatomical visualization, and support complex surgical procedures while meeting stringent safety and quality requirements. Technological advancement in stereoscopic imaging and real-time rendering began emphasizing the critical importance of maintaining image quality and visualization accuracy in challenging surgical environments.
Market expansion is being supported by the increasing global demand for minimally invasive surgical procedures driven by patient preference for faster recovery and reduced complications, alongside the corresponding need for advanced visualization technologies that can enhance surgical precision, enable complex procedure execution, and maintain optimal clinical outcomes across various neurosurgical, cardiovascular, orthopedic, and general surgical applications. Modern surgeons and healthcare facilities are increasingly focused on implementing 3D imaging solutions that can improve depth perception, enhance anatomical visualization, and provide real-time guidance in demanding surgical conditions.
The growing emphasis on surgical safety and quality outcomes is driving demand for 3D imaging systems that can support error reduction, enable better surgical planning, and ensure comprehensive procedural excellence. Healthcare providers' preference for visualization technologies that combine clinical effectiveness with workflow integration and surgeon acceptance is creating opportunities for innovative 3D imaging implementations. The rising influence of robotic surgery adoption and hybrid operating room development is also contributing to increased adoption of 3D imaging solutions that can provide superior visualization performance without compromising surgical workflow or operational efficiency.
The market is segmented by technology type, imaging solutions, end user, and region. By technology type, the market is divided into stereoscopy, auto-stereoscopy, volumetric display, holography, and anaglyphy. Based on imaging solutions, the market is categorized into 3D rendering, layout and animation, image reconstruction, 3D modelling, and 3D scanning. By end user, the market includes hospitals, specialty clinics, and ambulatory surgical centers. Regionally, the market is divided into East Asia, Europe, North America, South Asia, Latin America, Middle East & Africa, and Eastern Europe.
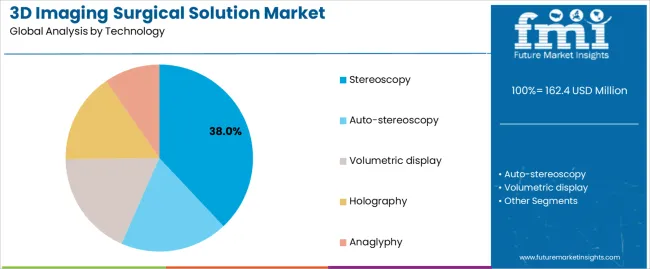
The stereoscopy segment is projected to maintain its leading position in the 3D imaging surgical solution market in 2025 with a 38.0% market share, reaffirming its role as the preferred technology category for surgical visualization and minimally invasive procedure applications. Surgeons and medical device manufacturers increasingly utilize stereoscopic imaging for its superior depth perception capabilities, excellent anatomical detail visualization, and proven effectiveness in supporting complex surgical procedures while maintaining surgeon comfort. Stereoscopy technology's proven effectiveness and clinical versatility directly address the industry requirements for precise surgical visualization and enhanced procedural accuracy across diverse surgical platforms and specialty categories.
This technology segment forms the foundation of modern surgical imaging, as it represents the approach with the greatest contribution to depth perception enhancement and established performance record across multiple surgical applications and procedural types. Healthcare industry investments in advanced visualization technologies continue to strengthen adoption among hospitals and surgical centers. With surgical requirements demanding enhanced visualization and procedural precision, stereoscopy aligns with both clinical objectives and surgeon preferences, making it the central component of comprehensive surgical imaging strategies.
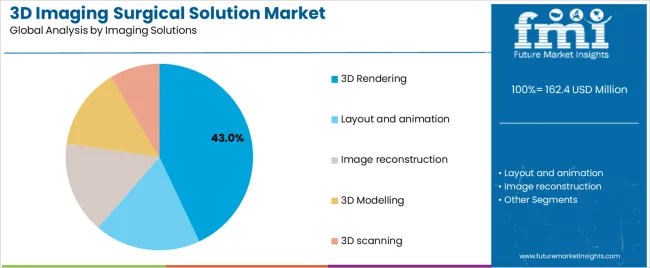
The 3D rendering application segment is projected to represent the largest share of 3D imaging surgical solution demand in 2025 with a 43.0% market share, underscoring its critical role as the primary driver for imaging solution adoption across pre-operative planning, intra-operative guidance, and surgical simulation applications. Healthcare providers prefer 3D rendering capabilities due to exceptional visualization quality, comprehensive anatomical representation, and ability to support surgical planning while enhancing procedural understanding and patient communication. Positioned as essential capabilities for modern surgical practice, 3D rendering solutions offer both clinical advantages and educational benefits.
The segment is supported by continuous innovation in rendering algorithms and the growing availability of advanced software platforms that enable superior visualization with enhanced real-time performance and reduced processing requirements. Healthcare facilities are investing in comprehensive 3D rendering integration programs to support increasingly complex surgical procedures and personalized treatment approaches. As surgical complexity increases and precision requirements intensify, the 3D rendering application will continue to dominate the market while supporting advanced visualization utilization and surgical outcome optimization strategies.
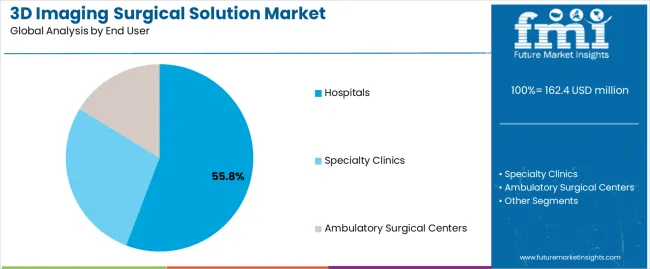
The hospitals end-user segment is projected to represent the largest share of 3D imaging surgical solution demand in 2025 with a 55.8% market share, underscoring its critical role as the primary driver for technology adoption across tertiary care facilities, academic medical centers, and specialized surgical hospitals. Hospital administrators prefer 3D imaging surgical solutions due to exceptional clinical value delivery, comprehensive surgical application coverage, and ability to support multiple specialties while enhancing institutional reputation and patient outcomes. Positioned as essential technologies for modern surgical departments, 3D imaging systems offer both clinical advantages and operational benefits.
The segment is supported by continuous hospital infrastructure investment and the growing availability of integrated surgical suites that enable superior technology deployment with enhanced workflow efficiency and multidisciplinary utilization. Hospitals are investing in comprehensive surgical technology programs to support increasingly sophisticated procedures and quality improvement initiatives. As healthcare delivery models evolve and surgical complexity increases, the hospitals end-user segment will continue to dominate the market while supporting advanced technology utilization and clinical excellence strategies.
The 3D imaging surgical solution market is advancing steadily due to increasing demand for minimally invasive surgical procedures driven by patient outcomes improvement and growing adoption of robotic-assisted surgery platforms that require specialized visualization technologies providing enhanced depth perception and anatomical clarity benefits across diverse neurosurgical, cardiovascular, orthopedic, and general surgical applications. The market faces challenges, including high capital investment requirements and limited budget availability in healthcare institutions, technical complexity and surgeon learning curve considerations, and integration challenges with existing surgical equipment and hospital information systems. Innovation in artificial intelligence integration and augmented reality visualization continues to influence product development and market expansion patterns.
The growing adoption of robotic-assisted surgical systems is driving demand for specialized 3D imaging solutions that address unique visualization requirements including console display integration, enhanced depth perception for remote manipulation, and optimized imaging synchronization with robotic instrument movements. Robotic surgery platforms require advanced 3D imaging configurations that deliver superior visualization across multiple parameters while maintaining system integration and procedural efficiency. Hospital administrators are increasingly recognizing the competitive advantages of integrated 3D imaging solutions for robotic surgery programs and institutional differentiation, creating opportunities for innovative visualization technologies specifically designed for next-generation surgical platforms and minimally invasive procedure applications.
Modern 3D imaging surgical solution manufacturers are incorporating artificial intelligence algorithms and augmented reality visualization to enhance surgical guidance, provide real-time anatomical recognition, and support comprehensive decision support through optimized image processing and intelligent overlay capabilities. Leading companies are developing AI-powered image enhancement for improved visualization quality, implementing augmented reality navigation systems for surgical guidance, and advancing visualization technologies that integrate pre-operative imaging with intra-operative real-time views. These technologies improve surgical precision while enabling new clinical opportunities, including personalized surgical planning, predictive outcome modeling, and intelligent procedural assistance. Advanced AI and AR integration also allows surgeons to support comprehensive surgical excellence objectives and clinical differentiation beyond traditional visualization capabilities.
The expansion of ambulatory surgical centers and office-based surgical procedures is driving demand for portable 3D imaging solutions with compact form factors, simplified operation, and cost-effective deployment that support surgical procedures in diverse clinical settings beyond traditional operating rooms. These portable imaging developments require innovative system architectures with optimized size and weight characteristics that maintain visualization quality while enabling flexible deployment, creating accessible market segments with differentiated value propositions. Manufacturers are investing in miniaturization capabilities and wireless technology integration to serve emerging decentralized surgical applications while supporting procedural quality across diverse healthcare delivery environments.
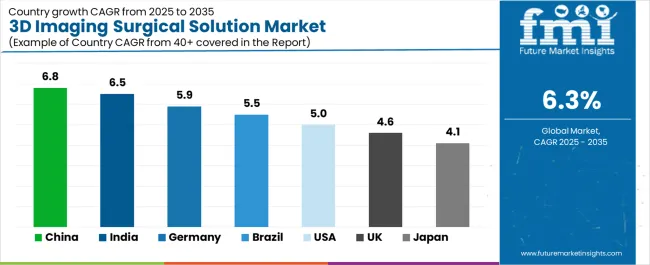
| Country | CAGR (2025-2035) |
|---|---|
| China | 8.5% |
| India | 7.8% |
| Germany | 7.2% |
| USA | 5.9% |
| UK | 5.3% |
| Japan | 4.7% |
The 3D imaging surgical solution market is experiencing solid growth globally, with China leading at an 8.5% CAGR through 2035, driven by expanding healthcare infrastructure investment, growing surgical procedure volumes, and increasing adoption of advanced medical technologies in tier-one and tier-two hospitals. India follows at 7.8%, supported by rapidly growing private healthcare sector, expanding super-specialty hospital networks, and increasing medical tourism driving demand for advanced surgical capabilities. Germany demonstrates 7.2% growth, supported by advanced healthcare system excellence, medical technology innovation leadership, and comprehensive surgical quality standards. The United States records 5.9%, focusing on robotic surgery adoption, hybrid operating room development, and value-based care initiatives driving surgical technology investment. The United Kingdom exhibits 5.3% growth, emphasizing NHS modernization programs and specialty surgical center development. Japan shows 4.7% growth, emphasizing precision medicine approaches and advanced surgical technique adoption across medical institutions.
The report covers an in-depth analysis of 40+ countries, with top-performing countries are highlighted below.
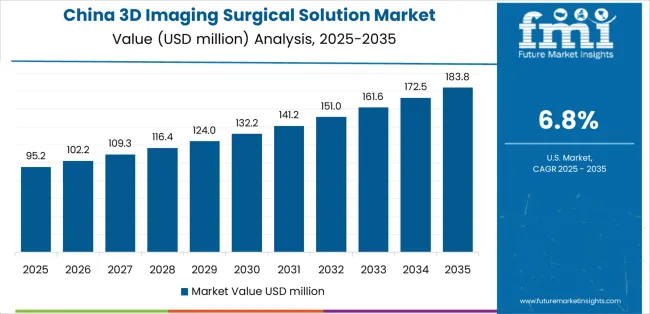
Revenue from 3D imaging surgical solutions in China is projected to exhibit exceptional growth with a CAGR of 8.5% through 2035, driven by expanding healthcare infrastructure investment and rapidly growing surgical procedure volumes supported by government Healthy China 2030 initiatives and medical technology modernization programs. The country's massive healthcare sector expansion and increasing investment in advanced surgical technologies are creating substantial demand for 3D imaging solutions. Major hospital groups and medical device companies are establishing comprehensive 3D imaging surgical capabilities to serve both domestic markets and medical tourism opportunities.
Demand for 3D imaging surgical solutions in India is expanding at a CAGR of 7.8%, supported by the country's rapidly growing private healthcare sector, expanding super-specialty hospital networks, and increasing medical tourism driven by cost advantages and quality improvement initiatives. The country's comprehensive healthcare infrastructure development and rising surgical procedure complexity are driving sophisticated 3D imaging capabilities throughout metropolitan and emerging urban markets. Leading hospital chains and international medical device companies are establishing extensive technology deployment facilities to address growing domestic and international patient demand.
Revenue from 3D imaging surgical solutions in Germany is growing at a CAGR of 7.2%, driven by the country's advanced healthcare system, medical technology innovation leadership, and precision surgical capabilities supporting sophisticated 3D imaging development for complex procedural applications. Germany's medical excellence and engineering expertise are driving advanced visualization capabilities throughout surgical specialties. Leading medical device manufacturers and university hospitals are establishing comprehensive innovation programs for next-generation surgical imaging technologies.
Demand for 3D imaging surgical solutions in the United States is expected to expand at a CAGR of 5.9%, supported by the country's leadership in robotic surgery adoption, expanding hybrid operating room installations, and growing emphasis on value-based care models driving surgical outcome optimization. The nation's advanced healthcare infrastructure and surgical innovation culture are driving demand for sophisticated 3D imaging solutions. Hospital systems and ambulatory surgical centers are investing in visualization technology upgrades and integrated surgical suite development to serve evolving clinical requirements.
Revenue from 3D imaging surgical solutions in the United Kingdom is anticipated to grow at a CAGR of 5.3%, supported by the country's NHS modernization programs, expanding specialty surgical center development, and increasing private healthcare sector investment in advanced surgical technologies. The UK established healthcare infrastructure and quality focus are driving demand for advanced 3D imaging products. NHS trusts and private hospital groups are investing in surgical technology capabilities to address clinical requirements.
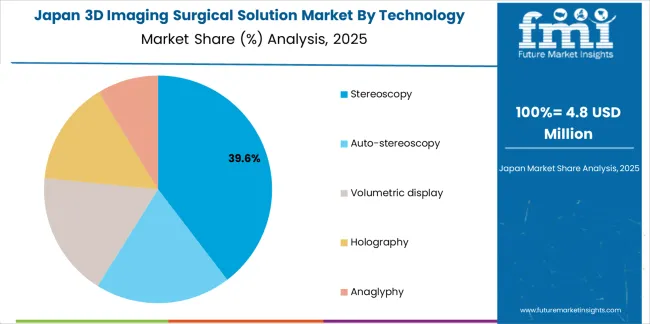
Demand for 3D imaging surgical solutions in Japan is expanding at a CAGR of 4.7%, driven by the country's precision medicine emphasis, advanced surgical technique development, and strong focus on technological integration across medical institutions. Japan's medical sophistication and quality excellence are supporting investment in advanced 3D imaging technologies. Leading university hospitals and medical technology companies are establishing specialized capabilities for premium surgical applications.
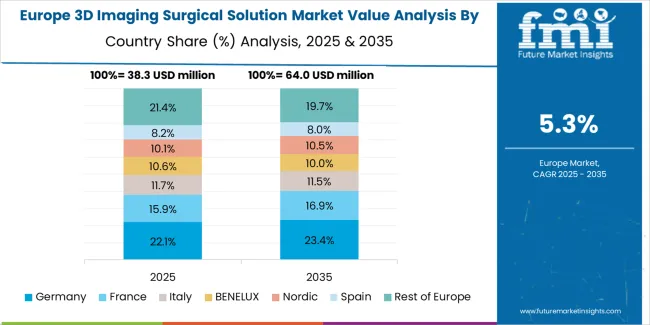
The 3D imaging surgical solution market in Europe is projected to grow from USD 42.8 million in 2025 to USD 78.1 million by 2035, registering a CAGR of 6.2% over the forecast period. Germany is expected to maintain leadership with a 27.3% market share in 2025, moderating to 26.9% by 2035, supported by medical technology innovation excellence, advanced surgical capabilities, and strong healthcare infrastructure investment.
The United Kingdom follows with 18.2% in 2025, projected at 18.0% by 2035, driven by NHS modernization initiatives, specialty surgical center development, and private healthcare sector expansion. France holds 15.6% in 2025, reaching 15.8% by 2035 on the back of academic medical center leadership and surgical innovation programs. Italy commands 13.1% in 2025, rising slightly to 13.3% by 2035, while Spain accounts for 10.4% in 2025, reaching 10.6% by 2035 aided by private hospital expansion and medical tourism growth. The Netherlands maintains 5.9% in 2025, up to 6.0% by 2035 due to academic medical center excellence and surgical innovation focus. The Rest of Europe region, including Nordics, Central & Eastern Europe, and other markets, is anticipated to hold 9.5% in 2025 and 9.4% by 2035, reflecting steady growth in surgical technology adoption, hospital modernization programs, and specialty procedure volume expansion.
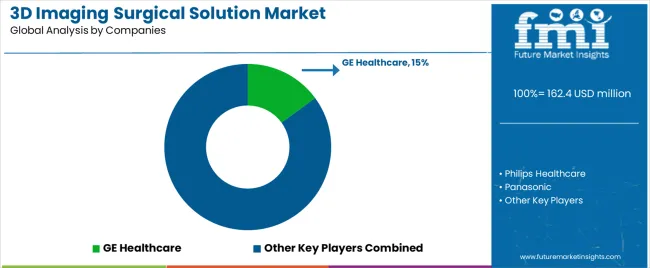
The 3D Imaging Surgical Solution Market is growing as hospitals and surgical centers adopt advanced visualization systems that improve precision, reduce surgical errors, and support minimally invasive procedures. 3D imaging provides enhanced depth perception and anatomical clarity during neurosurgery, orthopedics, cardiovascular interventions, and robotic-assisted operations. Rising demand for better clinical outcomes, surgeon training tools, and patient-specific preoperative planning is accelerating the shift from traditional 2D imaging to high-resolution 3D visualization platforms.
GE Healthcare and Philips Healthcare play major roles with integrated operating room imaging systems that combine real-time visualization with intraoperative navigation. Panasonic Healthcare contributes display and imaging hardware used in advanced surgical suites. Stryker Corporation and Medtronic plc develop surgical navigation and robotic assistance platforms that rely on 3D imaging for accurate tool positioning and anatomical mapping.
Specialized surgical imaging and navigation innovators such as Brainlab AG, Leica Microsystems, and Karl Storz SE & Co. KG provide precision visualization solutions for neurosurgery, spine surgery, and endoscopic procedures. Able Software Corp. supports 3D imaging and surgical planning software, while Lockheed Martin contributes advanced imaging technologies stemming from aerospace and simulation research. As surgical environments become increasingly digital and data-driven, 3D imaging is emerging as a core enabler of precision surgery and personalized treatment planning.
3D imaging surgical solutions represent an advanced medical technology segment within surgical care delivery, projected to grow from USD 162.4 million in 2025 to USD 299.2 million by 2035 at a 6.3% CAGR. These sophisticated visualization systems—primarily stereoscopic and rendering configurations for multiple surgical applications—serve as critical precision enhancement tools in hospital operating rooms, specialty surgical clinics, and ambulatory surgical centers where enhanced depth perception, anatomical visualization, and procedural accuracy are essential. Market expansion is driven by increasing minimally invasive surgical adoption, growing robotic surgery platform deployment, expanding hybrid operating room installations, and rising demand for precision surgical technologies across diverse neurosurgical, cardiovascular, orthopedic, and general surgical procedure segments.
How Healthcare Regulators Could Strengthen Product Standards and Clinical Safety?
How Industry Associations Could Advance Technology Standards and Clinical Adoption?
How 3D Imaging Surgical Solution Manufacturers Could Drive Innovation and Market Leadership?
How Healthcare Facilities Could Optimize Technology Utilization and Clinical Outcomes?
How Research Institutions Could Enable Technology Advancement?
How Investors and Financial Enablers Could Support Market Growth and Innovation?
| Items | Values |
|---|---|
| Quantitative Units (2025) | USD 162.4 million |
| Technology Type | Stereoscopy, Auto-stereoscopy, Volumetric display, Holography, Anaglyphy |
| Imaging Solutions | 3D Rendering, Layout and animation, Image reconstruction, 3D Modelling, 3D scanning |
| End User | Hospitals, Specialty Clinics, Ambulatory Surgical Centers |
| Regions Covered | East Asia, Europe, North America, South Asia, Latin America, Middle East & Africa, Eastern Europe |
| Countries Covered | China, India, Germany, United States, United Kingdom, Japan, and 40+ countries |
| Key Companies Profiled | GE Healthcare, Philips Healthcare, Panasonic Healthcare, Lockheed Martin, Able Software Corp., Stryker Corporation, Medtronic plc, Brainlab AG, Leica Microsystems, and Karl Storz SE & Co. KG |
| Additional Attributes | Dollar sales by technology type, imaging solutions, and end-user category, regional demand trends, competitive landscape, technological advancements in surgical visualization, artificial intelligence integration, augmented reality innovation, and clinical outcome optimization |
The global 3D imaging surgical solution market is estimated to be valued at USD 162.4 million in 2025.
The market size for the 3D imaging surgical solution market is projected to reach USD 298.0 million by 2035.
The 3D imaging surgical solution market is expected to grow at a 6.3% CAGR between 2025 and 2035.
The key product types in 3D imaging surgical solution market are stereoscopy , auto-stereoscopy, volumetric display, holography and anaglyphy.
In terms of imaging solutions, 3D rendering segment to command 43.0% share in the 3D imaging surgical solution market in 2025.


Our Research Products

The "Full Research Suite" delivers actionable market intel, deep dives on markets or technologies, so clients act faster, cut risk, and unlock growth.

The Leaderboard benchmarks and ranks top vendors, classifying them as Established Leaders, Leading Challengers, or Disruptors & Challengers.

Locates where complements amplify value and substitutes erode it, forecasting net impact by horizon

We deliver granular, decision-grade intel: market sizing, 5-year forecasts, pricing, adoption, usage, revenue, and operational KPIs—plus competitor tracking, regulation, and value chains—across 60 countries broadly.

Spot the shifts before they hit your P&L. We track inflection points, adoption curves, pricing moves, and ecosystem plays to show where demand is heading, why it is changing, and what to do next across high-growth markets and disruptive tech

Real-time reads of user behavior. We track shifting priorities, perceptions of today’s and next-gen services, and provider experience, then pace how fast tech moves from trial to adoption, blending buyer, consumer, and channel inputs with social signals (#WhySwitch, #UX).

Partner with our analyst team to build a custom report designed around your business priorities. From analysing market trends to assessing competitors or crafting bespoke datasets, we tailor insights to your needs.
Supplier Intelligence
Discovery & Profiling
Capacity & Footprint
Performance & Risk
Compliance & Governance
Commercial Readiness
Who Supplies Whom
Scorecards & Shortlists
Playbooks & Docs
Category Intelligence
Definition & Scope
Demand & Use Cases
Cost Drivers
Market Structure
Supply Chain Map
Trade & Policy
Operating Norms
Deliverables
Buyer Intelligence
Account Basics
Spend & Scope
Procurement Model
Vendor Requirements
Terms & Policies
Entry Strategy
Pain Points & Triggers
Outputs
Pricing Analysis
Benchmarks
Trends
Should-Cost
Indexation
Landed Cost
Commercial Terms
Deliverables
Brand Analysis
Positioning & Value Prop
Share & Presence
Customer Evidence
Go-to-Market
Digital & Reputation
Compliance & Trust
KPIs & Gaps
Outputs
Full Research Suite comprises of:
Market outlook & trends analysis
Interviews & case studies
Strategic recommendations
Vendor profiles & capabilities analysis
5-year forecasts
8 regions and 60+ country-level data splits
Market segment data splits
12 months of continuous data updates
DELIVERED AS:
PDF EXCEL ONLINE
Demand for 3D Imaging Surgical Solution in Japan Size and Share Forecast Outlook 2025 to 2035
Demand for 3D Imaging Surgical Solution in USA Size and Share Forecast Outlook 2025 to 2035
3D Surgical Microscope Systems Market Size and Share Forecast Outlook 2025 to 2035
3D Printed Surgical Models Market Analysis - Size, Share, and Forecast 2025 to 2035
Specific Imaging Solution Market Insights – Demand and Growth Forecast 2025 to 2035
Ultrasound Imaging Solution Market
Navigation, Imaging and Positioning Solutions Market - Trends & Forecast 2025 to 2035
3D Somatosensory Virtual Fitting Market Size and Share Forecast Outlook 2025 to 2035
3D Printing Industry Analysis in Middle East Size and Share Forecast Outlook 2025 to 2035
Surgical Tourniquet Market Size and Share Forecast Outlook 2025 to 2035
3D Printed Dental Brace Market Size and Share Forecast Outlook 2025 to 2035
3D Reverse Engineering Software Market Forecast and Outlook 2025 to 2035
3D Automatic Optical Inspection Machine Market Size and Share Forecast Outlook 2025 to 2035
Surgical Operating Microscope Market Forecast and Outlook 2025 to 2035
3D Ready Organoid Expansion Service Market Size and Share Forecast Outlook 2025 to 2035
3D-Printed Prosthetic Implants Market Size and Share Forecast Outlook 2025 to 2035
3D Printing Ceramics Market Size and Share Forecast Outlook 2025 to 2035
3D NAND Flash Memory Market Size and Share Forecast Outlook 2025 to 2035
3D Printing Metal Market Size and Share Forecast Outlook 2025 to 2035
Surgical Heart Valves Market Size and Share Forecast Outlook 2025 to 2035

Thank you!
You will receive an email from our Business Development Manager. Please be sure to check your SPAM/JUNK folder too.
Chat With
MaRIA