Methodology

3D Somatosensory Virtual Fitting Market Forecast and Outlook 2025 to 2035

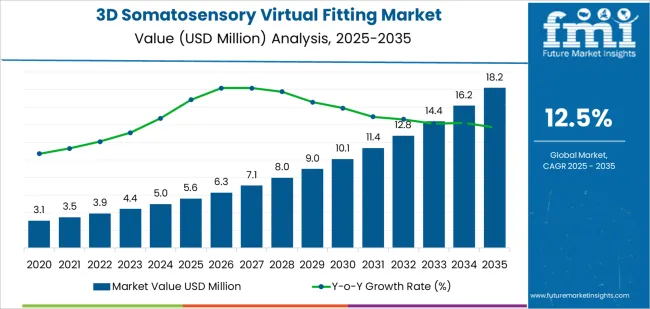
The global 3D somatosensory virtual fitting market is valued at USD 5.6 million in 2025 and is projected to reach USD 18.3 million by 2035, recording a CAGR of 12.5%. Early-stage growth is driven by the increasing demand for virtual try-on technologies across the fashion, eyewear, and footwear industries, where consumers seek immersive, accurate, and personalized fitting experiences. As e-commerce continues to rise, the need for innovative virtual fitting solutions that reduce returns and enhance customer satisfaction becomes more prominent. Advances in 3D scanning, augmented reality (AR), and somatosensory feedback further enhance the accuracy and realism of virtual fittings, boosting adoption.

As the market progresses toward 2035, demand continues to grow as retailers and brands expand their virtual fitting services to meet the expectations of tech-savvy consumers. The technology becomes increasingly integrated into both physical stores and online platforms, providing customers with seamless omnichannel experiences. The later part of the forecast period sees further refinement in the somatosensory feedback systems, incorporating AI-driven recommendations, adaptive sizing, and multi-sensory elements that improve the virtual fitting process. By 2035, this market continues to thrive, supported by ongoing innovations in immersive technologies and widespread integration across industries.
Quick Stats for 3D Somatosensory Virtual Fitting Market

  • 3D Somatosensory Virtual Fitting Market Value (2025): USD 5.6 million
  • 3D Somatosensory Virtual Fitting Market Forecast Value (2035): USD 18.3 million
  • 3D Somatosensory Virtual Fitting Market Forecast CAGR (2025-2035): 12.5%
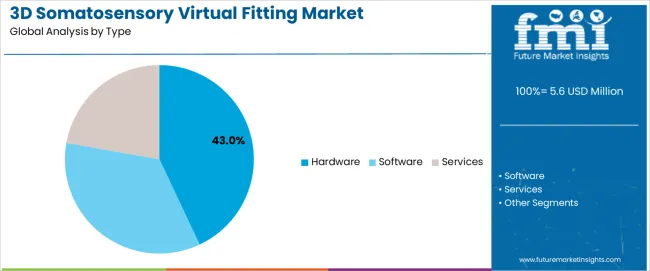
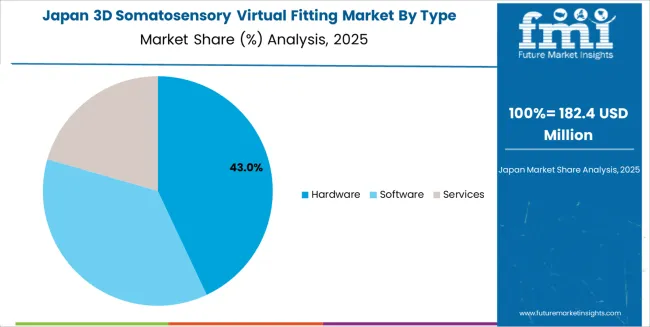
  • Leading Segment in 3D Somatosensory Virtual Fitting Market (2025): Hardware (43.0%)
  • Key Growth Regions in 3D Somatosensory Virtual Fitting Market: China, India, Germany, Brazil
  • Top Players in 3D Somatosensory Virtual Fitting Market: Magic Mirror, Trimirror, Fit Analytics, AstraFit, Rakuten Fits Me, ELSE Corp, Reactive Reality GmbH, WEARFITS, Coitor IT Tech, Quytech, Auglio, Sizebay, Virtusize, True Fit, Kivisense Technology, Beijing SanyTouch Technology, Beijing Huatang Liye Technology

3d Somatosensory Virtual Fitting Market Market Value Analysis

What is the Growth Forecast for the 3D Somatosensory Virtual Fitting Market through 2035?

Between 2025 and 2030, the 3D Somatosensory Virtual Fitting Market grows from USD 5.6 million to USD 10.1 million, adding USD 4.5 million in value. The first breakpoint occurs around 2027–2028, where the market sees a notable acceleration in growth, with annual increases moving from approximately USD 0.4 million to USD 0.7 million. This transition is driven by increasing adoption of virtual fitting solutions in the retail and e-commerce sectors, as well as advancements in augmented reality (AR) and 3D body scanning technologies. The demand for accurate, personalized online fitting solutions leads to stronger growth, particularly in the apparel, footwear, and accessories segments.

From 2030 to 2035, the market rises from USD 10.1 million to USD 18.3 million, adding another USD 8.2 million. The second breakpoint occurs around 2032–2033, when the market experiences a rapid surge in adoption as the technology becomes mainstream. Virtual fitting platforms are integrated with AI and machine learning to provide even more personalized experiences, driving increased usage across e-commerce platforms and physical retail stores. The rise of omnichannel retail strategies and growing consumer interest in seamless, virtual shopping experiences result in sustained strong growth throughout the second half of the decade.

3D Somatosensory Virtual Fitting Market Key Takeaways

Metric Value
Market Value (2025) USD 5.6 million
Market Forecast Value (2035) USD 18.3 million
Forecast CAGR (2025–2035) 12.5%

What is Fueling Growth in the 3D Somatosensory Virtual Fitting Market Across Retail and ECommerce?

The 3D somatosensory virtual fitting market is expanding as fashion brands, online retailers, and technology providers seek immersive, accurate fitting solutions that improve purchase confidence and reduce returns. These systems use depth sensing cameras, AI body scanning algorithms, and real time rendering to create digital avatars of shoppers that try on garments virtually. Retailers integrate these platforms across in store smart mirrors and mobile apps to enhance the customer journey and support omnichannel strategies. As e commerce penetration and mobile engagement rise, especially in Asia Pacific and Europe, the need for realistic virtual try on experiences strengthens.

The shift toward personalized, “fit first” shopping increases demand for hardware, software, and services enabling 3D somatosensory fitting environments. Growth is also supported by improvements in sensor latency, fabric simulation, and cloud based rendering pipelines. Providers are refining algorithms to better capture varied body types and integrate fabric behavior for more lifelike visualization. Advances in AR and VR technologies extend applications beyond apparel to eyewear, footwear, and accessories. Retailers deploying 3D fitting solutions aim to reduce costly returns, enhance customer satisfaction, and gather biometric driven insight for sizing optimization. While high implementation costs, data privacy concerns, and integration complexity remain barriers for smaller shops, the convergence of digital retail transformation and consumer demand for immersive experiences maintains strong momentum in the 3D somatosensory virtual fitting market.

How Do Technology Types and Distribution Channels Shape Segmentation in the 3D Somatosensory Virtual Fitting Market?

The 3D somatosensory virtual fitting market is segmented by type, application, and region. By type, the market is divided into hardware, software, and services. Based on application, it is categorized into e-commerce, physical store, and others. Regionally, the market is segmented into North America, Europe, East Asia, South Asia, Latin America, and the Middle East & Africa. These segments reflect varying consumer preferences for shopping experiences and technological adoption rates across virtual fitting systems.
What Factors Support the Leading Position of Hardware in the 3D Somatosensory Virtual Fitting Market?

3d Somatosensory Virtual Fitting Market Analysis By Type

The hardware segment accounts for approximately 43.0% of the global 3D somatosensory virtual fitting market in 2025, making it the leading type category. This position is driven by the essential role hardware devices, such as motion sensors, cameras, and VR/AR headsets, play in enabling realistic and interactive virtual fitting experiences. These devices are crucial for capturing precise body measurements, tracking movements, and providing real-time feedback during the fitting process, ensuring a highly immersive and accurate virtual shopping experience.

Adoption is strong in both e-commerce platforms and physical retail stores that are incorporating virtual try-on solutions into their sales models. Hardware solutions are central to enhancing the user experience, particularly in markets where virtual reality and augmented reality are becoming mainstream. The segment remains dominant because it provides the foundational technology that allows for accurate and dynamic virtual fittings, creating seamless integration between physical measurements and virtual representations. Hardware products continue to evolve, with advancements in sensor technology and computing power contributing to the increased market share of this segment.
Why Does E-commerce Represent the Largest Application Share in the 3D Somatosensory Virtual Fitting Market?

3d Somatosensory Virtual Fitting Market Analysis By Application

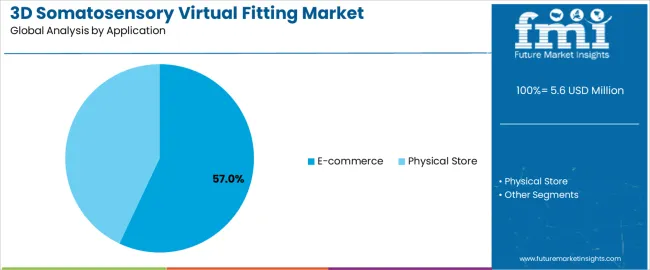
The e-commerce segment represents about 57.0% of the total 3D somatosensory virtual fitting market in 2025, making it the dominant application category. This position reflects the growing preference for online shopping and the increasing demand for technologies that can replicate in-store fitting experiences. Virtual fitting solutions in e-commerce enable consumers to try on clothing, accessories, or footwear virtually, helping overcome the limitations of online shopping, such as fit uncertainty and the inability to physically touch or try products.

The rise of fashion and apparel retailers adopting virtual fitting solutions on their websites or mobile apps is driving the segment’s growth. Additionally, e-commerce platforms offer greater scalability and reach, enabling retailers to offer personalized shopping experiences to a global audience. Adoption is especially high in North America, Europe, and East Asia, where internet penetration and mobile shopping continue to increase. E-commerce remains the largest application category because it offers a convenient and interactive shopping experience, allowing consumers to confidently make purchases while reducing returns due to sizing issues.

What are the Key Trends, Drivers, and Restraints in the 3D Somatosensory Virtual Fitting Market?

The 3D somatosensory virtual fitting market is growing as fashion brands, online retailers and apparel manufacturers adopt immersive technologies that enable consumers to try on clothing, footwear and accessories digitally via motion capture, AR/VR and 3D scanning. This technology supports improved fit accuracy, reduced returns and enhanced user engagement. Growth is supported by rising online fashion sales, demand for personalised experiences and investment in digital first retail infrastructure. Adoption is limited by technical complexity, need for high quality body scan data and hardware requirements on the consumer side. Providers are developing browser based fitting tools, mobile camera friendly platforms and workflow integration for retailers.

How is the surge in online fashion retail driving demand for virtual fitting technologies?

Demand is driven by the rapid growth of e commerce in apparel and footwear, where fit uncertainty remains a primary barrier to conversion and a major contributor to returns. Virtual fitting solutions enable consumers to visualise how items will appear and fit without physical try on, reducing friction and improving confidence in purchase decisions. Retailers also use these tools to differentiate through experience, support multiple size variants and capture body data insights. As omnichannel retail expands, virtual fitting helps unify in store and online experiences and supports interactive shopping environments.

What factors are restraining broader implementation of 3D somatosensory fitting solutions?

Adoption is limited by several factors including the need for accurate body measurement data, which requires camera precision, optional depth sensors or scanning booths. Consumer devices vary widely in capability, making brand consistent experience difficult. Retailers face integration challenges with existing e commerce platforms, size chart complexity and variation across product categories. High quality virtual try on experiences need advanced 3D modelling and real time garment simulation rendering, which demands significant development and compute resources. These limitations slow widespread deployment in mass market retail.

What trends are shaping the evolution of virtual fitting technologies in fashion?

Key trends include increasing reliance on mobile camera based measurement without specialised hardware, use of AI to infer body shape dimensions from images and subscription based virtual fitting as a service models for smaller brands. Retailers are experimenting with full body avatars, live stream try ons with influencers and AR filters in social commerce. Solutions are also expanding into accessories and footwear, integrating haptic visual cues and size recommendation engines. As consumers demand greater personalisation and retailers aim to lower return rates, virtual fitting platforms continue to evolve toward seamless, hardware agnostic experiences.
What is the Analysis of the 3D Somatosensory Virtual Fitting Market by Key Country?

3d Somatosensory Virtual Fitting Market Cagr Analysis By Country

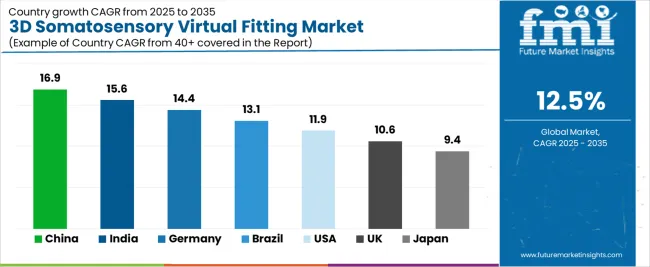
Country CAGR (%)
China 16.9%
India 15.6%
Germany 14.4%
Brazil 13.1%
USA 11.9%
UK 10.6%
Japan 9.4%

The 3D Somatosensory Virtual Fitting Market is experiencing rapid growth across global retail and e-commerce sectors, with China leading at a 16.9% CAGR through 2035, driven by booming e-commerce, advancements in augmented reality (AR), and increasing adoption of virtual fitting rooms in the apparel and fashion industries. India follows at 15.6%, supported by expanding internet penetration, growing interest in online shopping, and the rise of virtual fitting technology for personalized shopping experiences. Germany records 14.4%, reflecting high demand for cutting-edge retail technology, integration with mobile applications, and significant investment in consumer experience enhancement. Brazil grows at 13.1%, driven by the growing digital retail sector and demand for innovative shopping solutions. The USA, at 11.9%, remains a key market focusing on innovation, AR development, and retail integration, while the UK (10.6%) and Japan (9.4%) emphasize personalized, efficient, and immersive fitting experiences for enhancing online retail engagement.

How Is Retail Transformation Driving Market Growth in China?

China is projected to grow at a CAGR of 16.9% through 2035 in the 3D somatosensory virtual fitting market. Retail transformation driven by e-commerce growth and the demand for personalised shopping experiences fuels adoption of virtual fitting technologies. Brands implement 3D somatosensory fitting solutions to enhance online shopping by allowing customers to virtually try on clothing and accessories. Manufacturers focus on improving virtual fitting accuracy and integrating AI-driven size recommendations. The market is further supported by rising consumer expectations for immersive experiences, especially in fashion and beauty sectors, and growing technological investments in smart retail solutions.

  • Virtual fitting enhances online shopping with accurate, personalised size recommendations.
  • Integration of AI-driven solutions improves fitting accuracy for online shoppers.
  • Rising consumer expectations drive demand for immersive, tech-enabled retail experiences.
  • Investments in smart retail solutions accelerate adoption across e-commerce platforms.

Why Are Online Shopping Preferences Boosting India’s Market?

India is projected to grow at a CAGR of 15.6% through 2035 in the 3D somatosensory virtual fitting market. The rapid growth of online shopping, combined with increasing consumer demand for personalised experiences, fuels the adoption of 3D virtual fitting technologies in India. Virtual fitting solutions are increasingly integrated into fashion e-commerce platforms to provide customers with accurate size recommendations and virtual try-ons, eliminating the need for physical trials. Indian retailers adopt these solutions to improve customer satisfaction and reduce return rates. This growth is further supported by the expansion of the digital infrastructure and mobile shopping habits.
  • Virtual try-ons increase consumer satisfaction and reduce returns in online shopping.
  • Digital infrastructure expansion supports widespread virtual fitting solution adoption.
  • Personalised shopping experiences drive demand for 3D somatosensory fitting technology.
  • Integration of size recommendations improves fitting accuracy and customer experience.

How Is Technology Integration Enhancing Market Growth in Germany?

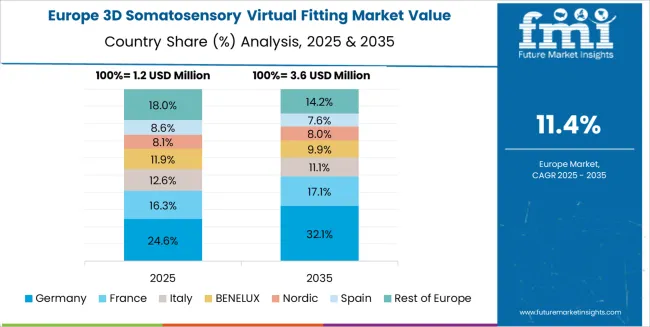
3d Somatosensory Virtual Fitting Market Europe Country Market Share Analysis, 2025 & 2035

Germany is projected to grow at a CAGR of 14.4% through 2035 in the 3D somatosensory virtual fitting market. The growing adoption of augmented reality (AR) and virtual reality (VR) in retail, especially in the fashion sector, drives demand for somatosensory fitting solutions. Retailers leverage these technologies to provide consumers with interactive and immersive virtual fitting experiences, enhancing their confidence in purchasing apparel online. Manufacturers focus on developing advanced 3D body scanning technology to improve the accuracy of virtual fittings. The market is further fueled by consumer interest in seamless online shopping and the increasing preference for customisation.

  • AR and VR adoption enhances virtual fitting accuracy and customer engagement.
  • Interactive fitting experiences increase consumer confidence in online apparel purchases.
  • 3D body scanning improves fitting precision for customised apparel recommendations.
  • Rising demand for personalised shopping experiences accelerates technology adoption.

Why Are Consumer Behaviour Trends Supporting Brazil’s Market?

Brazil is projected to grow at a CAGR of 13.1% through 2035 in the 3D somatosensory virtual fitting market. Shifting consumer behaviour towards online shopping and the growing desire for personalised shopping experiences are major factors driving the adoption of virtual fitting solutions. Brazilian retailers increasingly integrate 3D virtual fitting technology into their e-commerce platforms to offer customers a virtual try-on experience. This growth is supported by the expansion of high-speed internet, mobile shopping apps, and the demand for interactive shopping experiences in urban areas. The market is further enhanced by regional fashion trends and consumer preferences.
  • Online shopping growth increases demand for virtual fitting in Brazil.
  • High-speed internet and mobile apps support e-commerce technology adoption.
  • Virtual try-on experiences reduce purchase hesitations and returns in online fashion.
  • Regional fashion preferences influence adoption of personalised fitting solutions.

How Is Online Fashion Retail Driving Market Adoption in the USA?

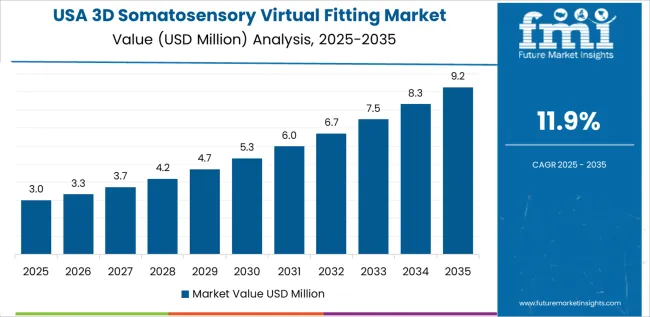
3d Somatosensory Virtual Fitting Market Country Value Analysis

USA is projected to grow at a CAGR of 11.9% through 2035 in the 3D somatosensory virtual fitting market. The continued rise of online fashion retail, combined with consumers' increasing desire for convenience and accuracy, drives the adoption of virtual fitting solutions. American retailers implement 3D somatosensory technology to provide consumers with virtual try-ons, helping them make informed decisions about size and fit. This technology reduces return rates and enhances customer satisfaction. Additionally, the growing importance of social media marketing and influencer collaborations contributes to higher consumer engagement with virtual fitting tools.

  • Virtual try-ons improve consumer confidence and reduce return rates in retail.
  • Social media marketing increases consumer awareness and engagement with virtual fitting tools.
  • 3D technology enables precise fit and size recommendations for online shoppers.
  • Retailers adopt virtual fitting solutions to enhance customer satisfaction and convenience.

How Are Innovation and Consumer Expectations Influencing the UK Market?

UK is projected to grow at a CAGR of 10.6% through 2035 in the 3D somatosensory virtual fitting market. Consumer demand for personalised and seamless shopping experiences accelerates the adoption of virtual fitting technologies. UK retailers focus on incorporating immersive virtual try-on experiences across their fashion and accessory product lines to meet consumer expectations. 3D body scanning, AI-powered size recommendations, and real-time feedback are central to improving the accuracy of virtual fittings. The market is driven by the integration of AR and VR technologies in retail, enhancing customer satisfaction and reducing the likelihood of returns.
  • 3D body scanning technology enhances virtual fitting accuracy for online shoppers.
  • AR and VR integration in retail creates more immersive shopping experiences.
  • AI-powered recommendations help consumers select the right size with confidence.
  • Rising consumer expectations drive the demand for innovative fitting solutions.

How Is Japan’s Market Responding to Growing Digital Retail Trends?

3d Somatosensory Virtual Fitting Market Japan Market Share Analysis By Type

Japan is projected to grow at a CAGR of 9.4% through 2035 in the 3D somatosensory virtual fitting market. Digital retail trends, particularly in fashion e-commerce, are increasing the demand for virtual fitting solutions that enhance the online shopping experience. Japanese retailers are increasingly implementing 3D somatosensory fitting technologies to provide consumers with personalised size recommendations and virtual try-ons. The growth is supported by high smartphone penetration and a tech-savvy consumer base, with consumers embracing innovations that simplify their shopping process. The market also benefits from the rise of virtual retail shows and digital fashion events.
  • Digital retail trends drive the need for accurate virtual fitting technologies.
  • High smartphone penetration increases adoption of virtual try-ons in Japan.
  • Tech-savvy consumers seek innovative solutions for improved shopping experiences.
  • Virtual fashion shows and events promote awareness of 3D fitting solutions.

How Competitive Is the Global 3D Somatosensory Virtual Fitting Market and What Defines Its Strategic Landscape?

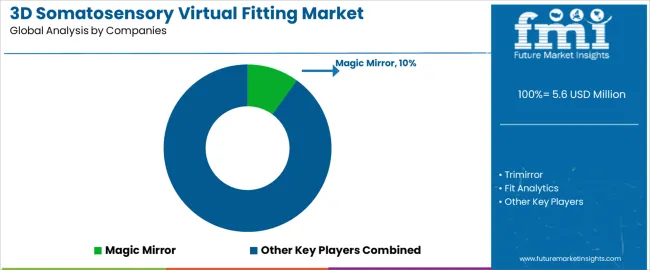
3d Somatosensory Virtual Fitting Market Analysis By Company

The global 3D somatosensory virtual fitting market is highly competitive, with numerous players offering innovative solutions that combine 3D body scanning, augmented reality (AR), and artificial intelligence (AI) to provide virtual clothing fitting experiences for consumers. Magic Mirror and Trimirror are key leaders in this space, offering advanced mirror systems and virtual try-on solutions designed for retail stores and e-commerce platforms. Fit Analytics and AstraFit strengthen the market by providing AI-driven size recommendation systems that enhance the virtual fitting experience through personalized garment suggestions based on customer measurements. Rakuten Fits Me and ELSE Corp contribute further by integrating these technologies with e-commerce platforms to provide seamless online shopping experiences. Reactive Reality GmbH and WEARFITS broaden the market with AR-based virtual try-ons and sizing tools that optimize the online shopping journey, making it easier for customers to find the right fit without trying on physical garments.

Coitor IT Tech, Quytech, Auglio, and Sizebay expand the market through customized fitting solutions that use advanced body measurement techniques and data analytics to ensure a more accurate virtual fitting experience. Virtusize and True Fit leverage large-scale consumer data and AI to offer size prediction and virtual fitting recommendations for both brands and end-users. Kivisense Technology, Beijing SanyTouch Technology, and Beijing Huatang Liye Technology further support this competitive landscape by offering specialized 3D body scanning solutions that integrate with existing e-commerce platforms for enhanced customer experiences. Competition is shaped by the accuracy of the body scanning technology, user interface, integration with retailer platforms, and the ability to provide highly personalized fitting solutions. As online shopping continues to grow, companies offering advanced, reliable, and seamless virtual fitting experiences are well-positioned to lead the market.

Key Players in 3D Somatosensory Virtual Fitting Market

  • Magic Mirror
  • Trimirror
  • Fit Analytics
  • AstraFit
  • Rakuten Fits Me
  • ELSE Corp
  • Reactive Reality GmbH
  • WEARFITS
  • Coitor IT Tech
  • Quytech
  • Auglio
  • Sizebay
  • Virtusize
  • True Fit
  • Kivisense Technology
  • Beijing SanyTouch Technology
  • Beijing Huatang Liye Technology

Report Scope for 3D Somatosensory Virtual Fitting Market

Items Values
Quantitative Units (2025) USD 5.6 million
Type Hardware, Software, Services
Application E-commerce, Physical Store
Regions Covered East Asia, Europe, North America, South Asia, Latin America, Middle East & Africa
Countries Covered China, India, Germany, Brazil, USA, UK, Japan, and others
Key Companies Profiled Magic Mirror, Trimirror, Fit Analytics, AstraFit, Rakuten Fits Me, ELSE Corp, Reactive Reality GmbH, WEARFITS, Coitor IT Tech, Quytech, Auglio, Sizebay, Virtusize, True Fit, Kivisense Technology, Beijing SanyTouch Technology, Beijing Huatang Liye Technology
Additional Attributes Market share by type and application, consumer demand for personalized fitting experiences, technological advancements in AR/VR and AI, integration with e-commerce and retail systems, hardware requirements for accurate virtual fittings, cloud-based rendering, biometric data utilization for sizing optimization.

3D Somatosensory Virtual Fitting Market Segmentation

Type:

  • Hardware
  • Software
  • Services

Application:

  • E-commerce
  • Physical Store

Region:

  • East Asia
    • China
    • Japan
    • South Korea
    • Taiwan
    • Rest of East Asia
  • Europe
    • Germany
    • UK
    • France
    • Italy
    • Spain
    • Switzerland
    • Nordic
    • BENELUX
    • Rest of Europe
  • North America
    • USA
    • Canada
    • Mexico
  • South Asia
    • India
    • Pakistan
    • Bangladesh
    • Rest of South Asia
  • Latin America
    • Brazil
    • Argentina
    • Chile
    • Rest of Latin America
  • Middle East & Africa
    • Kingdom of Saudi Arabia
    • Other GCC Countries
    • Turkey
    • South Africa
    • Other African Union
    • Rest of Middle East & Africa
  • Eastern Europe
    • Russia
    • Poland
    • Czech Republic
    • Rest of Eastern Europe

Frequently Asked Questions

How big is the 3d somatosensory virtual fitting market in 2025?

The global 3d somatosensory virtual fitting market is estimated to be valued at USD 5.6 million in 2025.

What will be the size of 3d somatosensory virtual fitting market in 2035?

The market size for the 3d somatosensory virtual fitting market is projected to reach USD 18.2 million by 2035.

How much will be the 3d somatosensory virtual fitting market growth between 2025 and 2035?

The 3d somatosensory virtual fitting market is expected to grow at a 12.5% CAGR between 2025 and 2035.

What are the key product types in the 3d somatosensory virtual fitting market?

The key product types in 3d somatosensory virtual fitting market are hardware, software and services.

Which application segment to contribute significant share in the 3d somatosensory virtual fitting market in 2025?

In terms of application, e-commerce segment to command 57.0% share in the 3d somatosensory virtual fitting market in 2025.

Table of Content

  1. Executive Summary
    • Global Market Outlook
    • Demand to side Trends
    • Supply to side Trends
    • Technology Roadmap Analysis
    • Analysis and Recommendations
  2. Market Overview
    • Market Coverage / Taxonomy
    • Market Definition / Scope / Limitations
  3. Market Background
    • Market Dynamics
      • Drivers
      • Restraints
      • Opportunity
      • Trends
    • Scenario Forecast
      • Demand in Optimistic Scenario
      • Demand in Likely Scenario
      • Demand in Conservative Scenario
    • Opportunity Map Analysis
    • Product Life Cycle Analysis
    • Supply Chain Analysis
    • Investment Feasibility Matrix
    • Value Chain Analysis
    • PESTLE and Porter’s Analysis
    • Regulatory Landscape
    • Regional Parent Market Outlook
    • Production and Consumption Statistics
    • Import and Export Statistics
  4. Global Market Analysis 2020 to 2024 and Forecast, 2025 to 2035
    • Historical Market Size Value (USD Million) Analysis, 2020 to 2024
    • Current and Future Market Size Value (USD Million) Projections, 2025 to 2035
      • Y to o to Y Growth Trend Analysis
      • Absolute $ Opportunity Analysis
  5. Global Market Pricing Analysis 2020 to 2024 and Forecast 2025 to 2035
  6. Global Market Analysis 2020 to 2024 and Forecast 2025 to 2035, By Type
    • Introduction / Key Findings
    • Historical Market Size Value (USD Million) Analysis By Type , 2020 to 2024
    • Current and Future Market Size Value (USD Million) Analysis and Forecast By Type , 2025 to 2035
      • Hardware
      • Software
      • Services
    • Y to o to Y Growth Trend Analysis By Type , 2020 to 2024
    • Absolute $ Opportunity Analysis By Type , 2025 to 2035
  7. Global Market Analysis 2020 to 2024 and Forecast 2025 to 2035, By Application
    • Introduction / Key Findings
    • Historical Market Size Value (USD Million) Analysis By Application, 2020 to 2024
    • Current and Future Market Size Value (USD Million) Analysis and Forecast By Application, 2025 to 2035
      • E-commerce
      • Physical Store
    • Y to o to Y Growth Trend Analysis By Application, 2020 to 2024
    • Absolute $ Opportunity Analysis By Application, 2025 to 2035
  8. Global Market Analysis 2020 to 2024 and Forecast 2025 to 2035, By Region
    • Introduction
    • Historical Market Size Value (USD Million) Analysis By Region, 2020 to 2024
    • Current Market Size Value (USD Million) Analysis and Forecast By Region, 2025 to 2035
      • North America
      • Latin America
      • Western Europe
      • Eastern Europe
      • East Asia
      • South Asia and Pacific
      • Middle East & Africa
    • Market Attractiveness Analysis By Region
  9. North America Market Analysis 2020 to 2024 and Forecast 2025 to 2035, By Country
    • Historical Market Size Value (USD Million) Trend Analysis By Market Taxonomy, 2020 to 2024
    • Market Size Value (USD Million) Forecast By Market Taxonomy, 2025 to 2035
      • By Country
        • USA
        • Canada
        • Mexico
      • By Type
      • By Application
    • Market Attractiveness Analysis
      • By Country
      • By Type
      • By Application
    • Key Takeaways
  10. Latin America Market Analysis 2020 to 2024 and Forecast 2025 to 2035, By Country
    • Historical Market Size Value (USD Million) Trend Analysis By Market Taxonomy, 2020 to 2024
    • Market Size Value (USD Million) Forecast By Market Taxonomy, 2025 to 2035
      • By Country
        • Brazil
        • Chile
        • Rest of Latin America
      • By Type
      • By Application
    • Market Attractiveness Analysis
      • By Country
      • By Type
      • By Application
    • Key Takeaways
  11. Western Europe Market Analysis 2020 to 2024 and Forecast 2025 to 2035, By Country
    • Historical Market Size Value (USD Million) Trend Analysis By Market Taxonomy, 2020 to 2024
    • Market Size Value (USD Million) Forecast By Market Taxonomy, 2025 to 2035
      • By Country
        • Germany
        • UK
        • Italy
        • Spain
        • France
        • Nordic
        • BENELUX
        • Rest of Western Europe
      • By Type
      • By Application
    • Market Attractiveness Analysis
      • By Country
      • By Type
      • By Application
    • Key Takeaways
  12. Eastern Europe Market Analysis 2020 to 2024 and Forecast 2025 to 2035, By Country
    • Historical Market Size Value (USD Million) Trend Analysis By Market Taxonomy, 2020 to 2024
    • Market Size Value (USD Million) Forecast By Market Taxonomy, 2025 to 2035
      • By Country
        • Russia
        • Poland
        • Hungary
        • Balkan & Baltic
        • Rest of Eastern Europe
      • By Type
      • By Application
    • Market Attractiveness Analysis
      • By Country
      • By Type
      • By Application
    • Key Takeaways
  13. East Asia Market Analysis 2020 to 2024 and Forecast 2025 to 2035, By Country
    • Historical Market Size Value (USD Million) Trend Analysis By Market Taxonomy, 2020 to 2024
    • Market Size Value (USD Million) Forecast By Market Taxonomy, 2025 to 2035
      • By Country
        • China
        • Japan
        • South Korea
      • By Type
      • By Application
    • Market Attractiveness Analysis
      • By Country
      • By Type
      • By Application
    • Key Takeaways
  14. South Asia and Pacific Market Analysis 2020 to 2024 and Forecast 2025 to 2035, By Country
    • Historical Market Size Value (USD Million) Trend Analysis By Market Taxonomy, 2020 to 2024
    • Market Size Value (USD Million) Forecast By Market Taxonomy, 2025 to 2035
      • By Country
        • India
        • ASEAN
        • Australia & New Zealand
        • Rest of South Asia and Pacific
      • By Type
      • By Application
    • Market Attractiveness Analysis
      • By Country
      • By Type
      • By Application
    • Key Takeaways
  15. Middle East & Africa Market Analysis 2020 to 2024 and Forecast 2025 to 2035, By Country
    • Historical Market Size Value (USD Million) Trend Analysis By Market Taxonomy, 2020 to 2024
    • Market Size Value (USD Million) Forecast By Market Taxonomy, 2025 to 2035
      • By Country
        • Kingdom of Saudi Arabia
        • Other GCC Countries
        • Turkiye
        • South Africa
        • Other African Union
        • Rest of Middle East & Africa
      • By Type
      • By Application
    • Market Attractiveness Analysis
      • By Country
      • By Type
      • By Application
    • Key Takeaways
  16. Key Countries Market Analysis
    • USA
      • Pricing Analysis
      • Market Share Analysis, 2024
        • By Type
        • By Application
    • Canada
      • Pricing Analysis
      • Market Share Analysis, 2024
        • By Type
        • By Application
    • Mexico
      • Pricing Analysis
      • Market Share Analysis, 2024
        • By Type
        • By Application
    • Brazil
      • Pricing Analysis
      • Market Share Analysis, 2024
        • By Type
        • By Application
    • Chile
      • Pricing Analysis
      • Market Share Analysis, 2024
        • By Type
        • By Application
    • Germany
      • Pricing Analysis
      • Market Share Analysis, 2024
        • By Type
        • By Application
    • UK
      • Pricing Analysis
      • Market Share Analysis, 2024
        • By Type
        • By Application
    • Italy
      • Pricing Analysis
      • Market Share Analysis, 2024
        • By Type
        • By Application
    • Spain
      • Pricing Analysis
      • Market Share Analysis, 2024
        • By Type
        • By Application
    • France
      • Pricing Analysis
      • Market Share Analysis, 2024
        • By Type
        • By Application
    • India
      • Pricing Analysis
      • Market Share Analysis, 2024
        • By Type
        • By Application
    • ASEAN
      • Pricing Analysis
      • Market Share Analysis, 2024
        • By Type
        • By Application
    • Australia & New Zealand
      • Pricing Analysis
      • Market Share Analysis, 2024
        • By Type
        • By Application
    • China
      • Pricing Analysis
      • Market Share Analysis, 2024
        • By Type
        • By Application
    • Japan
      • Pricing Analysis
      • Market Share Analysis, 2024
        • By Type
        • By Application
    • South Korea
      • Pricing Analysis
      • Market Share Analysis, 2024
        • By Type
        • By Application
    • Russia
      • Pricing Analysis
      • Market Share Analysis, 2024
        • By Type
        • By Application
    • Poland
      • Pricing Analysis
      • Market Share Analysis, 2024
        • By Type
        • By Application
    • Hungary
      • Pricing Analysis
      • Market Share Analysis, 2024
        • By Type
        • By Application
    • Kingdom of Saudi Arabia
      • Pricing Analysis
      • Market Share Analysis, 2024
        • By Type
        • By Application
    • Turkiye
      • Pricing Analysis
      • Market Share Analysis, 2024
        • By Type
        • By Application
    • South Africa
      • Pricing Analysis
      • Market Share Analysis, 2024
        • By Type
        • By Application
  17. Market Structure Analysis
    • Competition Dashboard
    • Competition Benchmarking
    • Market Share Analysis of Top Players
      • By Regional
      • By Type
      • By Application
  18. Competition Analysis
    • Competition Deep Dive
      • Magic Mirror
        • Overview
        • Product Portfolio
        • Profitability by Market Segments (Product/Age /Sales Channel/Region)
        • Sales Footprint
        • Strategy Overview
          • Marketing Strategy
          • Product Strategy
          • Channel Strategy
      • Trimirror
      • Fit Analytics
      • AstraFit
      • Rakuten Fits Me
      • ELSE Corp
      • Reactive Reality GmbH
      • WEARFITS
      • Coitor IT Tech
      • Quytech
      • Auglio
      • Sizebay
      • Virtusize
      • True Fit
      • Kivisense Technology
      • Beijing SanyTouch Technology
      • Beijing Huatang Liye Technology
  19. Assumptions & Acronyms Used
  20. Research Methodology

List of Tables

  • Table 1: Global Market Value (USD Million) Forecast by Region, 2020 to 2035
  • Table 2: Global Market Value (USD Million) Forecast by Type , 2020 to 2035
  • Table 3: Global Market Value (USD Million) Forecast by Application, 2020 to 2035
  • Table 4: North America Market Value (USD Million) Forecast by Country, 2020 to 2035
  • Table 5: North America Market Value (USD Million) Forecast by Type , 2020 to 2035
  • Table 6: North America Market Value (USD Million) Forecast by Application, 2020 to 2035
  • Table 7: Latin America Market Value (USD Million) Forecast by Country, 2020 to 2035
  • Table 8: Latin America Market Value (USD Million) Forecast by Type , 2020 to 2035
  • Table 9: Latin America Market Value (USD Million) Forecast by Application, 2020 to 2035
  • Table 10: Western Europe Market Value (USD Million) Forecast by Country, 2020 to 2035
  • Table 11: Western Europe Market Value (USD Million) Forecast by Type , 2020 to 2035
  • Table 12: Western Europe Market Value (USD Million) Forecast by Application, 2020 to 2035
  • Table 13: Eastern Europe Market Value (USD Million) Forecast by Country, 2020 to 2035
  • Table 14: Eastern Europe Market Value (USD Million) Forecast by Type , 2020 to 2035
  • Table 15: Eastern Europe Market Value (USD Million) Forecast by Application, 2020 to 2035
  • Table 16: East Asia Market Value (USD Million) Forecast by Country, 2020 to 2035
  • Table 17: East Asia Market Value (USD Million) Forecast by Type , 2020 to 2035
  • Table 18: East Asia Market Value (USD Million) Forecast by Application, 2020 to 2035
  • Table 19: South Asia and Pacific Market Value (USD Million) Forecast by Country, 2020 to 2035
  • Table 20: South Asia and Pacific Market Value (USD Million) Forecast by Type , 2020 to 2035
  • Table 21: South Asia and Pacific Market Value (USD Million) Forecast by Application, 2020 to 2035
  • Table 22: Middle East & Africa Market Value (USD Million) Forecast by Country, 2020 to 2035
  • Table 23: Middle East & Africa Market Value (USD Million) Forecast by Type , 2020 to 2035
  • Table 24: Middle East & Africa Market Value (USD Million) Forecast by Application, 2020 to 2035

List of Figures

  • Figure 1: Global Market Pricing Analysis
  • Figure 2: Global Market Value (USD Million) Forecast 2020-2035
  • Figure 3: Global Market Value Share and BPS Analysis by Type , 2025 and 2035
  • Figure 4: Global Market Y-o-Y Growth Comparison by Type , 2025-2035
  • Figure 5: Global Market Attractiveness Analysis by Type
  • Figure 6: Global Market Value Share and BPS Analysis by Application, 2025 and 2035
  • Figure 7: Global Market Y-o-Y Growth Comparison by Application, 2025-2035
  • Figure 8: Global Market Attractiveness Analysis by Application
  • Figure 9: Global Market Value (USD Million) Share and BPS Analysis by Region, 2025 and 2035
  • Figure 10: Global Market Y-o-Y Growth Comparison by Region, 2025-2035
  • Figure 11: Global Market Attractiveness Analysis by Region
  • Figure 12: North America Market Incremental Dollar Opportunity, 2025-2035
  • Figure 13: Latin America Market Incremental Dollar Opportunity, 2025-2035
  • Figure 14: Western Europe Market Incremental Dollar Opportunity, 2025-2035
  • Figure 15: Eastern Europe Market Incremental Dollar Opportunity, 2025-2035
  • Figure 16: East Asia Market Incremental Dollar Opportunity, 2025-2035
  • Figure 17: South Asia and Pacific Market Incremental Dollar Opportunity, 2025-2035
  • Figure 18: Middle East & Africa Market Incremental Dollar Opportunity, 2025-2035
  • Figure 19: North America Market Value Share and BPS Analysis by Country, 2025 and 2035
  • Figure 20: North America Market Value Share and BPS Analysis by Type , 2025 and 2035
  • Figure 21: North America Market Y-o-Y Growth Comparison by Type , 2025-2035
  • Figure 22: North America Market Attractiveness Analysis by Type
  • Figure 23: North America Market Value Share and BPS Analysis by Application, 2025 and 2035
  • Figure 24: North America Market Y-o-Y Growth Comparison by Application, 2025-2035
  • Figure 25: North America Market Attractiveness Analysis by Application
  • Figure 26: Latin America Market Value Share and BPS Analysis by Country, 2025 and 2035
  • Figure 27: Latin America Market Value Share and BPS Analysis by Type , 2025 and 2035
  • Figure 28: Latin America Market Y-o-Y Growth Comparison by Type , 2025-2035
  • Figure 29: Latin America Market Attractiveness Analysis by Type
  • Figure 30: Latin America Market Value Share and BPS Analysis by Application, 2025 and 2035
  • Figure 31: Latin America Market Y-o-Y Growth Comparison by Application, 2025-2035
  • Figure 32: Latin America Market Attractiveness Analysis by Application
  • Figure 33: Western Europe Market Value Share and BPS Analysis by Country, 2025 and 2035
  • Figure 34: Western Europe Market Value Share and BPS Analysis by Type , 2025 and 2035
  • Figure 35: Western Europe Market Y-o-Y Growth Comparison by Type , 2025-2035
  • Figure 36: Western Europe Market Attractiveness Analysis by Type
  • Figure 37: Western Europe Market Value Share and BPS Analysis by Application, 2025 and 2035
  • Figure 38: Western Europe Market Y-o-Y Growth Comparison by Application, 2025-2035
  • Figure 39: Western Europe Market Attractiveness Analysis by Application
  • Figure 40: Eastern Europe Market Value Share and BPS Analysis by Country, 2025 and 2035
  • Figure 41: Eastern Europe Market Value Share and BPS Analysis by Type , 2025 and 2035
  • Figure 42: Eastern Europe Market Y-o-Y Growth Comparison by Type , 2025-2035
  • Figure 43: Eastern Europe Market Attractiveness Analysis by Type
  • Figure 44: Eastern Europe Market Value Share and BPS Analysis by Application, 2025 and 2035
  • Figure 45: Eastern Europe Market Y-o-Y Growth Comparison by Application, 2025-2035
  • Figure 46: Eastern Europe Market Attractiveness Analysis by Application
  • Figure 47: East Asia Market Value Share and BPS Analysis by Country, 2025 and 2035
  • Figure 48: East Asia Market Value Share and BPS Analysis by Type , 2025 and 2035
  • Figure 49: East Asia Market Y-o-Y Growth Comparison by Type , 2025-2035
  • Figure 50: East Asia Market Attractiveness Analysis by Type
  • Figure 51: East Asia Market Value Share and BPS Analysis by Application, 2025 and 2035
  • Figure 52: East Asia Market Y-o-Y Growth Comparison by Application, 2025-2035
  • Figure 53: East Asia Market Attractiveness Analysis by Application
  • Figure 54: South Asia and Pacific Market Value Share and BPS Analysis by Country, 2025 and 2035
  • Figure 55: South Asia and Pacific Market Value Share and BPS Analysis by Type , 2025 and 2035
  • Figure 56: South Asia and Pacific Market Y-o-Y Growth Comparison by Type , 2025-2035
  • Figure 57: South Asia and Pacific Market Attractiveness Analysis by Type
  • Figure 58: South Asia and Pacific Market Value Share and BPS Analysis by Application, 2025 and 2035
  • Figure 59: South Asia and Pacific Market Y-o-Y Growth Comparison by Application, 2025-2035
  • Figure 60: South Asia and Pacific Market Attractiveness Analysis by Application
  • Figure 61: Middle East & Africa Market Value Share and BPS Analysis by Country, 2025 and 2035
  • Figure 62: Middle East & Africa Market Value Share and BPS Analysis by Type , 2025 and 2035
  • Figure 63: Middle East & Africa Market Y-o-Y Growth Comparison by Type , 2025-2035
  • Figure 64: Middle East & Africa Market Attractiveness Analysis by Type
  • Figure 65: Middle East & Africa Market Value Share and BPS Analysis by Application, 2025 and 2035
  • Figure 66: Middle East & Africa Market Y-o-Y Growth Comparison by Application, 2025-2035
  • Figure 67: Middle East & Africa Market Attractiveness Analysis by Application
  • Figure 68: Global Market - Tier Structure Analysis
  • Figure 69: Global Market - Company Share Analysis
Dashboard
Dashboard
Dashboard
Dashboard
Dashboard
Dashboard

Our Research Products

Full Research Suite

The "Full Research Suite" delivers actionable market intel, deep dives on markets or technologies, so clients act faster, cut risk, and unlock growth.

Competitor Leaderboard Report

The Leaderboard benchmarks and ranks top vendors, classifying them as Established Leaders, Leading Challengers, or Disruptors & Challengers.

Future Leaders Index

Locates where complements amplify value and substitutes erode it, forecasting net impact by horizon

Market Data & Forecasts

We deliver granular, decision-grade intel: market sizing, 5-year forecasts, pricing, adoption, usage, revenue, and operational KPIs—plus competitor tracking, regulation, and value chains—across 60 countries broadly.

Market Focus Report

Spot the shifts before they hit your P&L. We track inflection points, adoption curves, pricing moves, and ecosystem plays to show where demand is heading, why it is changing, and what to do next across high-growth markets and disruptive tech

Survey Report

Real-time reads of user behavior. We track shifting priorities, perceptions of today’s and next-gen services, and provider experience, then pace how fast tech moves from trial to adoption, blending buyer, consumer, and channel inputs with social signals (#WhySwitch, #UX).

Bespoke Reports

Partner with our analyst team to build a custom report designed around your business priorities. From analysing market trends to assessing competitors or crafting bespoke datasets, we tailor insights to your needs.

Supplier Intelligence

Discovery & Profiling

Capacity & Footprint

Performance & Risk

Compliance & Governance

Commercial Readiness

Who Supplies Whom

Scorecards & Shortlists

Playbooks & Docs

Category Intelligence

Definition & Scope

Demand & Use Cases

Cost Drivers

Market Structure

Supply Chain Map

Trade & Policy

Operating Norms

Deliverables

Buyer Intelligence

Account Basics

Spend & Scope

Procurement Model

Vendor Requirements

Terms & Policies

Entry Strategy

Pain Points & Triggers

Outputs

Pricing Analysis

Benchmarks

Trends

Should-Cost

Indexation

Landed Cost

Commercial Terms

Deliverables

Brand Analysis

Positioning & Value Prop

Share & Presence

Customer Evidence

Go-to-Market

Digital & Reputation

Compliance & Trust

KPIs & Gaps

Outputs

Full Research Suite comprises of:

Market outlook & trends analysis

Market outlook & trends analysis

Interviews & case studies

Interviews & case studies

Strategic recommendations

Strategic recommendations

Vendor profiles & capabilities analysis

Vendor profiles & capabilities analysis

5-year forecasts

5-year forecasts

8 regions and 60+ country-level data splits

8 regions and 60+ country-level data splits

Market segment data splits

Market segment data splits

12 months of continuous data updates

12 months of continuous data updates

DELIVERED AS:

PDF EXCEL ONLINE

Full Research Suite


$5000

$7500

$10000

Buy Report Now
Similar Industry Reports

Similar Industry Reports

3D Imaging Surgical Solution Market

3D Imaging Surgical Solution Market Size and Share Forecast Outlook 2025 to 2035

3D Printing Industry Analysis in Middle East

3D Printing Industry Analysis in Middle East Size and Share Forecast Outlook 2025 to 2035

3D Printed Dental Brace Market

3D Printed Dental Brace Market Size and Share Forecast Outlook 2025 to 2035

3D Reverse Engineering Software Market

3D Reverse Engineering Software Market Forecast and Outlook 2025 to 2035

3D Automatic Optical Inspection Machine Market

3D Automatic Optical Inspection Machine Market Size and Share Forecast Outlook 2025 to 2035

3D Ready Organoid Expansion Service Market

3D Ready Organoid Expansion Service Market Size and Share Forecast Outlook 2025 to 2035

3D-Printed Prosthetic Implants Market

3D-Printed Prosthetic Implants Market Size and Share Forecast Outlook 2025 to 2035

3D Printing Ceramics Market

3D Printing Ceramics Market Size and Share Forecast Outlook 2025 to 2035

3D NAND Flash Memory Market

3D NAND Flash Memory Market Size and Share Forecast Outlook 2025 to 2035

3D Printing Metal Market

3D Printing Metal Market Size and Share Forecast Outlook 2025 to 2035

3D Bioprinted Organ Transplants Market

3D Bioprinted Organ Transplants Market Size and Share Forecast Outlook 2025 to 2035

3D Mapping and Modeling Market

3D Mapping and Modeling Market Size and Share Forecast Outlook 2025 to 2035

3D Audio Market
3D Audio Market

3D Audio Market Size and Share Forecast Outlook 2025 to 2035

3D Printing in Aerospace and Defense Market

3D Printing in Aerospace and Defense Market Analysis - Size, Share, and Forecast Outlook 2025 to 2035

3D Printed Maxillofacial Implants Market

3D Printed Maxillofacial Implants Market Size and Share Forecast Outlook 2025 to 2035

3D Surgical Microscope Systems Market

3D Surgical Microscope Systems Market Size and Share Forecast Outlook 2025 to 2035

3D-Printed Personalized Masks Market

3D-Printed Personalized Masks Market Size and Share Forecast Outlook 2025 to 2035

3D Printing Market
3D Printing Market

3D Printing Market Size and Share Forecast Outlook 2025 to 2035

3D Printed Packaging Market

3D Printed Packaging Market Size and Share Forecast Outlook 2025 to 2035

3D Printed Clear Dental Aligners Market

3D Printed Clear Dental Aligners Market Size and Share Forecast Outlook 2025 to 2035

Future Market Insights

3D Somatosensory Virtual Fitting Market

Chat With MaRIA

Chat With

MaRIA

Hi There, I am MaRIA, Your Market Research Intelligence Assistant. How may I help you?