3D Printing in Aerospace and Defense Market Size, Share, and Forecast Outlook 2025 to 2035

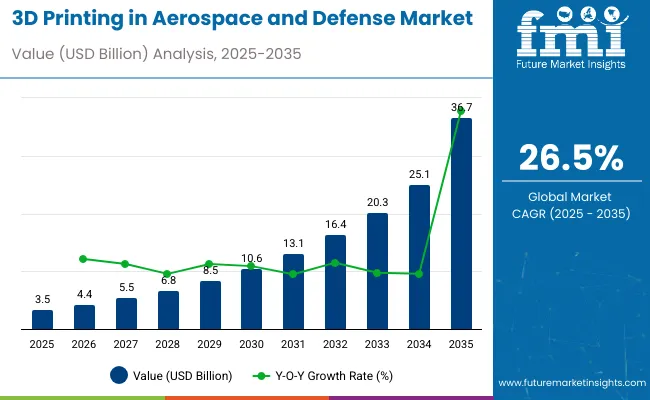
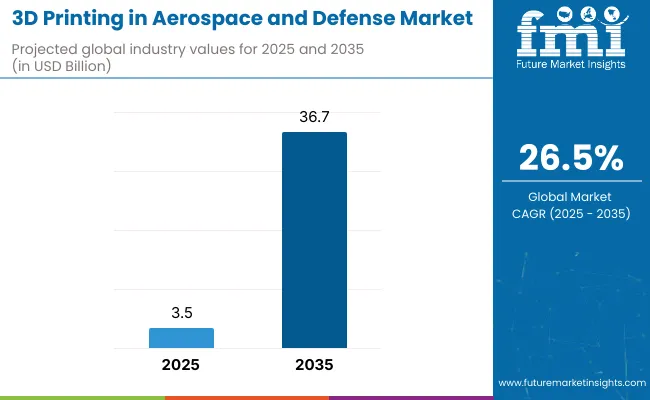
The 3D printing in aerospace and defense market is estimated at USD 3.5 billion in 2025 and is likely to attain approximately USD 36.7 billion by 2035, advancing at a CAGR of 26.5%. The multiplying factor is about 10.5x, indicating that the market size in 2035 will be more than ten times the 2025 base. An assessment of seasonality and cyclicality reveals that the market is not subject to traditional consumer-driven seasonal fluctuations but is instead shaped by defense procurement schedules and aerospace production cycles.
3d Printing In Aerospace And Defense Market 1

Quick Stats of 3D Printing in Aerospace and Defense Market

  • 3D Printing in Aerospace and Defense Market Size (2025): USD 3.5 billion
  • Projected 3D Printing in Aerospace and Defense Market Size (2035): USD 36.7 billion
  • Forecast CAGR of 3D Printing in Aerospace and Defense Market (2025 to 2035): 26.5%
  • Leading Segment of 3D Printing in Aerospace and Defense Market (2025): Aircraft with 60% share
  • Key Growth Regions of 3D Printing in Aerospace and Defense Market: North America, Europe, Asia Pacific
  • Top Key Players of 3D Printing in Aerospace and Defense Market: GE Aviation, Airbus SE, The Boeing Company, Honeywell International Inc.

3d Printing In Aerospace And Defense Market

Metric Value
Market Estimated Value in (2025E) USD 3.5 billion
Market Forecast Value in (2035F) USD 36.7 billion
Forecast CAGR (2025 to 2035) 26.5%

In the defense sector, budget allocations and contract approvals often occur in defined intervals, creating cyclical increases in demand for additive manufacturing technologies. Similarly, aerospace production cycles, including the introduction of new aircraft models and periodic fleet maintenance, generate recurring peaks in the utilization of 3D printing for components and parts. These cyclical trends are balanced by continuous adoption for prototyping, tooling, and lightweight structural applications, ensuring a stable foundation of demand. While short-term variations are evident due to industry-specific cycles, the long-term outlook reflects consistent adoption of 3D printing, supported by its advantages in cost efficiency, material savings, and supply chain resilience across aerospace and defense operations.

The 3D printing in aerospace and defense market is supported by multiple parent sectors. Aerospace and defense manufacturing holds about 45%, reflecting heavy adoption for engines, airframes, and mission-critical parts. Advanced materials contribute nearly 25%, supplying high-strength alloys, composites, and polymers tailored for extreme environments. Industrial machinery makes up roughly 15%, covering the printers, lasers, and finishing equipment used in production. Engineering design and simulation software accounts for around 10%, enabling digital twins, CAD, and topology optimization. Maintenance and logistics support contributes close to 5%, where field-based 3D printing enables quick spare-part replacement and reduced downtime.

The 3D printing in aerospace and defense sector is advancing through new technologies, collaborations, and material innovation. Boeing, Airbus, GE Additive, and Lockheed Martin are expanding use of additive manufacturing for lightweight aircraft components and high-performance engine parts. Defense agencies are applying 3D printing for rapid prototyping and field-deployable spare parts. Rocket Lab and other space firms are manufacturing propulsion systems with up to 80 percent 3D-printed content, proving its scalability. High-temperature alloys, carbon fiber composites, and eco-friendly materials are strengthening applications. Strategic partnerships between OEMs, defense contractors, and material suppliers are accelerating certification, scaling production, and improving supply chain resilience.

Top 3D Printing in Aerospace and Defense Market Dynamics

The 3D printing in aerospace and defense market is advancing with increasing adoption for production of lightweight structural components, engine parts, and tooling. Aircraft and defense programs are shifting from prototype applications to serial production, driven by weight reduction of up to 40% and lead time savings of 60-70%. The technology also reduces material waste, with buy-to-fly ratios improving from 8:1 in conventional machining to nearly 2:1 through additive manufacturing. With aircraft fleets expanding and defense agencies seeking rapid deployment readiness, the demand for additive solutions in titanium, aluminum, and high-performance polymers is strengthening.

Driving Force Efficiency in Design and Production

The adoption of 3D printing in aerospace and defense is driven by its ability to reduce costs, improve efficiency, and enhance reliability. Weight reduction in aircraft components improves fuel efficiency by 1-2% across fleets, delivering lifetime operational savings. Lead times for complex parts shrink from several months to just weeks, supporting faster delivery of aircraft and defense systems. Component consolidation reduces part counts by up to 80%, minimizing joints and improving durability. Tooling made from advanced polymers lowers production cycle time and accelerates final assembly. Combined with digital documentation and repeatable build parameters, these drivers push adoption across both commercial and military segments.

  • Installed base of aerospace-grade 3D printers has crossed 6,000 globally.
  • Tooling lead time reduced by 50-70% through polymer additive manufacturing.
  • Digital part libraries cut spare part inventory levels by 20-30%.

Growth Avenue Expansion of Aftermarket and Repair Solutions

Aftermarket opportunities are expanding as 3D printing supports on-demand spare parts and repair solutions. Aircraft on ground events are costly, and additive manufacturing reduces turnaround time by 25-40%. Repair methods like directed energy deposition extend service life of turbine blades and structural components, reducing replacement expenses. Digital inventories enable localized printing in depots or forward bases, reducing logistics complexity. For defense agencies, field-level printing ensures mission readiness with faster availability of non-critical parts. The ability to qualify multiple machines under a single process standard accelerates adoption, enabling consistent builds across different regions. This creates strong growth potential in the aftermarket and repair ecosystem.

  • Spare part logistics costs drop by 15-25% with localized production.
  • Life-extension repairs add 30-50% operational hours for select components.
  • On-demand builds lower maintenance cycle times by 20-35%.

Emerging Trend Industrialization and Process Monitoring

Industrialization of additive manufacturing is increasing, supported by larger build platforms, multi-laser systems, and automated post-processing. Build speeds are improving by 200-300% compared with earlier systems, reducing cost per part. Monitoring technologies such as melt pool analysis and acoustic sensors detect defects in real time, raising process reliability. Powder recycling cycles extend usability up to five times, lowering material costs. Adoption of high-performance polymers like PEEK and PEKK is also increasing, particularly for cabin components and defense applications. With digital twins and closed-loop monitoring, qualification is shifting from individual part certification toward process-based approval, allowing faster scalability across programs.

  • Multi-laser printers cut production time by up to 60%.
  • Powder reuse reduces material spend by 10-15% per build.
  • Automated post-processing saves 5-10 labor hours per unit.

Market Challenge Cost, Certification, and Skill Gap

High costs of machines, materials, and certification remain major restraints. Aerospace-grade metal powders such as titanium alloys cost USD 200-400 per kg, while post-processing can account for up to 50% of total part cost. Printers designed for aerospace applications require investments between USD 1 million and 2.5 million per unit. Certification processes demand extensive testing, documentation, and qualification, which prolong adoption timelines. Limited availability of skilled technicians and engineers with expertise in additive processes slows capacity expansion. Additionally, ensuring consistency across multiple production sites is complex, creating challenges in scaling. These factors limit the pace of adoption despite strong demand.

  • Post-processing adds 10-20 hours for complex metal parts.
  • Machine utilization below 60% raises overall cost per part.
  • Certification files often exceed 1,000 pages for critical components.

Analyzing 3D Printing in Aerospace and Defense Market by Top Investment Segments

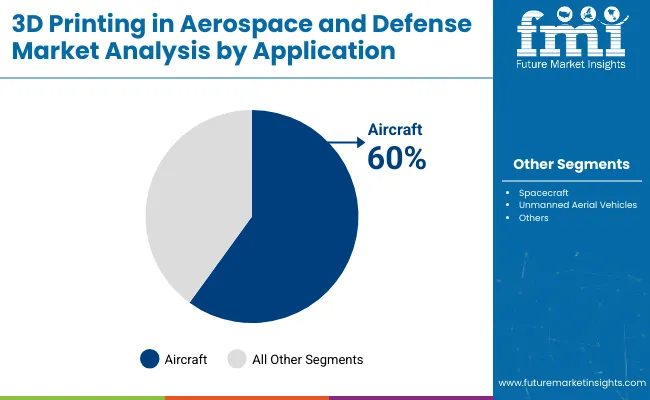
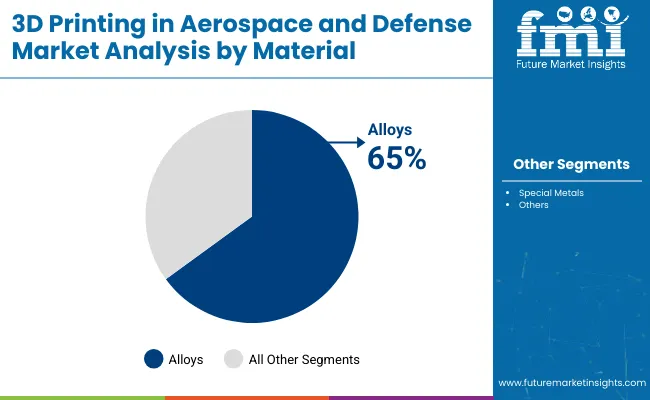
Aircraft dominate applications with 60% share, supported by lighter titanium components and production waste savings of up to 90%. Spacecraft follow at 25%, where weight savings cut launch costs by thousands per kilogram and accelerate satellite deployment. Alloys lead the material mix with 65% share, driven by titanium and aluminum, projected to support 42,000 aircraft deliveries by 2040. Special metals hold 35%, where nickel superalloys withstand over 1,300°C for propulsion systems. These segments drive performance, cost efficiency, and faster adoption of additive manufacturing technologies.
Aircraft Applications Lead Market with 60% Share

3d Printing In Aerospace And Defense Market By Application

Aircraft dominate 3D printing in aerospace and defense with 60% share, largely due to demand for lighter, fuel-efficient designs. Printed titanium and aluminum parts deliver weight savings of up to 30%, translating into significant fuel cost reductions across aircraft lifecycles. The technology reduces scrap rates by as much as 90%, a critical benefit in high-cost aerospace materials. Airbus uses over 1,000 printed parts in its A350 aircraft, while Boeing integrates printed brackets and ducts. The International Air Transport Association projects global air traffic to double by 2040, pushing fleet expansion. Additive manufacturing meets this demand by enabling shorter lead times, improved part customization, and lower maintenance costs. This makes aircraft applications the largest and fastest-adopting category.
  • 60% market share in aircraft applications
  • 30% component weight savings with titanium
  • 90% reduction in material waste

Alloys Dominate with 65% Share in Material Segment

3d Printing In Aerospace And Defense Market By Material

Alloys represent 65% of the material demand, primarily titanium and aluminum alloys. Titanium alloys are 40% lighter than steel and deliver high strength-to-weight ratios, ideal for aircraft frames and engine components. Aluminum alloys offer corrosion resistance and cost advantages, widely used in structural and cabin elements. Over 80% of metallic additive materials in aerospace consist of alloys, underlining their dominance. Boeing relies on titanium alloys for its Dreamliner series, while Airbus applies aluminum-based parts in its A320 line. Aircraft deliveries are projected to surpass 42,000 units by 2040, driving consistent demand for alloys. Lightweight alloy adoption supports both fuel efficiency and emission reduction goals, reinforcing their leading role in aerospace 3D printing.
  • 65% share for alloy-based materials
  • 40% lighter titanium vs steel
  • 42,000+ aircraft deliveries by 2040

Top Countries Driving, Developing, and Expanding 3D Printing in Aerospace & Defense Market

Country Wise 3d Printing In Aerospace And Defense Market

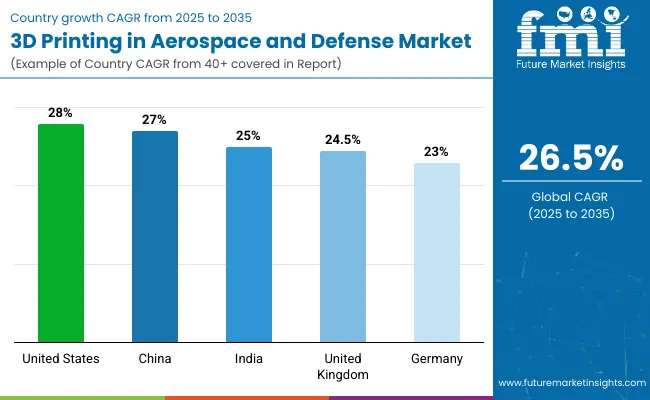
The global 3D printing in aerospace and defense market is growing at a CAGR of 26.5% from 2025 to 2035. The United States leads at 28%, +6% above the global benchmark, supported by OECD-driven defense modernization and advanced additive manufacturing adoption. China follows at 27%, +2% above the global rate, fueled by BRICS investments in aerospace capacity and technology integration. India records 25%, −6% compared with the global average, reflecting BRICS and ASEAN-linked initiatives in aircraft component manufacturing. The United Kingdom posts 24.5%, −8% below the global CAGR, backed by OECD-supported innovation in defense production. Germany stands at 23%, −13% below the global rate, influenced by gradual adoption through OECD-backed aerospace digitization. The overall trend shows OECD economies, led by the United States, advancing with strong technological capabilities, while BRICS members such as China and India continue strengthening their presence in the global aerospace supply chain.

Growth Outlook for 3D Printing in Aerospace and Defense Market in the United States

The United States market is projected to grow at a CAGR of 28%, slightly above the global 26.5%. Strong demand comes from defense programs and NASA-backed projects focusing on lightweight structures and fuel-efficient designs. By 2030, the US is expected to account for nearly USD 7 billion of global revenue, with 40% of total military-grade 3D printed parts produced domestically. Advanced composite material usage is growing faster than global averages, reflecting innovation in high-strength polymers and titanium-based printing.

  • Aerospace-focused additive manufacturing in the US expected to rise 30% by 2027
  • Defense-related 3D printing expenditure projected at USD 2.1 billion by 2030
  • Titanium-based 3D printing forecast to expand 14% annually

Future Forecast for 3D Printing in Aerospace and Defense Market in the United Kingdom

The United Kingdom is growing at a CAGR of 24.5%, below the global 26.5%. Growth is steady but tempered by smaller defense budgets compared with the US and China. By 2030, the UK market size is expected to reach USD 1.5 billion. Investments are directed toward commercial aviation parts, satellite components, and maintenance applications. More than 60% of new 3D printing projects are aimed at reducing turnaround time for replacement parts. The slightly lower CAGR reflects slower funding pace, although adoption in civil aerospace remains strong.

  • Satellite-related 3D printing in the UK projected to grow 20% by 2027
  • Commercial aviation components expected to represent 55% of revenue by 2030
  • Maintenance-related applications forecast to expand 18% annually

Analysis of 3D Printing in Aerospace and Defense Market in Germany

Germany is expanding at a CAGR of 23%, 3.5% below the global 26.5%. By 2030, the German market is projected to reach USD 2 billion. Growth is fueled by adoption in Airbus programs and strong R&D investment in metal powders and high-strength polymers. However, slower CAGR reflects Germany’s focus on gradual scaling and cost optimization rather than rapid deployment. Defense-related 3D printing programs are advancing at 18% annually, while aerospace manufacturing adoption in civil aviation is expanding at 20%.

  • Metal powder-based 3D printing in Germany projected to grow 19% annually
  • Airbus-related 3D printing applications expected to cover 45% of market share by 2030
  • Civil aviation 3D printing adoption forecast to rise 20% annually

Demand Forecast for 3D Printing in Aerospace and Defense Market in China

China is projected to grow at a CAGR of 27%, slightly above the global 26.5%. By 2030, China is expected to capture USD 4 billion in market size. High investment in military aircraft and satellite programs supports rapid adoption. More than 65% of domestic aerospace suppliers are expected to integrate additive manufacturing by 2028. The higher CAGR reflects both strong government funding and the drive to achieve independence in critical aerospace technologies.

  • Military aircraft 3D printing projected to grow at 29% annually
  • Domestic aerospace supplier adoption forecast to exceed 65% by 2028
  • Satellite component 3D printing expected to expand 26% annually

3D Printing in Aerospace and Defense Market Growth in India

India is expanding at a CAGR of 25%, slightly below the global 26.5%. The market is projected to reach USD 1.8 billion by 2030. Adoption is focused on defense aircraft programs, missile components, and space applications. ISRO-led initiatives are expected to account for 35% of total additive manufacturing applications in aerospace by 2030. While the CAGR trails global averages, government-driven defense procurement and private partnerships are accelerating adoption.
  • ISRO-led 3D printing programs forecast to grow 28% by 2028
  • Defense aircraft 3D printing applications projected to expand 22% annually
  • Space-related additive manufacturing expected to account for 35% of demand by 2030

Leading 3D Printing in Aerospace & Defense Manufacturers, Suppliers, Distributors

3d Printing In Aerospace And Defense Market By Company

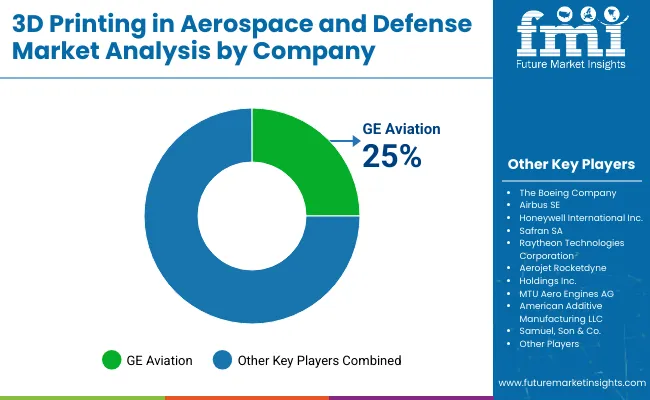
Industry leader - GE Aviation - 25%

The aerospace and defense industry is witnessing steady adoption of 3D printing, with established manufacturers expanding their capabilities to enhance production efficiency and material performance. GE Aviation leads the way by investing in large-scale additive manufacturing facilities, producing advanced fuel nozzles and turbine parts. The Boeing Company applies 3D printing for lightweight structural elements, cabin components, and defense systems, often partnering with suppliers to streamline large-batch production. Airbus SE integrates additive processes into multiple aircraft programs, especially for structural and interior parts. Honeywell International Inc. leverages additive manufacturing for engines and aerospace systems, while Safran SA uses it to refine jet engine components.

Other players are strengthening their positions through research, product launches, and collaborative projects. Aerojet Rocketdyne Holdings Inc. applies 3D printing to propulsion systems, cutting down development time for rocket engines. MTU Aero Engines AG has successfully introduced printed parts in turbine production. Raytheon Technologies Corporation uses additive techniques for missile and radar system components. Meanwhile, American Additive Manufacturing LLC and Samuel, Son & Co. provide specialized contract manufacturing to support larger industry players. These strategies, combining targeted R&D and component-level innovations, are shaping the role of 3D printing in aerospace and defense manufacturing.

Leading Players

  • GE Aviation
  • The Boeing Company
  • Airbus SE
  • Honeywell International Inc.
  • Safran SA
  • Raytheon Technologies Corporation
  • AerojetRocketdyne Holdings Inc.
  • MTU Aero Engines AG
  • American Additive Manufacturing LLC
  • Samuel, Son & Co.

Report Scope

Report Attributes Details
Market Size (2025) USD 3.5 billion
Projected Market Size (2035) USD 36.7 billion
CAGR (2025 to 2035) 26.5%
Base Year for Estimation 2024
Historical Period 2020 to 2024
Projection Period 2025 to 2035
Quantitative Units USD billion for value
Application Segments Analyzed Aircraft, Unmanned Aerial Vehicles, Spacecraft
Material Segments Analyzed Alloys, Special Metals
Regions Covered North America, Europe, Asia Pacific, Latin America, Middle East and Africa
Countries Covered United States, Canada, Brazil, Mexico, Germany, United Kingdom, France, Italy, China, Japan, India, UAE, South Africa, others
Key Players GE Aviation, The Boeing Company, Airbus SE, Honeywell International Inc., Safran SA, Raytheon Technologies Corporation, Aerojet Rocketdyne Holdings Inc., MTU Aero Engines AG, American Additive Manufacturing LLC, Samuel Son & Co.
Additional Attributes Dollar sales by printing technology and material type, demand dynamics across aircraft, defense, and space applications, regional adoption trends across North America, Europe, and Asia-Pacific, innovation in metal additive manufacturing, lightweight structures, and rapid prototyping, environmental impact of reduced material waste, emerging use cases in spare part production, satellite hardware, UAV development

3D Printing in Aerospace and Defense Market Analyzed by Key Investment Segments 

By Application:

  • Aircraft
  • Unmanned Aerial Vehicles
  • Spacecraft

By Material:

  • Alloys
  • Special Metals

By Region:

  • North America
  • Europe
  • Asia Pacific
  • Latin America
  • Middle East and Africa

Table of Content

  1. Executive Summary
    • Global Market Outlook
    • Demand-side Trends
    • Supply-side Trends
    • Technology Roadmap Analysis
    • Analysis and Recommendations
  2. Market Overview
    • Market Coverage / Taxonomy
    • Market Definition / Scope / Limitations
  3. Market Background
    • Market Dynamics
      • Drivers
      • Restraints
      • Opportunity
      • Trends
    • Scenario Forecast
      • Demand in Optimistic Scenario
      • Demand in Likely Scenario
      • Demand in Conservative Scenario
    • Opportunity Map Analysis
    • Product Life Cycle Analysis
    • Supply Chain Analysis
      • Supply Side Participants and their Roles
        • Producers
        • Mid-Level Participants (Traders/ Agents/ Brokers)
        • Wholesalers and Distributors
      • Value Added and Value Created at Node in the Supply Chain
      • List of Raw Material Suppliers
      • List of Existing and Potential Buyer’s
    • Investment Feasibility Matrix
    • Value Chain Analysis
      • Profit Margin Analysis
      • Wholesalers and Distributors
      • Retailers
    • PESTLE and Porter’s Analysis
    • Regulatory Landscape
      • By Key Regions
      • By Key Countries
    • Regional Parent Market Outlook
    • Production and Consumption Statistics
    • Import and Export Statistics
  4. Global Market Analysis 2020 to 2024 and Forecast, 2025 to 2035
    • Historical Market Size Value (USD Billion) & Volume (Units) Analysis, 2020 to 2024
    • Current and Future Market Size Value (USD Billion) & Volume (Units) Projections, 2025 to 2035
      • Y-o-Y Growth Trend Analysis
      • Absolute $ Opportunity Analysis
  5. Global Market Pricing Analysis 2020 to 2024 and Forecast 2025 to 2035
  6. Global Market Analysis 2020 to 2024 and Forecast 2025 to 2035, By Application
    • Introduction / Key Findings
    • Historical Market Size Value (USD Billion) & Volume (Units) Analysis By Application, 2020 to 2024
    • Current and Future Market Size Value (USD Billion) & Volume (Units) Analysis and Forecast By Application, 2025 to 2035
      • Aircraft
      • Spacecraft
      • Unmanned Aerial Vehicles
    • Y-o-Y Growth Trend Analysis By Application, 2020 to 2024
    • Absolute $ Opportunity Analysis By Application, 2025 to 2035
  7. Global Market Analysis 2020 to 2024 and Forecast 2025 to 2035, By Material
    • Introduction / Key Findings
    • Historical Market Size Value (USD Billion) & Volume (Units) Analysis By Material, 2020 to 2024
    • Current and Future Market Size Value (USD Billion) & Volume (Units) Analysis and Forecast By Material, 2025 to 2035
      • Alloys
      • Special Metals
    • Y-o-Y Growth Trend Analysis By Material, 2020 to 2024
    • Absolute $ Opportunity Analysis By Material, 2025 to 2035
  8. Global Market Analysis 2020 to 2024 and Forecast 2025 to 2035, By Region
    • Introduction
    • Historical Market Size Value (USD Billion) & Volume (Units) Analysis By Region, 2020 to 2024
    • Current Market Size Value (USD Billion) & Volume (Units) Analysis and Forecast By Region, 2025 to 2035
      • North America
      • Latin America
      • Western Europe
      • Eastern Europe
      • East Asia
      • South Asia & Pacific
      • Middle East and Africa
    • Market Attractiveness Analysis By Region
  9. North America Market Analysis 2020 to 2024 and Forecast 2025 to 2035, By Country
    • Historical Market Size Value (USD Billion) & Volume (Units) Trend Analysis By Market Taxonomy, 2020 to 2024
    • Market Size Value (USD Billion) & Volume (Units) Forecast By Market Taxonomy, 2025 to 2035
      • By Country
        • U.S.
        • Canada
        • Mexico
      • By Application
      • By Material
    • Market Attractiveness Analysis
      • By Country
      • By Application
      • By Material
    • Key Takeaways
  10. Latin America Market Analysis 2020 to 2024 and Forecast 2025 to 2035, By Country
    • Historical Market Size Value (USD Billion) & Volume (Units) Trend Analysis By Market Taxonomy, 2020 to 2024
    • Market Size Value (USD Billion) & Volume (Units) Forecast By Market Taxonomy, 2025 to 2035
      • By Country
        • Brazil
        • Argentina
        • Rest of LATAM
      • By Application
      • By Material
    • Market Attractiveness Analysis
      • By Country
      • By Application
      • By Material
    • Key Takeaways
  11. Western Europe Market Analysis 2020 to 2024 and Forecast 2025 to 2035, By Country
    • Historical Market Size Value (USD Billion) & Volume (Units) Trend Analysis By Market Taxonomy, 2020 to 2024
    • Market Size Value (USD Billion) & Volume (Units) Forecast By Market Taxonomy, 2025 to 2035
      • By Country
        • Germany
        • Italy
        • France
        • UK
        • Spain
        • BENELUX
        • Nordic
        • Rest of W.Europe
      • By Application
      • By Material
    • Market Attractiveness Analysis
      • By Country
      • By Application
      • By Material
    • Key Takeaways
  12. Eastern Europe Market Analysis 2020 to 2024 and Forecast 2025 to 2035, By Country
    • Historical Market Size Value (USD Billion) & Volume (Units) Trend Analysis By Market Taxonomy, 2020 to 2024
    • Market Size Value (USD Billion) & Volume (Units) Forecast By Market Taxonomy, 2025 to 2035
      • By Country
        • Russia
        • Hungary
        • Poland
        • Balkan & Baltics
        • Rest of E. Europe
      • By Application
      • By Material
    • Market Attractiveness Analysis
      • By Country
      • By Application
      • By Material
    • Key Takeaways
  13. East Asia Market Analysis 2020 to 2024 and Forecast 2025 to 2035, By Country
    • Historical Market Size Value (USD Billion) & Volume (Units) Trend Analysis By Market Taxonomy, 2020 to 2024
    • Market Size Value (USD Billion) & Volume (Units) Forecast By Market Taxonomy, 2025 to 2035
      • By Country
        • China
        • Japan
        • South Korea
      • By Application
      • By Material
    • Market Attractiveness Analysis
      • By Country
      • By Application
      • By Material
    • Key Takeaways
  14. South Asia & Pacific Market Analysis 2020 to 2024 and Forecast 2025 to 2035, By Country
    • Historical Market Size Value (USD Billion) & Volume (Units) Trend Analysis By Market Taxonomy, 2020 to 2024
    • Market Size Value (USD Billion) & Volume (Units) Forecast By Market Taxonomy, 2025 to 2035
      • By Country
        • India
        • Australia & New Zealand
        • ASEAN
        • Rest of SAP
      • By Application
      • By Material
    • Market Attractiveness Analysis
      • By Country
      • By Application
      • By Material
    • Key Takeaways
  15. Middle East and Africa Market Analysis 2020 to 2024 and Forecast 2025 to 2035, By Country
    • Historical Market Size Value (USD Billion) & Volume (Units) Trend Analysis By Market Taxonomy, 2020 to 2024
    • Market Size Value (USD Billion) & Volume (Units) Forecast By Market Taxonomy, 2025 to 2035
      • By Country
        • GCC Countries
        • Northern Africa
        • South Africa
        • Turkiye
        • Rest of MEA
      • By Application
      • By Material
    • Market Attractiveness Analysis
      • By Country
      • By Application
      • By Material
    • Key Takeaways
  16. Key Countries Market Analysis
    • U.S.
      • Pricing Analysis
      • Market Share Analysis, 2024
        • By Application
        • By Material
    • Canada
      • Pricing Analysis
      • Market Share Analysis, 2024
        • By Application
        • By Material
    • Brazil
      • Pricing Analysis
      • Market Share Analysis, 2024
        • By Application
        • By Material
    • Mexico
      • Pricing Analysis
      • Market Share Analysis, 2024
        • By Application
        • By Material
    • Argentina
      • Pricing Analysis
      • Market Share Analysis, 2024
        • By Application
        • By Material
  17. Market Structure Analysis
    • Competition Dashboard
    • Competition Benchmarking
    • Market Share Analysis of Top Players
      • By Regional
      • By Application
      • By Material
  18. Competition Analysis
    • Competition Deep Dive
      • The Boeing Company
        • Overview
        • Product Portfolio
        • Profitability by Market Segments (Product/Age /Sales Channel/Region)
        • Sales Footprint
        • Strategy Overview
          • Marketing Strategy
          • Product Strategy
          • Channel Strategy
      • Airbus SE
        • Overview
        • Product Portfolio
        • Profitability by Market Segments (Product/Age /Sales Channel/Region)
        • Sales Footprint
        • Strategy Overview
          • Marketing Strategy
          • Product Strategy
          • Channel Strategy
      • Honeywell International Inc.
        • Overview
        • Product Portfolio
        • Profitability by Market Segments (Product/Age /Sales Channel/Region)
        • Sales Footprint
        • Strategy Overview
          • Marketing Strategy
          • Product Strategy
          • Channel Strategy
      • Safran SA
        • Overview
        • Product Portfolio
        • Profitability by Market Segments (Product/Age /Sales Channel/Region)
        • Sales Footprint
        • Strategy Overview
          • Marketing Strategy
          • Product Strategy
          • Channel Strategy
      • Raytheon Technologies Corporation
        • Overview
        • Product Portfolio
        • Profitability by Market Segments (Product/Age /Sales Channel/Region)
        • Sales Footprint
        • Strategy Overview
          • Marketing Strategy
          • Product Strategy
          • Channel Strategy
      • Aerojet Rocketdyne Holdings Inc.
        • Overview
        • Product Portfolio
        • Profitability by Market Segments (Product/Age /Sales Channel/Region)
        • Sales Footprint
        • Strategy Overview
          • Marketing Strategy
          • Product Strategy
          • Channel Strategy
      • MTU Aero Engines AG
        • Overview
        • Product Portfolio
        • Profitability by Market Segments (Product/Age /Sales Channel/Region)
        • Sales Footprint
        • Strategy Overview
          • Marketing Strategy
          • Product Strategy
          • Channel Strategy
      • American Additive Manufacturing LLC
        • Overview
        • Product Portfolio
        • Profitability by Market Segments (Product/Age /Sales Channel/Region)
        • Sales Footprint
        • Strategy Overview
          • Marketing Strategy
          • Product Strategy
          • Channel Strategy
      • Samuel, Son & Co.
        • Overview
        • Product Portfolio
        • Profitability by Market Segments (Product/Age /Sales Channel/Region)
        • Sales Footprint
        • Strategy Overview
          • Marketing Strategy
          • Product Strategy
          • Channel Strategy
  19. Assumptions & Acronyms Used
  20. Research Methodology

List of Tables

  • Table 1: Global Market Value (USD Billion) Forecast by Region, 2020-2035
  • Table 2: Global Market Volume (Units) Forecast by Region, 2020-2035
  • Table 3: Global Market Value (USD Billion) Forecast by Application, 2020-2035
  • Table 4: Global Market Volume (Units) Forecast by Application, 2020-2035
  • Table 5: Global Market Value (USD Billion) Forecast by Material, 2020-2035
  • Table 6: Global Market Volume (Units) Forecast by Material, 2020-2035
  • Table 7: North America Market Value (USD Billion) Forecast by Country, 2020-2035
  • Table 8: North America Market Volume (Units) Forecast by Country, 2020-2035
  • Table 9: North America Market Value (USD Billion) Forecast by Application, 2020-2035
  • Table 10: North America Market Volume (Units) Forecast by Application, 2020-2035
  • Table 11: North America Market Value (USD Billion) Forecast by Material, 2020-2035
  • Table 12: North America Market Volume (Units) Forecast by Material, 2020-2035
  • Table 13: Latin America Market Value (USD Billion) Forecast by Country, 2020-2035
  • Table 14: Latin America Market Volume (Units) Forecast by Country, 2020-2035
  • Table 15: Latin America Market Value (USD Billion) Forecast by Application, 2020-2035
  • Table 16: Latin America Market Volume (Units) Forecast by Application, 2020-2035
  • Table 17: Latin America Market Value (USD Billion) Forecast by Material, 2020-2035
  • Table 18: Latin America Market Volume (Units) Forecast by Material, 2020-2035
  • Table 19: Western Europe Market Value (USD Billion) Forecast by Country, 2020-2035
  • Table 20: Western Europe Market Volume (Units) Forecast by Country, 2020-2035
  • Table 21: Western Europe Market Value (USD Billion) Forecast by Application, 2020-2035
  • Table 22: Western Europe Market Volume (Units) Forecast by Application, 2020-2035
  • Table 23: Western Europe Market Value (USD Billion) Forecast by Material, 2020-2035
  • Table 24: Western Europe Market Volume (Units) Forecast by Material, 2020-2035
  • Table 25: Eastern Europe Market Value (USD Billion) Forecast by Country, 2020-2035
  • Table 26: Eastern Europe Market Volume (Units) Forecast by Country, 2020-2035
  • Table 27: Eastern Europe Market Value (USD Billion) Forecast by Application, 2020-2035
  • Table 28: Eastern Europe Market Volume (Units) Forecast by Application, 2020-2035
  • Table 29: Eastern Europe Market Value (USD Billion) Forecast by Material, 2020-2035
  • Table 30: Eastern Europe Market Volume (Units) Forecast by Material, 2020-2035
  • Table 31: East Asia Market Value (USD Billion) Forecast by Country, 2020-2035
  • Table 32: East Asia Market Volume (Units) Forecast by Country, 2020-2035
  • Table 33: East Asia Market Value (USD Billion) Forecast by Application, 2020-2035
  • Table 34: East Asia Market Volume (Units) Forecast by Application, 2020-2035
  • Table 35: East Asia Market Value (USD Billion) Forecast by Material, 2020-2035
  • Table 36: East Asia Market Volume (Units) Forecast by Material, 2020-2035
  • Table 37: South Asia & Pacific Market Value (USD Billion) Forecast by Country, 2020-2035
  • Table 38: South Asia & Pacific Market Volume (Units) Forecast by Country, 2020-2035
  • Table 39: South Asia & Pacific Market Value (USD Billion) Forecast by Application, 2020-2035
  • Table 40: South Asia & Pacific Market Volume (Units) Forecast by Application, 2020-2035
  • Table 41: South Asia & Pacific Market Value (USD Billion) Forecast by Material, 2020-2035
  • Table 42: South Asia & Pacific Market Volume (Units) Forecast by Material, 2020-2035
  • Table 43: Middle East and Africa Market Value (USD Billion) Forecast by Country, 2020-2035
  • Table 44: Middle East and Africa Market Volume (Units) Forecast by Country, 2020-2035
  • Table 45: Middle East and Africa Market Value (USD Billion) Forecast by Application, 2020-2035
  • Table 46: Middle East and Africa Market Volume (Units) Forecast by Application, 2020-2035
  • Table 47: Middle East and Africa Market Value (USD Billion) Forecast by Material, 2020-2035
  • Table 48: Middle East and Africa Market Volume (Units) Forecast by Material, 2020-2035

List of Figures

  • Figure 1: Global Market Volume (Units) Forecast 2020–2035
  • Figure 2: Global Market Pricing Analysis
  • Figure 3: Global Market Value (USD Billion) Forecast 2020–2035
  • Figure 4: Global Market Value Share and BPS Analysis by Application, 2025 and 2035
  • Figure 5: Global Market Y-o-Y Growth Comparison by Application, 2025–2035
  • Figure 6: Global Market Attractiveness Analysis by Application
  • Figure 7: Global Market Value Share and BPS Analysis by Material, 2025 and 2035
  • Figure 8: Global Market Y-o-Y Growth Comparison by Material, 2025–2035
  • Figure 9: Global Market Attractiveness Analysis by Material
  • Figure 10: Global Market Value (USD Billion) Share and BPS Analysis by Region, 2025 and 2035
  • Figure 11: Global Market Y-o-Y Growth Comparison by Region, 2025–2035
  • Figure 12: Global Market Attractiveness Analysis by Region
  • Figure 13: North America Market Incremental $ Opportunity, 2025–2035
  • Figure 14: Latin America Market Incremental $ Opportunity, 2025–2035
  • Figure 15: Western Europe Market Incremental $ Opportunity, 2025–2035
  • Figure 16: Eastern Europe Market Incremental $ Opportunity, 2025–2035
  • Figure 17: East Asia Market Incremental $ Opportunity, 2025–2035
  • Figure 18: South Asia & Pacific Market Incremental $ Opportunity, 2025–2035
  • Figure 19: Middle East and Africa Market Incremental $ Opportunity, 2025–2035
  • Figure 20: North America Market Value Share and BPS Analysis by Country, 2025 and 2035
  • Figure 21: North America Market Value Share and BPS Analysis by Application, 2025 and 2035
  • Figure 22: North America Market Y-o-Y Growth Comparison by Application, 2025–2035
  • Figure 23: North America Market Attractiveness Analysis by Application
  • Figure 24: North America Market Value Share and BPS Analysis by Material, 2025 and 2035
  • Figure 25: North America Market Y-o-Y Growth Comparison by Material, 2025–2035
  • Figure 26: North America Market Attractiveness Analysis by Material
  • Figure 27: Latin America Market Value Share and BPS Analysis by Country, 2025 and 2035
  • Figure 28: Latin America Market Value Share and BPS Analysis by Application, 2025 and 2035
  • Figure 29: Latin America Market Y-o-Y Growth Comparison by Application, 2025–2035
  • Figure 30: Latin America Market Attractiveness Analysis by Application
  • Figure 31: Latin America Market Value Share and BPS Analysis by Material, 2025 and 2035
  • Figure 32: Latin America Market Y-o-Y Growth Comparison by Material, 2025–2035
  • Figure 33: Latin America Market Attractiveness Analysis by Material
  • Figure 34: Western Europe Market Value Share and BPS Analysis by Country, 2025 and 2035
  • Figure 35: Western Europe Market Value Share and BPS Analysis by Application, 2025 and 2035
  • Figure 36: Western Europe Market Y-o-Y Growth Comparison by Application, 2025–2035
  • Figure 37: Western Europe Market Attractiveness Analysis by Application
  • Figure 38: Western Europe Market Value Share and BPS Analysis by Material, 2025 and 2035
  • Figure 39: Western Europe Market Y-o-Y Growth Comparison by Material, 2025–2035
  • Figure 40: Western Europe Market Attractiveness Analysis by Material
  • Figure 41: Eastern Europe Market Value Share and BPS Analysis by Country, 2025 and 2035
  • Figure 42: Eastern Europe Market Value Share and BPS Analysis by Application, 2025 and 2035
  • Figure 43: Eastern Europe Market Y-o-Y Growth Comparison by Application, 2025–2035
  • Figure 44: Eastern Europe Market Attractiveness Analysis by Application
  • Figure 45: Eastern Europe Market Value Share and BPS Analysis by Material, 2025 and 2035
  • Figure 46: Eastern Europe Market Y-o-Y Growth Comparison by Material, 2025–2035
  • Figure 47: Eastern Europe Market Attractiveness Analysis by Material
  • Figure 48: East Asia Market Value Share and BPS Analysis by Country, 2025 and 2035
  • Figure 49: East Asia Market Value Share and BPS Analysis by Application, 2025 and 2035
  • Figure 50: East Asia Market Y-o-Y Growth Comparison by Application, 2025–2035
  • Figure 51: East Asia Market Attractiveness Analysis by Application
  • Figure 52: East Asia Market Value Share and BPS Analysis by Material, 2025 and 2035
  • Figure 53: East Asia Market Y-o-Y Growth Comparison by Material, 2025–2035
  • Figure 54: East Asia Market Attractiveness Analysis by Material
  • Figure 55: South Asia & Pacific Market Value Share and BPS Analysis by Country, 2025 and 2035
  • Figure 56: South Asia & Pacific Market Value Share and BPS Analysis by Application, 2025 and 2035
  • Figure 57: South Asia & Pacific Market Y-o-Y Growth Comparison by Application, 2025–2035
  • Figure 58: South Asia & Pacific Market Attractiveness Analysis by Application
  • Figure 59: South Asia & Pacific Market Value Share and BPS Analysis by Material, 2025 and 2035
  • Figure 60: South Asia & Pacific Market Y-o-Y Growth Comparison by Material, 2025–2035
  • Figure 61: South Asia & Pacific Market Attractiveness Analysis by Material
  • Figure 62: Middle East and Africa Market Value Share and BPS Analysis by Country, 2025 and 2035
  • Figure 63: Middle East and Africa Market Value Share and BPS Analysis by Application, 2025 and 2035
  • Figure 64: Middle East and Africa Market Y-o-Y Growth Comparison by Application, 2025–2035
  • Figure 65: Middle East and Africa Market Attractiveness Analysis by Application
  • Figure 66: Middle East and Africa Market Value Share and BPS Analysis by Material, 2025 and 2035
  • Figure 67: Middle East and Africa Market Y-o-Y Growth Comparison by Material, 2025–2035
  • Figure 68: Middle East and Africa Market Attractiveness Analysis by Material
  • Figure 69: Global Market – Tier Structure Analysis
  • Figure 70: Global Market – Company Share Analysis

Frequently Asked Questions

What is the projected 3D printing in aerospace and defense market size by 2035?

The market is expected to reach nearly USD 36.7 billion by 2035.

What is the CAGR of the 3D printing in aerospace and defense market from 2025 to 2035?

The market is growing at a CAGR of 26.5% during this period.

Which application segment holds the largest market share in 2025?

Aircraft dominates with 60% market share in 2025.

Which material type accounts for the largest share in the 3Dprinting in aerospace and defense market in 2025?

Alloys hold the largest share with 65% in 2025.

Which company leads the 3D Printing in aerospace and defense market by industry share?

GE Aviation leads with 25% industry share.

Explore Similar Insights

Future Market Insights

3D Printing in Aerospace and Defense Market

Chat With

MaRIA

Hi There, I am MaRIA, Your Market Research Intelligence Assistant. How may I help you?