Reports

- Global Locations -

Headquarters

Future Market Insights, Inc.

Christiana Corporate, 200
Continental Drive, Suite 401,
Newark, Delaware - 19713,
United States

T: +1-845-579-5705

Americas

Future Market Insights, Inc.

616 Corporate Way, Suite 2-9018,
Valley Cottage, NY 10989, United States

T: +1-347-918-3531

MEA

Future Market Insights

1602-6 Jumeirah Bay X2 Tower, Plot No: JLT-PH2-X2A,
Jumeirah Lakes Towers, Dubai,
United Arab Emirates

Europe

Future Market Insights

3rd Floor, 207 Regent Street,
W1B 3HH London
United Kingdom

T: + 44 (0) 20 8123 9659
D: +44 (0) 20 3287 4268

Asia Pacific

Future Market Insights

IndiaLand Global Tech Park, Unit UG-1, Behind Grand HighStreet, Phase 1, Hinjawadi, MH, Pune – 411057, India

3D Audio Market Outlook (2023 to 2033)

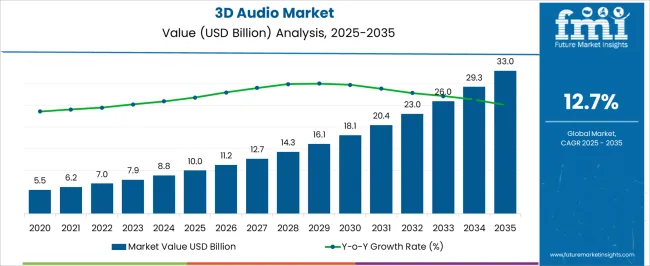
The global 3D audio market is poised to surpass US$ 7.77 billion by 2023, surging at a remarkable CAGR of 13.3% through 2033 to reach US$ 14.75 billion.

The 3D audio industry has been experiencing significant growth in recent years, driven by advancements in technology and the rising demand for immersive audio experiences.

Consumers are seeking more immersive and realistic audio experiences, driving the demand for 3D audio in various applications such as gaming, movies, and music. The ability to create a sense of presence and transport listeners into virtual worlds is also a significant driving factor.

Attributes Details
3D Audio Market Size (2023) US$ 7.77 billion
3D Audio Market Projected Size (2033) US$ 14.75 billion
3D Audio Market Value-based CAGR (2023 to 2033) 13.3%

In recent years, the market has witnessed significant growth, and it is projected to continue expanding in the coming years. The demand for immersive audio experiences is surging as consumers seek more realistic and captivating content.

Don't pay for what you don't need

Customize your report by selecting specific countries or regions and save 30%!

Revenue of 3D Audio from 2018 to 2022 Compared to Demand Outlook for 2023 to 2033

As per the 3D audio industry research by Future Market Insights - historically, from 2018 to 2022, the market value of the 3D Audio industry increased at around 3.5% CAGR. Wherein, countries such as the United States of America, Germany, Japan, and Australia held a significant share of the global market.

The evolution of the market for 3D audio is largely dependent on parameters such as up-gradation in consumers’ requirements for audio products and accessories. Moreover, investments in research and development towards refinement of audio hardware and controls, and an increase in several applications.

3D audio products have a wide range of applications including automobiles, media, and entertainment, gaming among others. These are constantly multiplying over time, catering to the expansion of the 3D audio market size.

Exponential growth is evident in 3D audio technology, as companies are investing in research and development to provide a next-generation audio experience which leads to broader technological advancement in 3D audio. These factors are projected to accelerate the demand for the market during the year 2023 to 2033 with a projected CAGR of 13.3%.

The 3D Audio market has reached a valuation of US$ 6.83 billion in 2022. Future Market Insights estimates that 3D Audio revenue grows more than double from 2023 to 2033, reaching nearly US$ 14.75 billion in 2033.

What Key Elements are Fuelling the Expansion of the 3D Audio Industry?

  • Widely popular in the gaming industry, offering an enhanced user experience.
  • Adoption and progression of virtual reality (VR) and augmented reality (AR) in the gaming and entertainment industry driving 3D audio industry growth.
  • An increase in middle-class population expenses and post-pandemic upgrades in living standards contributed to market expansion.
  • The adoption of audio-augmented reality in the military and aviation sectors creates opportunities for the 3D audio market.
  • HRTF (Head-Related Transfer Function) technology is a breakthrough in capturing sound limitations based on an individual's head, face, and pinna geometry.
  • Increased accessibility of audio technology in offices, entertainment, and travel leads to higher demand for HRTF-enabled headphones and drives the 3D audio market growth.
Sudip Saha
Sudip Saha

Principal Consultant

Talk to Analyst

Find your sweet spots for generating winning opportunities in this market.

How the Hardware Enhancements in 3D Audio are Likely to be the Next Game Changer?

  • Providers of audio systems and accessories aim to offer an enhanced user experience.
  • Emphasis on assembling the best available hardware technologies for sound capture and reproduction.
  • Use of terms and buzzwords like ‘8D audio’ to attract consumers, although it tricks the brain into a greater spatial feeling.
  • Focus on continuous innovation and improvement in audio system technologies to meet user expectations and demands.
  • Integration of advanced sound processing algorithms to enhance the spatial audio experience.
  • Collaboration with content creators and artists to produce immersive audio content specifically designed for 3D audio systems.
  • Leveraging marketing strategies to create awareness and educate consumers about the benefits and features of 3D audio technology.
  • Continuous research and development efforts to further advance the capabilities of 3D audio systems and accessories.

How is the Evolution of 3D Audio in Film and Media Boosting the Overall Market?

  • 3D audio gaining significant traction in the film and media industry.
  • Evolution of 3D audio technologies contributing to the growth of the 3D audio industry.
  • Distributed computing arrangements in the media and entertainment industry expand the scope for 3D audio.
  • Adoption of 3D-enabled MPEG-H format for tracking on-screen movement in media and entertainment applications.
  • Use of 3D audio in movies like The Matrix and The Lord of the Rings to enhance the audio experience.
  • Increasing demand for immersive audio in film and media driving the growth of the 3D audio market.
  • Collaborations between audio technology providers and content creators in the film and media industry to create captivating audio experiences.
  • Incorporation of spatial audio techniques to enhance storytelling and audience engagement in films and media content.
  • Rising consumer expectations for high-quality audio experiences in movies and media content fueling the demand for 3D audio technologies.

Get the data you need at a Fraction of the cost

Personalize your report by choosing insights you need
and save 40%!

Comparative View of the Market

3D Audio Market:

Attributes 3D Audio Market
CAGR (2023 to 2033) 13.3%
Market Value (2033) US$ 14.75 billion
Opportunity Integration of 3D audio technology in the automotive industry, enhancing the in-car audio experience, safety, and entertainment for passengers in electric and autonomous vehicles.
Key Trends Rising adoption of spatial audio in virtual and augmented reality applications, providing immersive and realistic sound experiences.

Home Audio Equipment Market:

Attributes Home Audio Equipment Market
CAGR (2023 to 2033) 11.8%
Market Value (2033) US$100.5 billion
Opportunity The introduction of realistic immersive home audio technology presents significant opportunities for the home audio equipment business.
Key Trends increasing demand for wireless and multi-room audio systems. Consumers are seeking convenience and flexibility in their audio setups, with a focus on seamless connectivity and the ability to stream music in multiple rooms.

Audio Conferencing Services Market:

Attributes Audio Conferencing Services Market
CAGR (2023 to 2033) 4.6%
Market Value (2033) US$ 36.5 billion
Opportunity With the rise of remote work and global connectivity, businesses are increasingly relying on audio conferencing services to facilitate communication and collaboration among distributed teams, presenting an opportunity for audio conferencing service providers.
Key Trends One key trend in the audio conferencing services market is the increasing adoption of cloud-based solutions for flexible and scalable conferencing capabilities.

Country-wise Analysis

Which Region is Projected to Offer a Legion of Opportunities for 3D Audio?

North America has a strong presence of prominent technology companies, content creators, and audio equipment manufacturers who are actively investing in and developing 3D audio technologies. This concentration of industry players fosters innovation and drives the growth of the market.

As per FMI, the market for 3D audio in North America accounted for about 30.4% of the value share on a global level in 2022.

The region also has high consumer demand for immersive audio experiences, particularly in sectors such as gaming, virtual reality (VR), and entertainment. North American consumers are early adopters of new technologies and are willing to invest in premium audio equipment and content. Creating a favorable market environment for 3D audio solutions.

Which Country Topped the Revenue Generation for the 3D Audio Market?

The United States of America has emerged as a leader in revenue generation in the 3D audio market due to its robust and dynamic technology industry. With numerous companies at the forefront of audio innovation, contributing to the region’s value share of 16.5% in 2022.

Companies in this country invest heavily in research and development to create state-of-the-art 3D audio solutions that cater to the growing demand for immersive audio experiences.

The United States also boasts a strong ecosystem of audio equipment manufacturers, software developers, and content creators. Contributing to the overall growth and success of the 3D audio market.

What are the Growth Prospects of the 3D Audio Industry in the Asia Pacific?

Asia Pacific is projected to enroll a decent CAGR in the 3D audio market during the forecast period owing to the expanded interest in 3D Audio in emerging countries. Particularly India and China, owing to growing expenditure among various consumers towards music.

The demand for 3D sound quality in the Asia Pacific is also on surge due to the gaming and media and entertainment industries. As they can show content more effectively to the consumer.

The market for 3D audio in India is anticipated to move forward at 14.4% CAGR from 2023 to 2033, following FMI research.

China has a prominent share in the gaming and media and entertainment industry facilitating its growth rate of 12.2% during the forecast period.

Significant investments are coming from various domestic players and venture capitalists for 3D audio technology in India and China. This is expected to accelerate the 3D audio industry in the Asia Pacific.

Category-wise Insights

What Factors Contribute to the Commercial Segment's Strong Revenue Generation in the 3D Audio Market?

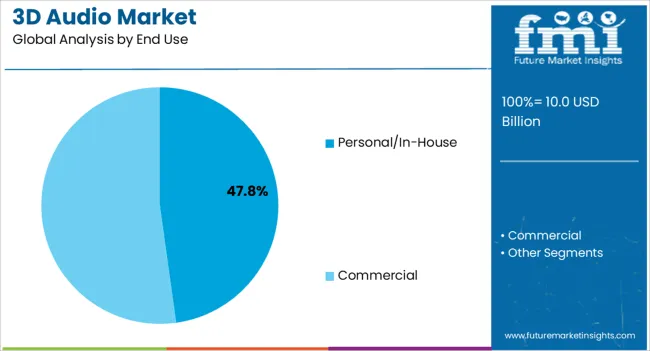
The commercial segment was predicted to capture a share of 62.2% in 2022 owing to developments in the market. Such as HRTF, noise cancellation, and implementation of sensors, which have led the market to trace a profitable path.

Deployment of 3D audio technology into automobiles, cinema, music, gaming, museum, VR concert, and gaming has increased the scope of the market more prominently. In the cinema, industry especially in the sound engineering division, 3D audio is being used to offer viewers an enhanced experience.

Exploration and development activities in the automobile sector regarding 3D audio are implemented. For the real environment experience while driving and to feel the natural sound within the car cabin 3D audio is actuated with the sensors.

The combination of 3D audio and sensors is playing a pivotal role in the automobile industry and may drive the sales of 3D audio-enabled music systems in the automobile industry.

Which Components Demonstrate Promising Potential for the 3D Audio Industry over the Forecast Period?

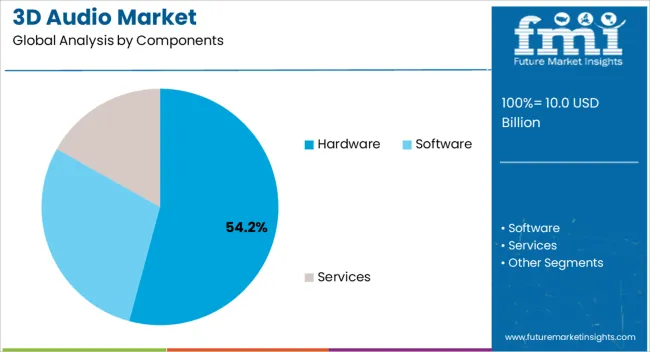
The hardware component is expected to be at the forefront of the market based on the component segment due to several factors. The hardware components play a crucial role in delivering an immersive and realistic 3D audio experience. This includes headphones, speakers, amplifiers, and sound bars, which are essential for capturing, processing, and spatially reproducing the audio.

Advancements in hardware technologies have significantly improved the capabilities of these components, offering higher sound quality, improved spatialization, and enhanced user experience fostering the sub-segment share of 45.2% in 2022 on a global level.

What is the Competitive Analysis of the 3D Audio Industry?

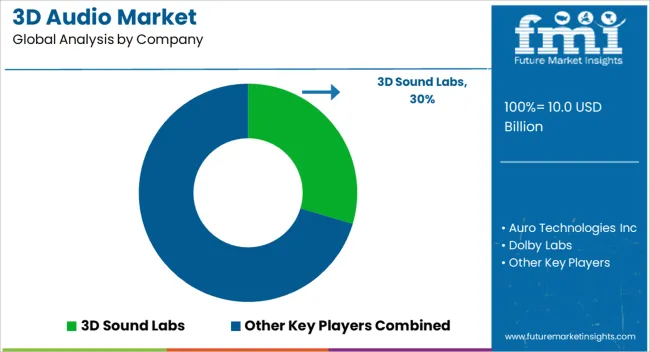
The competition in the market for 3D audio is intense, with several key players vying for market share and striving to differentiate themselves through innovative solutions and technologies.

The market is witnessing a growth in companies entering the space, both established players and new entrants, further intensifying the competition. These players compete on various factors such as product offerings, technological advancements, pricing strategies, distribution channels, and customer relationships.

Key Players:

  • 3D Sound Labs
  • Auro Technologies Inc
  • Dolby Labs
  • Hooke Audio
  • dearVR
  • Fraunhofer
  • Sennheiser electronic GmbH & Co.
  • VisiSonics Corporation
  • Google
  • Waves Audio Ltd.

Some Recent Developments:

  • In Mar 2022, Sennheiser announced that it may focus on its proficient sound business. They plan to grow their portfolio in the master sound unit and business correspondence unit.
  • In February 2022, Dolby Laboratories procured Millicast, a designer stage giving ultra-low video web-based abilities at a scale to an enormous crowd.
  • In February 2022, Dear Reality released the latest monitoring plugin dearRV MIX which suits all professional studio headphones. This is expected to strengthen the technological perspective of the company.
  • In Dec 2021, VisiSonics partnered with the University of Maryland to pioneer 3D audiogram technology. They have a wide range of applications in gaming and military headsets.

Market Segments Covered in 3D Audio Industry Analysis

By Components:

  • Hardware
    • Loud Speaker
    • Headphones
    • Microphones/Mic
    • Soundbars
    • Others
  • Software
  • Services

By End Use:

  • Personal/in-house
    • Mobile Devices
    • Home Theater
    • Gaming
  • Commercial
    • Automobile
    • Cinema
    • Music
    • Gaming
    • Museum
    • VR Concerts
    • Others

By Region:

  • North America
  • Europe
  • Asia Pacific
  • The Middle East and Africa (MEA)
  • South America

Frequently Asked Questions

Which countries dominate the global 3D Audio Market?

The United States, Japan, and China dominate the global 3D audio market.

What is the growth forecast for the 3D Audio Market?

The 3D audio market is forecast to register a CAGR of 13.3% through 2033.

How is the historical performance of the Market?

During 2018 to 2022, the market grew at a CAGR of 9.8%.

Which is the top trend in the 3D Audio Market?

Technological advancement disrupts the current market trends, such as the development of new 3D audio technologies and the increasing adoption of 3D audio devices.

What is the projected size of the market by 2033?

The global market size of 3D audio to reach US$ 14.75 billion by 2033.

Table of Content

1. Executive Summary

    1.1. Global Market Outlook

    1.2. Demand-side Trends

    1.3. Supply-side Trends

    1.4. Technology Roadmap Analysis

    1.5. Analysis and Recommendations

2. Market Overview

    2.1. Market Coverage / Taxonomy

    2.2. Market Definition / Scope / Limitations

3. Market Background

    3.1. Market Dynamics

        3.1.1. Drivers

        3.1.2. Restraints

        3.1.3. Opportunity

        3.1.4. Trends

    3.2. Scenario Forecast

        3.2.1. Demand in Optimistic Scenario

        3.2.2. Demand in Likely Scenario

        3.2.3. Demand in Conservative Scenario

    3.3. Opportunity Map Analysis

    3.4. Product Life Cycle Analysis

    3.5. Supply Chain Analysis

        3.5.1. Supply Side Participants and their Roles

            3.5.1.1. Producers

            3.5.1.2. Mid-Level Participants (Traders/ Agents/ Brokers)

            3.5.1.3. Wholesalers and Distributors

        3.5.2. Value Added and Value Created at Node in the Supply Chain

        3.5.3. List of Raw Material Suppliers

        3.5.4. List of Existing and Potential Buyer’s

    3.6. Investment Feasibility Matrix

    3.7. Value Chain Analysis

        3.7.1. Profit Margin Analysis

        3.7.2. Wholesalers and Distributors

        3.7.3. Retailers

    3.8. PESTLE and Porter’s Analysis

    3.9. Regulatory Landscape

        3.9.1. By Key Regions

        3.9.2. By Key Countries

    3.10. Regional Parent Market Outlook

    3.11. Production and Consumption Statistics

    3.12. Import and Export Statistics

4. Global Market Analysis 2018 to 2022 and Forecast, 2023 to 2033

    4.1. Historical Market Size Value (US$ Million) & Volume (Units) Analysis, 2018 to 2022

    4.2. Current and Future Market Size Value (US$ Million) & Volume (Units) Projections, 2023 to 2033

        4.2.1. Y-o-Y Growth Trend Analysis

        4.2.2. Absolute $ Opportunity Analysis

5. Global Market Analysis 2018 to 2022 and Forecast 2023 to 2033, By Components

    5.1. Introduction / Key Findings

    5.2. Historical Market Size Value (US$ Million) & Volume (Units) Analysis By Components, 2018 to 2022

    5.3. Current and Future Market Size Value (US$ Million) & Volume (Units) Analysis and Forecast By Components, 2023 to 2033

        5.3.1. Hardware

            5.3.1.1. Loud Speaker

            5.3.1.2. Headphones

            5.3.1.3. Microphones/Mic

            5.3.1.4. Soundbars

            5.3.1.5. Others

        5.3.2. Software

        5.3.3. Services

    5.4. Y-o-Y Growth Trend Analysis By Components, 2018 to 2022

    5.5. Absolute $ Opportunity Analysis By Components, 2023 to 2033

6. Global Market Analysis 2018 to 2022 and Forecast 2023 to 2033, By End-use

    6.1. Introduction / Key Findings

    6.2. Historical Market Size Value (US$ Million) & Volume (Units) Analysis By End-use, 2018 to 2022

    6.3. Current and Future Market Size Value (US$ Million) & Volume (Units) Analysis and Forecast By End-use, 2023 to 2033

        6.3.1. Personal/in-house

            6.3.1.1. Mobile Devices

            6.3.1.2. Home Theater

            6.3.1.3. Gaming

        6.3.2. Commercial

            6.3.2.1. Automobile

            6.3.2.2. Cinema

            6.3.2.3. Music

            6.3.2.4. Gaming

            6.3.2.5. Museum

            6.3.2.6. VR Concerts

            6.3.2.7. Others

    6.4. Y-o-Y Growth Trend Analysis By End-use, 2018 to 2022

    6.5. Absolute $ Opportunity Analysis By End-use, 2023 to 2033

7. Global Market Analysis 2018 to 2022 and Forecast 2023 to 2033, By Region

    7.1. Introduction

    7.2. Historical Market Size Value (US$ Million) & Volume (Units) Analysis By Region, 2018 to 2022

    7.3. Current Market Size Value (US$ Million) & Volume (Units) Analysis and Forecast By Region, 2023 to 2033

        7.3.1. North America

        7.3.2. Latin America

        7.3.3. Europe

        7.3.4. Asia Pacific

        7.3.5. MEA

    7.4. Market Attractiveness Analysis By Region

8. North America Market Analysis 2018 to 2022 and Forecast 2023 to 2033, By Country

    8.1. Historical Market Size Value (US$ Million) & Volume (Units) Trend Analysis By Market Taxonomy, 2018 to 2022

    8.2. Market Size Value (US$ Million) & Volume (Units) Forecast By Market Taxonomy, 2023 to 2033

        8.2.1. By Country

            8.2.1.1. The USA

            8.2.1.2. Canada

        8.2.2. By Components

        8.2.3. By End-use

    8.3. Market Attractiveness Analysis

        8.3.1. By Country

        8.3.2. By Components

        8.3.3. By End-use

    8.4. Key Takeaways

9. Latin America Market Analysis 2018 to 2022 and Forecast 2023 to 2033, By Country

    9.1. Historical Market Size Value (US$ Million) & Volume (Units) Trend Analysis By Market Taxonomy, 2018 to 2022

    9.2. Market Size Value (US$ Million) & Volume (Units) Forecast By Market Taxonomy, 2023 to 2033

        9.2.1. By Country

            9.2.1.1. Brazil

            9.2.1.2. Mexico

            9.2.1.3. Rest of Latin America

        9.2.2. By Components

        9.2.3. By End-use

    9.3. Market Attractiveness Analysis

        9.3.1. By Country

        9.3.2. By Components

        9.3.3. By End-use

    9.4. Key Takeaways

10. Europe Market Analysis 2018 to 2022 and Forecast 2023 to 2033, By Country

    10.1. Historical Market Size Value (US$ Million) & Volume (Units) Trend Analysis By Market Taxonomy, 2018 to 2022

    10.2. Market Size Value (US$ Million) & Volume (Units) Forecast By Market Taxonomy, 2023 to 2033

        10.2.1. By Country

            10.2.1.1. Germany

            10.2.1.2. United Kingdom

            10.2.1.3. France

            10.2.1.4. Spain

            10.2.1.5. Italy

            10.2.1.6. Rest of Europe

        10.2.2. By Components

        10.2.3. By End-use

    10.3. Market Attractiveness Analysis

        10.3.1. By Country

        10.3.2. By Components

        10.3.3. By End-use

    10.4. Key Takeaways

11. Asia Pacific Market Analysis 2018 to 2022 and Forecast 2023 to 2033, By Country

    11.1. Historical Market Size Value (US$ Million) & Volume (Units) Trend Analysis By Market Taxonomy, 2018 to 2022

    11.2. Market Size Value (US$ Million) & Volume (Units) Forecast By Market Taxonomy, 2023 to 2033

        11.2.1. By Country

            11.2.1.1. China

            11.2.1.2. Japan

            11.2.1.3. South Korea

            11.2.1.4. Singapore

            11.2.1.5. Thailand

            11.2.1.6. Indonesia

            11.2.1.7. Australia

            11.2.1.8. New Zealand

            11.2.1.9. Rest of Asia Pacific

        11.2.2. By Components

        11.2.3. By End-use

    11.3. Market Attractiveness Analysis

        11.3.1. By Country

        11.3.2. By Components

        11.3.3. By End-use

    11.4. Key Takeaways

12. MEA Market Analysis 2018 to 2022 and Forecast 2023 to 2033, By Country

    12.1. Historical Market Size Value (US$ Million) & Volume (Units) Trend Analysis By Market Taxonomy, 2018 to 2022

    12.2. Market Size Value (US$ Million) & Volume (Units) Forecast By Market Taxonomy, 2023 to 2033

        12.2.1. By Country

            12.2.1.1. GCC Countries

            12.2.1.2. South Africa

            12.2.1.3. Israel

            12.2.1.4. Rest of MEA

        12.2.2. By Components

        12.2.3. By End-use

    12.3. Market Attractiveness Analysis

        12.3.1. By Country

        12.3.2. By Components

        12.3.3. By End-use

    12.4. Key Takeaways

13. Key Countries Market Analysis

    13.1. USA

        13.1.1. Pricing Analysis

        13.1.2. Market Share Analysis, 2022

            13.1.2.1. By Components

            13.1.2.2. By End-use

    13.2. Canada

        13.2.1. Pricing Analysis

        13.2.2. Market Share Analysis, 2022

            13.2.2.1. By Components

            13.2.2.2. By End-use

    13.3. Brazil

        13.3.1. Pricing Analysis

        13.3.2. Market Share Analysis, 2022

            13.3.2.1. By Components

            13.3.2.2. By End-use

    13.4. Mexico

        13.4.1. Pricing Analysis

        13.4.2. Market Share Analysis, 2022

            13.4.2.1. By Components

            13.4.2.2. By End-use

    13.5. Germany

        13.5.1. Pricing Analysis

        13.5.2. Market Share Analysis, 2022

            13.5.2.1. By Components

            13.5.2.2. By End-use

    13.6. United Kingdom

        13.6.1. Pricing Analysis

        13.6.2. Market Share Analysis, 2022

            13.6.2.1. By Components

            13.6.2.2. By End-use

    13.7. France

        13.7.1. Pricing Analysis

        13.7.2. Market Share Analysis, 2022

            13.7.2.1. By Components

            13.7.2.2. By End-use

    13.8. Spain

        13.8.1. Pricing Analysis

        13.8.2. Market Share Analysis, 2022

            13.8.2.1. By Components

            13.8.2.2. By End-use

    13.9. Italy

        13.9.1. Pricing Analysis

        13.9.2. Market Share Analysis, 2022

            13.9.2.1. By Components

            13.9.2.2. By End-use

    13.10. China

        13.10.1. Pricing Analysis

        13.10.2. Market Share Analysis, 2022

            13.10.2.1. By Components

            13.10.2.2. By End-use

    13.11. Japan

        13.11.1. Pricing Analysis

        13.11.2. Market Share Analysis, 2022

            13.11.2.1. By Components

            13.11.2.2. By End-use

    13.12. South Korea

        13.12.1. Pricing Analysis

        13.12.2. Market Share Analysis, 2022

            13.12.2.1. By Components

            13.12.2.2. By End-use

    13.13. Singapore

        13.13.1. Pricing Analysis

        13.13.2. Market Share Analysis, 2022

            13.13.2.1. By Components

            13.13.2.2. By End-use

    13.14. Thailand

        13.14.1. Pricing Analysis

        13.14.2. Market Share Analysis, 2022

            13.14.2.1. By Components

            13.14.2.2. By End-use

    13.15. Indonesia

        13.15.1. Pricing Analysis

        13.15.2. Market Share Analysis, 2022

            13.15.2.1. By Components

            13.15.2.2. By End-use

    13.16. Australia

        13.16.1. Pricing Analysis

        13.16.2. Market Share Analysis, 2022

            13.16.2.1. By Components

            13.16.2.2. By End-use

    13.17. New Zealand

        13.17.1. Pricing Analysis

        13.17.2. Market Share Analysis, 2022

            13.17.2.1. By Components

            13.17.2.2. By End-use

    13.18. GCC Countries

        13.18.1. Pricing Analysis

        13.18.2. Market Share Analysis, 2022

            13.18.2.1. By Components

            13.18.2.2. By End-use

    13.19. South Africa

        13.19.1. Pricing Analysis

        13.19.2. Market Share Analysis, 2022

            13.19.2.1. By Components

            13.19.2.2. By End-use

    13.20. Israel

        13.20.1. Pricing Analysis

        13.20.2. Market Share Analysis, 2022

            13.20.2.1. By Components

            13.20.2.2. By End-use

14. Market Structure Analysis

    14.1. Competition Dashboard

    14.2. Competition Benchmarking

    14.3. Market Share Analysis of Top Players

        14.3.1. By Regional

        14.3.2. By Components

        14.3.3. By End-use

15. Competition Analysis

    15.1. Competition Deep Dive

        15.1.1. 3D Sound Labs

            15.1.1.1. Overview

            15.1.1.2. Product Portfolio

            15.1.1.3. Profitability by Market Segments

            15.1.1.4. Sales Footprint

            15.1.1.5. Strategy Overview

                15.1.1.5.1. Marketing Strategy

                15.1.1.5.2. Product Strategy

                15.1.1.5.3. Channel Strategy

        15.1.2. Auro Technologies Inc

            15.1.2.1. Overview

            15.1.2.2. Product Portfolio

            15.1.2.3. Profitability by Market Segments

            15.1.2.4. Sales Footprint

            15.1.2.5. Strategy Overview

                15.1.2.5.1. Marketing Strategy

                15.1.2.5.2. Product Strategy

                15.1.2.5.3. Channel Strategy

        15.1.3. Dolby Labs

            15.1.3.1. Overview

            15.1.3.2. Product Portfolio

            15.1.3.3. Profitability by Market Segments

            15.1.3.4. Sales Footprint

            15.1.3.5. Strategy Overview

                15.1.3.5.1. Marketing Strategy

                15.1.3.5.2. Product Strategy

                15.1.3.5.3. Channel Strategy

        15.1.4. Hooke Audio

            15.1.4.1. Overview

            15.1.4.2. Product Portfolio

            15.1.4.3. Profitability by Market Segments

            15.1.4.4. Sales Footprint

            15.1.4.5. Strategy Overview

                15.1.4.5.1. Marketing Strategy

                15.1.4.5.2. Product Strategy

                15.1.4.5.3. Channel Strategy

        15.1.5. dearVR

            15.1.5.1. Overview

            15.1.5.2. Product Portfolio

            15.1.5.3. Profitability by Market Segments

            15.1.5.4. Sales Footprint

            15.1.5.5. Strategy Overview

                15.1.5.5.1. Marketing Strategy

                15.1.5.5.2. Product Strategy

                15.1.5.5.3. Channel Strategy

        15.1.6. Fraunhofer

            15.1.6.1. Overview

            15.1.6.2. Product Portfolio

            15.1.6.3. Profitability by Market Segments

            15.1.6.4. Sales Footprint

            15.1.6.5. Strategy Overview

                15.1.6.5.1. Marketing Strategy

                15.1.6.5.2. Product Strategy

                15.1.6.5.3. Channel Strategy

        15.1.7. Sennheiser electronic GmbH & Co.

            15.1.7.1. Overview

            15.1.7.2. Product Portfolio

            15.1.7.3. Profitability by Market Segments

            15.1.7.4. Sales Footprint

            15.1.7.5. Strategy Overview

                15.1.7.5.1. Marketing Strategy

                15.1.7.5.2. Product Strategy

                15.1.7.5.3. Channel Strategy

        15.1.8. VisiSonics Corporation

            15.1.8.1. Overview

            15.1.8.2. Product Portfolio

            15.1.8.3. Profitability by Market Segments

            15.1.8.4. Sales Footprint

            15.1.8.5. Strategy Overview

                15.1.8.5.1. Marketing Strategy

                15.1.8.5.2. Product Strategy

                15.1.8.5.3. Channel Strategy

        15.1.9. Google

            15.1.9.1. Overview

            15.1.9.2. Product Portfolio

            15.1.9.3. Profitability by Market Segments

            15.1.9.4. Sales Footprint

            15.1.9.5. Strategy Overview

                15.1.9.5.1. Marketing Strategy

                15.1.9.5.2. Product Strategy

                15.1.9.5.3. Channel Strategy

        15.1.10. Waves Audio Ltd.

            15.1.10.1. Overview

            15.1.10.2. Product Portfolio

            15.1.10.3. Profitability by Market Segments

            15.1.10.4. Sales Footprint

            15.1.10.5. Strategy Overview

                15.1.10.5.1. Marketing Strategy

                15.1.10.5.2. Product Strategy

                15.1.10.5.3. Channel Strategy

16. Assumptions & Acronyms Used

17. Research Methodology

List of Tables

Table 1: Global Market Value (US$ Million) Forecast by Region, 2018 to 2033

Table 2: Global Market Volume (Units) Forecast by Region, 2018 to 2033

Table 3: Global Market Value (US$ Million) Forecast by Components, 2018 to 2033

Table 4: Global Market Volume (Units) Forecast by Components, 2018 to 2033

Table 5: Global Market Value (US$ Million) Forecast by End-use, 2018 to 2033

Table 6: Global Market Volume (Units) Forecast by End-use, 2018 to 2033

Table 7: North America Market Value (US$ Million) Forecast by Country, 2018 to 2033

Table 8: North America Market Volume (Units) Forecast by Country, 2018 to 2033

Table 9: North America Market Value (US$ Million) Forecast by Components, 2018 to 2033

Table 10: North America Market Volume (Units) Forecast by Components, 2018 to 2033

Table 11: North America Market Value (US$ Million) Forecast by End-use, 2018 to 2033

Table 12: North America Market Volume (Units) Forecast by End-use, 2018 to 2033

Table 13: Latin America Market Value (US$ Million) Forecast by Country, 2018 to 2033

Table 14: Latin America Market Volume (Units) Forecast by Country, 2018 to 2033

Table 15: Latin America Market Value (US$ Million) Forecast by Components, 2018 to 2033

Table 16: Latin America Market Volume (Units) Forecast by Components, 2018 to 2033

Table 17: Latin America Market Value (US$ Million) Forecast by End-use, 2018 to 2033

Table 18: Latin America Market Volume (Units) Forecast by End-use, 2018 to 2033

Table 19: Europe Market Value (US$ Million) Forecast by Country, 2018 to 2033

Table 20: Europe Market Volume (Units) Forecast by Country, 2018 to 2033

Table 21: Europe Market Value (US$ Million) Forecast by Components, 2018 to 2033

Table 22: Europe Market Volume (Units) Forecast by Components, 2018 to 2033

Table 23: Europe Market Value (US$ Million) Forecast by End-use, 2018 to 2033

Table 24: Europe Market Volume (Units) Forecast by End-use, 2018 to 2033

Table 25: Asia Pacific Market Value (US$ Million) Forecast by Country, 2018 to 2033

Table 26: Asia Pacific Market Volume (Units) Forecast by Country, 2018 to 2033

Table 27: Asia Pacific Market Value (US$ Million) Forecast by Components, 2018 to 2033

Table 28: Asia Pacific Market Volume (Units) Forecast by Components, 2018 to 2033

Table 29: Asia Pacific Market Value (US$ Million) Forecast by End-use, 2018 to 2033

Table 30: Asia Pacific Market Volume (Units) Forecast by End-use, 2018 to 2033

Table 31: MEA Market Value (US$ Million) Forecast by Country, 2018 to 2033

Table 32: MEA Market Volume (Units) Forecast by Country, 2018 to 2033

Table 33: MEA Market Value (US$ Million) Forecast by Components, 2018 to 2033

Table 34: MEA Market Volume (Units) Forecast by Components, 2018 to 2033

Table 35: MEA Market Value (US$ Million) Forecast by End-use, 2018 to 2033

Table 36: MEA Market Volume (Units) Forecast by End-use, 2018 to 2033

List of Charts

Figure 1: Global Market Value (US$ Million) by Components, 2023 to 2033

Figure 2: Global Market Value (US$ Million) by End-use, 2023 to 2033

Figure 3: Global Market Value (US$ Million) by Region, 2023 to 2033

Figure 4: Global Market Value (US$ Million) Analysis by Region, 2018 to 2033

Figure 5: Global Market Volume (Units) Analysis by Region, 2018 to 2033

Figure 6: Global Market Value Share (%) and BPS Analysis by Region, 2023 to 2033

Figure 7: Global Market Y-o-Y Growth (%) Projections by Region, 2023 to 2033

Figure 8: Global Market Value (US$ Million) Analysis by Components, 2018 to 2033

Figure 9: Global Market Volume (Units) Analysis by Components, 2018 to 2033

Figure 10: Global Market Value Share (%) and BPS Analysis by Components, 2023 to 2033

Figure 11: Global Market Y-o-Y Growth (%) Projections by Components, 2023 to 2033

Figure 12: Global Market Value (US$ Million) Analysis by End-use, 2018 to 2033

Figure 13: Global Market Volume (Units) Analysis by End-use, 2018 to 2033

Figure 14: Global Market Value Share (%) and BPS Analysis by End-use, 2023 to 2033

Figure 15: Global Market Y-o-Y Growth (%) Projections by End-use, 2023 to 2033

Figure 16: Global Market Attractiveness by Components, 2023 to 2033

Figure 17: Global Market Attractiveness by End-use, 2023 to 2033

Figure 18: Global Market Attractiveness by Region, 2023 to 2033

Figure 19: North America Market Value (US$ Million) by Components, 2023 to 2033

Figure 20: North America Market Value (US$ Million) by End-use, 2023 to 2033

Figure 21: North America Market Value (US$ Million) by Country, 2023 to 2033

Figure 22: North America Market Value (US$ Million) Analysis by Country, 2018 to 2033

Figure 23: North America Market Volume (Units) Analysis by Country, 2018 to 2033

Figure 24: North America Market Value Share (%) and BPS Analysis by Country, 2023 to 2033

Figure 25: North America Market Y-o-Y Growth (%) Projections by Country, 2023 to 2033

Figure 26: North America Market Value (US$ Million) Analysis by Components, 2018 to 2033

Figure 27: North America Market Volume (Units) Analysis by Components, 2018 to 2033

Figure 28: North America Market Value Share (%) and BPS Analysis by Components, 2023 to 2033

Figure 29: North America Market Y-o-Y Growth (%) Projections by Components, 2023 to 2033

Figure 30: North America Market Value (US$ Million) Analysis by End-use, 2018 to 2033

Figure 31: North America Market Volume (Units) Analysis by End-use, 2018 to 2033

Figure 32: North America Market Value Share (%) and BPS Analysis by End-use, 2023 to 2033

Figure 33: North America Market Y-o-Y Growth (%) Projections by End-use, 2023 to 2033

Figure 34: North America Market Attractiveness by Components, 2023 to 2033

Figure 35: North America Market Attractiveness by End-use, 2023 to 2033

Figure 36: North America Market Attractiveness by Country, 2023 to 2033

Figure 37: Latin America Market Value (US$ Million) by Components, 2023 to 2033

Figure 38: Latin America Market Value (US$ Million) by End-use, 2023 to 2033

Figure 39: Latin America Market Value (US$ Million) by Country, 2023 to 2033

Figure 40: Latin America Market Value (US$ Million) Analysis by Country, 2018 to 2033

Figure 41: Latin America Market Volume (Units) Analysis by Country, 2018 to 2033

Figure 42: Latin America Market Value Share (%) and BPS Analysis by Country, 2023 to 2033

Figure 43: Latin America Market Y-o-Y Growth (%) Projections by Country, 2023 to 2033

Figure 44: Latin America Market Value (US$ Million) Analysis by Components, 2018 to 2033

Figure 45: Latin America Market Volume (Units) Analysis by Components, 2018 to 2033

Figure 46: Latin America Market Value Share (%) and BPS Analysis by Components, 2023 to 2033

Figure 47: Latin America Market Y-o-Y Growth (%) Projections by Components, 2023 to 2033

Figure 48: Latin America Market Value (US$ Million) Analysis by End-use, 2018 to 2033

Figure 49: Latin America Market Volume (Units) Analysis by End-use, 2018 to 2033

Figure 50: Latin America Market Value Share (%) and BPS Analysis by End-use, 2023 to 2033

Figure 51: Latin America Market Y-o-Y Growth (%) Projections by End-use, 2023 to 2033

Figure 52: Latin America Market Attractiveness by Components, 2023 to 2033

Figure 53: Latin America Market Attractiveness by End-use, 2023 to 2033

Figure 54: Latin America Market Attractiveness by Country, 2023 to 2033

Figure 55: Europe Market Value (US$ Million) by Components, 2023 to 2033

Figure 56: Europe Market Value (US$ Million) by End-use, 2023 to 2033

Figure 57: Europe Market Value (US$ Million) by Country, 2023 to 2033

Figure 58: Europe Market Value (US$ Million) Analysis by Country, 2018 to 2033

Figure 59: Europe Market Volume (Units) Analysis by Country, 2018 to 2033

Figure 60: Europe Market Value Share (%) and BPS Analysis by Country, 2023 to 2033

Figure 61: Europe Market Y-o-Y Growth (%) Projections by Country, 2023 to 2033

Figure 62: Europe Market Value (US$ Million) Analysis by Components, 2018 to 2033

Figure 63: Europe Market Volume (Units) Analysis by Components, 2018 to 2033

Figure 64: Europe Market Value Share (%) and BPS Analysis by Components, 2023 to 2033

Figure 65: Europe Market Y-o-Y Growth (%) Projections by Components, 2023 to 2033

Figure 66: Europe Market Value (US$ Million) Analysis by End-use, 2018 to 2033

Figure 67: Europe Market Volume (Units) Analysis by End-use, 2018 to 2033

Figure 68: Europe Market Value Share (%) and BPS Analysis by End-use, 2023 to 2033

Figure 69: Europe Market Y-o-Y Growth (%) Projections by End-use, 2023 to 2033

Figure 70: Europe Market Attractiveness by Components, 2023 to 2033

Figure 71: Europe Market Attractiveness by End-use, 2023 to 2033

Figure 72: Europe Market Attractiveness by Country, 2023 to 2033

Figure 73: Asia Pacific Market Value (US$ Million) by Components, 2023 to 2033

Figure 74: Asia Pacific Market Value (US$ Million) by End-use, 2023 to 2033

Figure 75: Asia Pacific Market Value (US$ Million) by Country, 2023 to 2033

Figure 76: Asia Pacific Market Value (US$ Million) Analysis by Country, 2018 to 2033

Figure 77: Asia Pacific Market Volume (Units) Analysis by Country, 2018 to 2033

Figure 78: Asia Pacific Market Value Share (%) and BPS Analysis by Country, 2023 to 2033

Figure 79: Asia Pacific Market Y-o-Y Growth (%) Projections by Country, 2023 to 2033

Figure 80: Asia Pacific Market Value (US$ Million) Analysis by Components, 2018 to 2033

Figure 81: Asia Pacific Market Volume (Units) Analysis by Components, 2018 to 2033

Figure 82: Asia Pacific Market Value Share (%) and BPS Analysis by Components, 2023 to 2033

Figure 83: Asia Pacific Market Y-o-Y Growth (%) Projections by Components, 2023 to 2033

Figure 84: Asia Pacific Market Value (US$ Million) Analysis by End-use, 2018 to 2033

Figure 85: Asia Pacific Market Volume (Units) Analysis by End-use, 2018 to 2033

Figure 86: Asia Pacific Market Value Share (%) and BPS Analysis by End-use, 2023 to 2033

Figure 87: Asia Pacific Market Y-o-Y Growth (%) Projections by End-use, 2023 to 2033

Figure 88: Asia Pacific Market Attractiveness by Components, 2023 to 2033

Figure 89: Asia Pacific Market Attractiveness by End-use, 2023 to 2033

Figure 90: Asia Pacific Market Attractiveness by Country, 2023 to 2033

Figure 91: MEA Market Value (US$ Million) by Components, 2023 to 2033

Figure 92: MEA Market Value (US$ Million) by End-use, 2023 to 2033

Figure 93: MEA Market Value (US$ Million) by Country, 2023 to 2033

Figure 94: MEA Market Value (US$ Million) Analysis by Country, 2018 to 2033

Figure 95: MEA Market Volume (Units) Analysis by Country, 2018 to 2033

Figure 96: MEA Market Value Share (%) and BPS Analysis by Country, 2023 to 2033

Figure 97: MEA Market Y-o-Y Growth (%) Projections by Country, 2023 to 2033

Figure 98: MEA Market Value (US$ Million) Analysis by Components, 2018 to 2033

Figure 99: MEA Market Volume (Units) Analysis by Components, 2018 to 2033

Figure 100: MEA Market Value Share (%) and BPS Analysis by Components, 2023 to 2033

Figure 101: MEA Market Y-o-Y Growth (%) Projections by Components, 2023 to 2033

Figure 102: MEA Market Value (US$ Million) Analysis by End-use, 2018 to 2033

Figure 103: MEA Market Volume (Units) Analysis by End-use, 2018 to 2033

Figure 104: MEA Market Value Share (%) and BPS Analysis by End-use, 2023 to 2033

Figure 105: MEA Market Y-o-Y Growth (%) Projections by End-use, 2023 to 2033

Figure 106: MEA Market Attractiveness by Components, 2023 to 2033

Figure 107: MEA Market Attractiveness by End-use, 2023 to 2033

Figure 108: MEA Market Attractiveness by Country, 2023 to 2033

Recommendations

Consumer Product

Home Audio Equipment Market

Published : October 2022

Technology

Audio Conferencing Services Market

Published : September 2022

Explore Technology Insights

View Reports