Reports

- Global Locations -

Headquarters

Future Market Insights, Inc.

Christiana Corporate, 200
Continental Drive, Suite 401,
Newark, Delaware - 19713,
United States

T: +1-845-579-5705

Americas

Future Market Insights, Inc.

616 Corporate Way, Suite 2-9018,
Valley Cottage, NY 10989, United States

T: +1-347-918-3531

MEA

Future Market Insights

1602-6 Jumeirah Bay X2 Tower, Plot No: JLT-PH2-X2A,
Jumeirah Lakes Towers, Dubai,
United Arab Emirates

Europe

Future Market Insights

3rd Floor, 207 Regent Street,
W1B 3HH London
United Kingdom

T: + 44 (0) 20 8123 9659
D: +44 (0) 20 3287 4268

Asia Pacific

Future Market Insights

IndiaLand Global Tech Park, Unit UG-1, Behind Grand HighStreet, Phase 1, Hinjawadi, MH, Pune – 411057, India

3D Printed Maxillofacial Implants Market Snapshot (2023 to 2033)

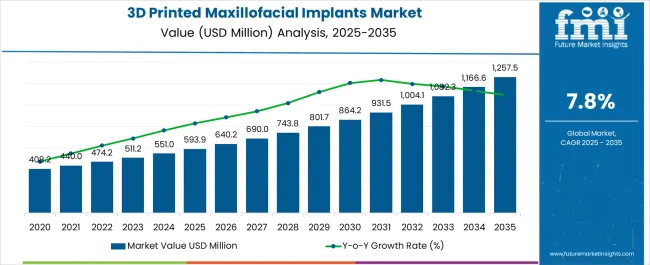
According to a recently released Future Market Insights report, the overall market value is estimated to be around US$ 507.3 million in 2023. The global demand for 3D printed maxillofacial implants is expected to display a CAGR of 8.2% while amassing a market value worth of US$ 1,119.1 million by 2033.

The global market exhibited a CAGR of 3.6% between 2018 and 2022 concluding at a net worth of US$ 483.8 million in 2022. Increasing demand for 3D printed maxillofacial implants is due to reduced surgical times and elimination of constraints of shape, internal structure, and size.

Surging cases of road accidents owing to industrialization and urbanization and growing demand for effective reconstructive surgeries are projected to offer various opportunities for expansion to the 3D printed maxillofacial market. Growing demand for minimally invasive surgeries is anticipated to augment the 3D printed maxillofacial market during the assessment period.

The increasing prevalence of facial fractures is likely to lead mainly from combat sports. Furthermore, the expanding geriatric population and rising healthcare expenditures are other factors contributing to the growth of the 3D printed maxillofacial implants market during the forecast period.

Report Attributes Details
Global 3D Printed Maxillofacial Implants Market Valuation in 2022 US$ 483.8 million
Estimated Global Market Share in 2023 US$ 507.3 million
Forecasted Global Market Size by 2033 US$ 1,119.1 million
Projected Global Market Growth Rate from 2023 to 2033 8.2% CAGR
Historical Market Growth Rate from 2018 to 2022 3.6%

Don't pay for what you don't need

Customize your report by selecting specific countries or regions and save 30%!

What are the Factors Developing the Global 3D Printed Maxillofacial Implants Market?

Growing Prevalence of Facial Injuries to Boost the Demand for 3D Printed Maxillofacial Implants

As per the Centers for Disease Control and Prevention (CDC), 1.7 to 3.8 million traumatic brain injuries are reported annually in the United States. Out of these, 10% arise due to sports and recreational activities. In 2018, the United States Consumer Product Safety Commission (CPSC) data revealed that 454,407 sports-related head injuries were treated in the United States. Such facts and figures are expected to widen the scope of 3D-printed maxillofacial implant growth during the forecast period.

The growing prevalence of facial injuries and fractures is anticipated to drive the demand for maxillofacial implant equipment in the forthcoming years. Some of the most vital factors driving the incidence of facial fractures include incidents such as domestic accidents, motor vehicle accidents, violence, work-related injuries, and sports, among others. Among all, road traffic accidents are likely to secure a dominant share of maxillofacial trauma events.

What are the Prevailing Opportunities in the Global 3D-Printed Maxillofacial Implants Market?

Growing Approvals by Regulatory Authorities to Pose Significant Opportunities to the 3D-Printed Maxillofacial Implants Market

Increasing approvals of the equipment by authorities such as the FDA is expected to offer significant opportunities for expansion during the forecast period. For instance, In July 2022, a 3D printed bone graft from medical equipment manufacturer Cerhum obtained approval for use in Europe.

MyBone is the first commercially available 3D printed bone graft authorized under the Medical Device Regulation 2017/745 and has also been ISO 13485 certified. As a result, the patient-specific bone graft will now be made available to maxillofacial and orthopedic surgeons throughout the continent. Such factors are likely to strengthen the 3D printed maxillofacial implants market during the forecast period.

Sabyasachi Ghosh
Sabyasachi Ghosh

Principal Consultant

Talk to Analyst

Find your sweet spots for generating winning opportunities in this market.

What are the Factors Limiting the Adoption of 3D Printed Maxillofacial Implants Globally?

Lack of Awareness to Limit the 3D Printed Maxillofacial Implants Market

Lack of awareness about the market is expected to act as a significant factor limiting the market growth during the forecast period. Further, high expenses associated with a 3D printed maxillofacial implant are another cause hindering the development of the market in the assessment period.

Growing technological development in maxillofacial implants is expected to act as a significant counter to the hampering factors and assist in market growth during the forecast period.

Segmentation Analysis

Based on End-Users, Which Segment is expected to Emerge Dominant in the Market?

Maximum Benefits Offered by Healthcare Settings to Strengthen the Hospital Segment

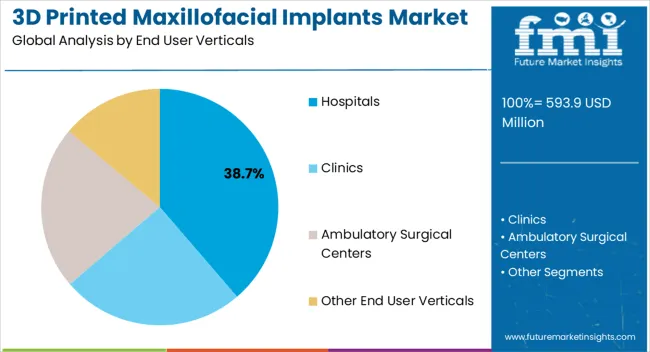
The study reveals that the hospital segment is likely to dominate the global 3D printed maxillofacial implants market during the forecast period. In 2021, the segment garnered at US$ 822.5 million.

Domination of the segment can be attributed to the fact that maximum maxillofacial surgeries are conducted in hospitals due to the presence of technologically developed equipment, facilities, and expertise in these healthcare settings.

Other provisions like intensive care units and post-surgical support might lead to many people going to hospitals. Thus, due to various benefits provided by these healthcare settings, the hospital segment is going to exhibit various prospects of growth in the forecast period.

Category By End User Vertical
Top Segment Hospital
Market Share in Percentage 73.3%

Get the data you need at a Fraction of the cost

Personalize your report by choosing insights you need
and save 40%!

Regional Analysis

How North America is Expected to Perform in the 3D Printed Maxillofacial Implants Market?

Growing Approvals by FDA for Key Equipment to widen Market Growth Prospects

According to FMI’s analysis, North America is anticipated to dominate the global market during the forecast period. In 2022, the region claimed 37.4% of the total market share. The United States is anticipated to make the maximum contribution to developing the regional market.

Expansion of the regional market is majorly attributed to the expanding geriatric population along with the presence of renowned international players in the region. Also, the number of surgeries performed in the United States is high and is multiplying each year which is projected to have a positive impact on the market during the forecast period.

Growing approval by the United States FDA for key 3D printed maxillofacial equipment is anticipated to fuel the market growth in the forecast period. In October 2020, Pioneering 3D printer manufacturer 3D Systems announced that it received 510(k) clearance from the FDA to 3D print maxillofacial surgical guides using its LaserForm Ti and DuraFormProX PA materials. Such factors are expected to make significant contributions to the market growth in the forecast period.

Regional Market Comparison Global Market Share in Percentage
North America 37.2%
Europe 28.4%

What is the Role of Europe in Strengthening the Global 3D-Printed Maxillofacial Implants Market?

Introduction of New Products in Europe’s Market to Develop the Regional Market
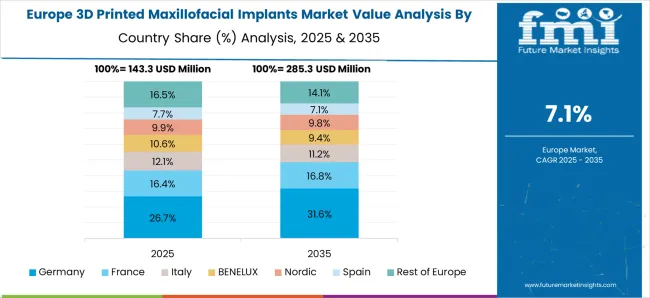
According to Future Market Insights, Europe’s 3D printed maxillofacial implants market is anticipated to be the second-largest market during the forecast period. In 2022, the region secured 29.2% of the global market share.

Expansion of the regional market can be attributed to the growing launch of new products in the market. For instance, in 2019, Evonik rolled out new radiopaque material, PEEK, which can be used for implant technology. The newly launched material can be used in maxillofacial implants. It also offers enhanced bio-stability and biocompatibility.

Regional Market Comparison Global Market Share in Percentage
The United States 34.7%
Germany 7.3%
Japan 4.6%

What is the Growth Scope of the Market in the Asia Pacific?

Ongoing Research and Development in the Field to Drive Asia Pacific’s 3D Printed Maxillofacial Implants Market

Asia Pacific is projected to be the most significant market during the forecast period, expected to display a CAGR of 7.7% until 2033. This can be attributed to the presence of untapped market opportunities in the region. Developing countries like India, China, Japan, and others, are likely to hold significant market opportunities in the region.

Ongoing research and development in developing countries of the region is expected to develop the market in the coming time. For instance,

  • In August 2018, Researchers at the Tokyo Dental College, Japan, developed a “one-stop 3D printing lab” for designing and producing inexpensive patient-specific dental models for use in maxillofacial surgery and dentistry.
  • In February 2020, the All India Institute of Medical Sciences (AIIMS) introduced a cutting-edge 3D printing technology for jaw joint replacements to procure accuracy in such procedures.
Regional Markets CAGR (2023 to 2033)
The United Kingdom 7%
China 9.1%
India 7.9%
Australia 6.3%

How are the Startups Changing the Landscape of the 3D Printed Maxillofacial Implants Market?

Ongoing research and development in the 3D printed maxillofacial implants is expected to encourage new players to enter the market, thus, augmenting the market size notably. Some of the names gaining popularity include Maxillofacial Implants (India), Avay (India), Seinser Implants (India), Nasseo (US), Keystone Dental (2006), iDentical (US), 3di GmbH (Germany), BioMaterals Korea, Inc. (Korea), Zoriox Innovation Labs (India), and others. Emerging players in the market are making notable contributions to developing the market. For instance,
  • Zoriox, an India-based startup has made more than 270-plus implants and has helped in surgically placing them in patients all over India and a few of them in other parts of the world. Zoriox has a team of surgeons, mechanical engineers, dentists, software engineers, and anatomists to offer a 360-degree solution to facial reconstruction and its associated needs.

Competition Analysis

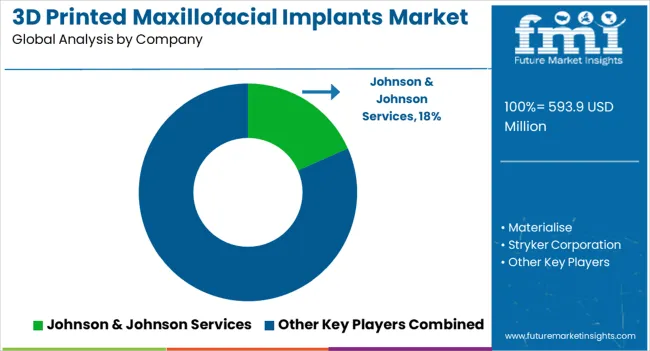
Key players in the global 3D printed maxillofacial implants market include Materialise, Zimmer Biomet, Medartis, DePuySynthes, and others.

Recent Industry Updates include:

  • In May 2022, Medartis Holding AG announced that it has completed the acquisition of Nextremity Solutions Inc., a strategic commercialization organization located in Warsaw, Indiana. The total purchase price for the transaction is going to be up to US$ 70 million and includes milestone and earn-out payments of up to US$ 30 million. The initiative might allow Medartis to expedite its USextremities business by gaining access to a comprehensive product pipeline, strong relationships with US design surgeons, and an experienced research and development team.
  • In December 2020, Zimmer Biomet Holdings, Inc., a globally renowned healthcare player announced that the company completed the acquisition of A&E Medical Corporation, a Vance Street Capital Portfolio Company, for US$ 150 million in cash at closing and S$ 100 million in cash payable in 2021.

Report Scope

Report Attributes Details
Growth Rate (2023 to 2033) 8.2% CAGR
Market Value in 2023 US$ 507.3 million
Market Value in 2033 US$ 1,119.1 million
Base Year for Estimation 2022
Historical Data 2018 to 2022
Forecast Period 2023 to 2033
Quantitative Units US$ million or US$ billion for Value
Report Coverage Revenue Forecast, Volume Forecast, Company Ranking, Competitive Landscape, Growth Factors, Trends, and Pricing Analysis
Segments Covered
  • By End User Verticals
  • By Region
Regions Covered
  • North America
  • Latin America
  • Europe
  • Asia Pacific
  • The Middle East & Africa
Key Countries Profiled
  • The United States
  • Canada
  • Mexico
  • Brazil
  • Germany
  • The United Kingdom
  • France
  • Spain
  • Italy
  • Russia
  • China
  • Japan
  • India
  • South Korea
  • Australia
  • South Africa
  • Saudi Arabia
Key Companies Profiled
  • Johnson & Johnson Services
  • Materialise
  • Stryker Corporation
  • Zimmer Biomet Holdings
  • B. Braun Melsungen
  • Medtronic Plc.
  • Boston Medical Products
  • Integra Lifesciences
  • KLS Martin
  • Medartis
Customization Scope Available upon Request

Key Segments Profiled in the Global 3D Printed Maxillofacial Implants Market

By End User Verticals:

  • Hospitals
  • Clinics
  • Ambulatory Surgical Centers
  • Other End User Verticals

By Region:

  • North America Market
  • Latin America Market
  • Europe 3D Market
  • Asia Pacific Market
  • The Middle East & African (MEA) Market

Frequently Asked Questions

What is the 3D Printed Maxillofacial Implants market size in 2023?

The market is valued at US$ 507.3 million in 2023.

How was the market’s historical performance?

The market rose at a 3.6% CAGR from 2018 to 2022.

What will the market size be in 2033?

The market will reach US$ 1,119.1 million by 2033.

What is the CAGR from 2023 to 2033?

The market’s CAGR from 2023 to 2033 will be 8.2%.

What was North America’s market share in 2022?

In 2022, the North America claimed 37.4% of the total market share.

Table of Content

1. Executive Summary

    1.1. Global Market Outlook

    1.2. Demand-side Trends

    1.3. Supply-side Trends

    1.4. Technology Roadmap Analysis

    1.5. Analysis and Recommendations

2. Market Overview

    2.1. Market Coverage / Taxonomy

    2.2. Market Definition / Scope / Limitations

3. Market Background

    3.1. Market Dynamics

        3.1.1. Drivers

        3.1.2. Restraints

        3.1.3. Opportunity

        3.1.4. Trends

    3.2. Scenario Forecast

        3.2.1. Demand in Optimistic Scenario

        3.2.2. Demand in Likely Scenario

        3.2.3. Demand in Conservative Scenario

    3.3. Opportunity Map Analysis

    3.4. Product Life Cycle Analysis

    3.5. Investment Feasibility Matrix

    3.6. PESTLE and Porter’s Analysis

    3.7. Regulatory Landscape

        3.7.1. By Key Regions

        3.7.2. By Key Countries

    3.8. Regional Parent Market Outlook

4. Global Market Analysis 2018 to 2022 and Forecast, 2023 to 2033

    4.1. Historical Market Size Value (US$ Mn) Analysis, 2018 to 2022

    4.2. Current and Future Market Size Value (US$ Mn) Projections, 2023 to 2033

        4.2.1. Y-o-Y Growth Trend Analysis

        4.2.2. Absolute $ Opportunity Analysis

5. Global Market Analysis 2018 to 2022 and Forecast 2023 to 2033, By End-User

    5.1. Introduction / Key Findings

    5.2. Historical Market Size Value (US$ Mn) Analysis By End-User, 2018 to 2022

    5.3. Current and Future Market Size Value (US$ Mn) Analysis and Forecast By End-User, 2023 to 2033

        5.3.1. Hospitals

        5.3.2. Clinics

        5.3.3. Ambulatory Surgical Centers

    5.4. Y-o-Y Growth Trend Analysis By End-User, 2018 to 2022

    5.5. Absolute $ Opportunity Analysis By End-User, 2023 to 2033

6. Global Market Analysis 2018 to 2022 and Forecast 2023 to 2033, By Region

    6.1. Introduction

    6.2. Historical Market Size Value (US$ Mn) Analysis By Region, 2018 to 2022

    6.3. Current Market Size Value (US$ Mn) Analysis and Forecast By Region, 2023 to 2033

        6.3.1. North America

        6.3.2. Latin America

        6.3.3. Europe

        6.3.4. Asia Pacific

        6.3.5. Middle East and Africa

    6.4. Market Attractiveness Analysis By Region

7. North America Market Analysis 2018 to 2022 and Forecast 2023 to 2033, By Country

    7.1. Historical Market Size Value (US$ Mn) Trend Analysis By Market Taxonomy, 2018 to 2022

    7.2. Market Size Value (US$ Mn) Forecast By Market Taxonomy, 2023 to 2033

        7.2.1. By Country

            7.2.1.1. U.S.

            7.2.1.2. Canada

        7.2.2. By End-User

    7.3. Market Attractiveness Analysis

        7.3.1. By Country

        7.3.2. By End-User

    7.4. Key Takeaways

8. Latin America Market Analysis 2018 to 2022 and Forecast 2023 to 2033, By Country

    8.1. Historical Market Size Value (US$ Mn) Trend Analysis By Market Taxonomy, 2018 to 2022

    8.2. Market Size Value (US$ Mn) Forecast By Market Taxonomy, 2023 to 2033

        8.2.1. By Country

            8.2.1.1. Brazil

            8.2.1.2. Mexico

            8.2.1.3. Rest of Latin America

        8.2.2. By End-User

    8.3. Market Attractiveness Analysis

        8.3.1. By Country

        8.3.2. By End-User

    8.4. Key Takeaways

9. Europe Market Analysis 2018 to 2022 and Forecast 2023 to 2033, By Country

    9.1. Historical Market Size Value (US$ Mn) Trend Analysis By Market Taxonomy, 2018 to 2022

    9.2. Market Size Value (US$ Mn) Forecast By Market Taxonomy, 2023 to 2033

        9.2.1. By Country

            9.2.1.1. Germany

            9.2.1.2. U.K.

            9.2.1.3. France

            9.2.1.4. Spain

            9.2.1.5. Italy

            9.2.1.6. Russia

            9.2.1.7. Rest of Europe

        9.2.2. By End-User

    9.3. Market Attractiveness Analysis

        9.3.1. By Country

        9.3.2. By End-User

    9.4. Key Takeaways

10. Asia Pacific Market Analysis 2018 to 2022 and Forecast 2023 to 2033, By Country

    10.1. Historical Market Size Value (US$ Mn) Trend Analysis By Market Taxonomy, 2018 to 2022

    10.2. Market Size Value (US$ Mn) Forecast By Market Taxonomy, 2023 to 2033

        10.2.1. By Country

            10.2.1.1. China

            10.2.1.2. Japan

            10.2.1.3. India

            10.2.1.4. South Korea

            10.2.1.5. Australia

            10.2.1.6. Rest of APAC

        10.2.2. By End-User

    10.3. Market Attractiveness Analysis

        10.3.1. By Country

        10.3.2. By End-User

    10.4. Key Takeaways

11. Middle East and Africa Market Analysis 2018 to 2022 and Forecast 2023 to 2033, By Country

    11.1. Historical Market Size Value (US$ Mn) Trend Analysis By Market Taxonomy, 2018 to 2022

    11.2. Market Size Value (US$ Mn) Forecast By Market Taxonomy, 2023 to 2033

        11.2.1. By Country

            11.2.1.1. South Africa

            11.2.1.2. Saudi Arabia

            11.2.1.3. UAE

            11.2.1.4. Israel

            11.2.1.5. Rest of MEA

        11.2.2. By End-User

    11.3. Market Attractiveness Analysis

        11.3.1. By Country

        11.3.2. By End-User

    11.4. Key Takeaways

12. Key Countries Market Analysis

    12.1. U.S.

        12.1.1. Pricing Analysis

        12.1.2. Market Share Analysis, 2022

            12.1.2.1. By End-User

    12.2. Canada

        12.2.1. Pricing Analysis

        12.2.2. Market Share Analysis, 2022

            12.2.2.1. By End-User

    12.3. Brazil

        12.3.1. Pricing Analysis

        12.3.2. Market Share Analysis, 2022

            12.3.2.1. By End-User

    12.4. Mexico

        12.4.1. Pricing Analysis

        12.4.2. Market Share Analysis, 2022

            12.4.2.1. By End-User

    12.5. Germany

        12.5.1. Pricing Analysis

        12.5.2. Market Share Analysis, 2022

            12.5.2.1. By End-User

    12.6. U.K.

        12.6.1. Pricing Analysis

        12.6.2. Market Share Analysis, 2022

            12.6.2.1. By End-User

    12.7. France

        12.7.1. Pricing Analysis

        12.7.2. Market Share Analysis, 2022

            12.7.2.1. By End-User

    12.8. Spain

        12.8.1. Pricing Analysis

        12.8.2. Market Share Analysis, 2022

            12.8.2.1. By End-User

    12.9. Italy

        12.9.1. Pricing Analysis

        12.9.2. Market Share Analysis, 2022

            12.9.2.1. By End-User

    12.10. Russia

        12.10.1. Pricing Analysis

        12.10.2. Market Share Analysis, 2022

            12.10.2.1. By End-User

    12.11. China

        12.11.1. Pricing Analysis

        12.11.2. Market Share Analysis, 2022

            12.11.2.1. By End-User

    12.12. Japan

        12.12.1. Pricing Analysis

        12.12.2. Market Share Analysis, 2022

            12.12.2.1. By End-User

    12.13. India

        12.13.1. Pricing Analysis

        12.13.2. Market Share Analysis, 2022

            12.13.2.1. By End-User

    12.14. South Korea

        12.14.1. Pricing Analysis

        12.14.2. Market Share Analysis, 2022

            12.14.2.1. By End-User

    12.15. Australia

        12.15.1. Pricing Analysis

        12.15.2. Market Share Analysis, 2022

            12.15.2.1. By End-User

    12.16. South Africa

        12.16.1. Pricing Analysis

        12.16.2. Market Share Analysis, 2022

            12.16.2.1. By End-User

    12.17. Saudi Arabia

        12.17.1. Pricing Analysis

        12.17.2. Market Share Analysis, 2022

            12.17.2.1. By End-User

    12.18. UAE

        12.18.1. Pricing Analysis

        12.18.2. Market Share Analysis, 2022

            12.18.2.1. By End-User

    12.19. Israel

        12.19.1. Pricing Analysis

        12.19.2. Market Share Analysis, 2022

            12.19.2.1. By End-User

13. Market Structure Analysis

    13.1. Competition Dashboard

    13.2. Competition Benchmarking

    13.3. Market Share Analysis of Top Players

        13.3.1. By Regional

        13.3.2. By End-User

14. Competition Analysis

    14.1. Competition Deep Dive

        14.1.1. Johnson & Johnson Services

            14.1.1.1. Overview

            14.1.1.2. Product Portfolio

            14.1.1.3. Profitability by Market Segments

            14.1.1.4. Sales Footprint

            14.1.1.5. Strategy Overview

                14.1.1.5.1. Marketing Strategy

        14.1.2. Materialise

            14.1.2.1. Overview

            14.1.2.2. Product Portfolio

            14.1.2.3. Profitability by Market Segments

            14.1.2.4. Sales Footprint

            14.1.2.5. Strategy Overview

                14.1.2.5.1. Marketing Strategy

        14.1.3. Stryker Corporation

            14.1.3.1. Overview

            14.1.3.2. Product Portfolio

            14.1.3.3. Profitability by Market Segments

            14.1.3.4. Sales Footprint

            14.1.3.5. Strategy Overview

                14.1.3.5.1. Marketing Strategy

        14.1.4. Zimmer Biomet Holdings

            14.1.4.1. Overview

            14.1.4.2. Product Portfolio

            14.1.4.3. Profitability by Market Segments

            14.1.4.4. Sales Footprint

            14.1.4.5. Strategy Overview

                14.1.4.5.1. Marketing Strategy

        14.1.5. B. Braun Melsungen

            14.1.5.1. Overview

            14.1.5.2. Product Portfolio

            14.1.5.3. Profitability by Market Segments

            14.1.5.4. Sales Footprint

            14.1.5.5. Strategy Overview

                14.1.5.5.1. Marketing Strategy

        14.1.6. Medtronic Plc.

            14.1.6.1. Overview

            14.1.6.2. Product Portfolio

            14.1.6.3. Profitability by Market Segments

            14.1.6.4. Sales Footprint

            14.1.6.5. Strategy Overview

                14.1.6.5.1. Marketing Strategy

        14.1.7. Boston Medical Products

            14.1.7.1. Overview

            14.1.7.2. Product Portfolio

            14.1.7.3. Profitability by Market Segments

            14.1.7.4. Sales Footprint

            14.1.7.5. Strategy Overview

                14.1.7.5.1. Marketing Strategy

        14.1.8. Integra Lifesciences

            14.1.8.1. Overview

            14.1.8.2. Product Portfolio

            14.1.8.3. Profitability by Market Segments

            14.1.8.4. Sales Footprint

            14.1.8.5. Strategy Overview

                14.1.8.5.1. Marketing Strategy

        14.1.9. KLS Martin

            14.1.9.1. Overview

            14.1.9.2. Product Portfolio

            14.1.9.3. Profitability by Market Segments

            14.1.9.4. Sales Footprint

            14.1.9.5. Strategy Overview

                14.1.9.5.1. Marketing Strategy

        14.1.10. Medartis

            14.1.10.1. Overview

            14.1.10.2. Product Portfolio

            14.1.10.3. Profitability by Market Segments

            14.1.10.4. Sales Footprint

            14.1.10.5. Strategy Overview

                14.1.10.5.1. Marketing Strategy

15. Assumptions & Acronyms Used

16. Research Methodology

Don't pay for what you don't need

Customize your report by selecting specific countries or regions and save 30%!

List of Tables

Table 1: Global Market Value (US$ Mn) Forecast by Region, 2018 to 2033

Table 2: Global Market Value (US$ Mn) Forecast by End-User, 2018 to 2033

Table 3: North America Market Value (US$ Mn) Forecast by Country, 2018 to 2033

Table 4: North America Market Value (US$ Mn) Forecast by End-User, 2018 to 2033

Table 5: Latin America Market Value (US$ Mn) Forecast by Country, 2018 to 2033

Table 6: Latin America Market Value (US$ Mn) Forecast by End-User, 2018 to 2033

Table 7: Europe Market Value (US$ Mn) Forecast by Country, 2018 to 2033

Table 8: Europe Market Value (US$ Mn) Forecast by End-User, 2018 to 2033

Table 9: Asia Pacific Market Value (US$ Mn) Forecast by Country, 2018 to 2033

Table 10: Asia Pacific Market Value (US$ Mn) Forecast by End-User, 2018 to 2033

Table 11: Middle East and Africa Market Value (US$ Mn) Forecast by Country, 2018 to 2033

Table 12: Middle East and Africa Market Value (US$ Mn) Forecast by End-User, 2018 to 2033
Sabyasachi Ghosh
Sabyasachi Ghosh

Principal Consultant

Talk to Analyst

Find your sweet spots for generating winning opportunities in this market.

List of Charts

Figure 1: Global Market Value (US$ Mn) by End-User, 2023 to 2033

Figure 2: Global Market Value (US$ Mn) by Region, 2023 to 2033

Figure 3: Global Market Value (US$ Mn) Analysis by Region, 2018 to 2033

Figure 4: Global Market Value Share (%) and BPS Analysis by Region, 2023 to 2033

Figure 5: Global Market Y-o-Y Growth (%) Projections by Region, 2023 to 2033

Figure 6: Global Market Value (US$ Mn) Analysis by End-User, 2018 to 2033

Figure 7: Global Market Value Share (%) and BPS Analysis by End-User, 2023 to 2033

Figure 8: Global Market Y-o-Y Growth (%) Projections by End-User, 2023 to 2033

Figure 9: Global Market Attractiveness by End-User, 2023 to 2033

Figure 10: Global Market Attractiveness by Region, 2023 to 2033

Figure 11: North America Market Value (US$ Mn) by End-User, 2023 to 2033

Figure 12: North America Market Value (US$ Mn) by Country, 2023 to 2033

Figure 13: North America Market Value (US$ Mn) Analysis by Country, 2018 to 2033

Figure 14: North America Market Value Share (%) and BPS Analysis by Country, 2023 to 2033

Figure 15: North America Market Y-o-Y Growth (%) Projections by Country, 2023 to 2033

Figure 16: North America Market Value (US$ Mn) Analysis by End-User, 2018 to 2033

Figure 17: North America Market Value Share (%) and BPS Analysis by End-User, 2023 to 2033

Figure 18: North America Market Y-o-Y Growth (%) Projections by End-User, 2023 to 2033

Figure 19: North America Market Attractiveness by End-User, 2023 to 2033

Figure 20: North America Market Attractiveness by Country, 2023 to 2033

Figure 21: Latin America Market Value (US$ Mn) by End-User, 2023 to 2033

Figure 22: Latin America Market Value (US$ Mn) by Country, 2023 to 2033

Figure 23: Latin America Market Value (US$ Mn) Analysis by Country, 2018 to 2033

Figure 24: Latin America Market Value Share (%) and BPS Analysis by Country, 2023 to 2033

Figure 25: Latin America Market Y-o-Y Growth (%) Projections by Country, 2023 to 2033

Figure 26: Latin America Market Value (US$ Mn) Analysis by End-User, 2018 to 2033

Figure 27: Latin America Market Value Share (%) and BPS Analysis by End-User, 2023 to 2033

Figure 28: Latin America Market Y-o-Y Growth (%) Projections by End-User, 2023 to 2033

Figure 29: Latin America Market Attractiveness by End-User, 2023 to 2033

Figure 30: Latin America Market Attractiveness by Country, 2023 to 2033

Figure 31: Europe Market Value (US$ Mn) by End-User, 2023 to 2033

Figure 32: Europe Market Value (US$ Mn) by Country, 2023 to 2033

Figure 33: Europe Market Value (US$ Mn) Analysis by Country, 2018 to 2033

Figure 34: Europe Market Value Share (%) and BPS Analysis by Country, 2023 to 2033

Figure 35: Europe Market Y-o-Y Growth (%) Projections by Country, 2023 to 2033

Figure 36: Europe Market Value (US$ Mn) Analysis by End-User, 2018 to 2033

Figure 37: Europe Market Value Share (%) and BPS Analysis by End-User, 2023 to 2033

Figure 38: Europe Market Y-o-Y Growth (%) Projections by End-User, 2023 to 2033

Figure 39: Europe Market Attractiveness by End-User, 2023 to 2033

Figure 40: Europe Market Attractiveness by Country, 2023 to 2033

Figure 41: Asia Pacific Market Value (US$ Mn) by End-User, 2023 to 2033

Figure 42: Asia Pacific Market Value (US$ Mn) by Country, 2023 to 2033

Figure 43: Asia Pacific Market Value (US$ Mn) Analysis by Country, 2018 to 2033

Figure 44: Asia Pacific Market Value Share (%) and BPS Analysis by Country, 2023 to 2033

Figure 45: Asia Pacific Market Y-o-Y Growth (%) Projections by Country, 2023 to 2033

Figure 46: Asia Pacific Market Value (US$ Mn) Analysis by End-User, 2018 to 2033

Figure 47: Asia Pacific Market Value Share (%) and BPS Analysis by End-User, 2023 to 2033

Figure 48: Asia Pacific Market Y-o-Y Growth (%) Projections by End-User, 2023 to 2033

Figure 49: Asia Pacific Market Attractiveness by End-User, 2023 to 2033

Figure 50: Asia Pacific Market Attractiveness by Country, 2023 to 2033

Figure 51: Middle East and Africa Market Value (US$ Mn) by End-User, 2023 to 2033

Figure 52: Middle East and Africa Market Value (US$ Mn) by Country, 2023 to 2033

Figure 53: Middle East and Africa Market Value (US$ Mn) Analysis by Country, 2018 to 2033

Figure 54: Middle East and Africa Market Value Share (%) and BPS Analysis by Country, 2023 to 2033

Figure 55: Middle East and Africa Market Y-o-Y Growth (%) Projections by Country, 2023 to 2033

Figure 56: Middle East and Africa Market Value (US$ Mn) Analysis by End-User, 2018 to 2033

Figure 57: Middle East and Africa Market Value Share (%) and BPS Analysis by End-User, 2023 to 2033

Figure 58: Middle East and Africa Market Y-o-Y Growth (%) Projections by End-User, 2023 to 2033

Figure 59: Middle East and Africa Market Attractiveness by End-User, 2023 to 2033

Figure 60: Middle East and Africa Market Attractiveness by Country, 2023 to 2033

Recommendations

Healthcare

Craniofacial Implants Market

Published : June 2023

Healthcare

Dental Implants and Prosthetics Market

Published : September 2022

Explore Healthcare Insights

View Reports

3D Printed Maxillofacial Implants Market