3d-Printed Skincare Market Size and Share Forecast Outlook 2025 to 2035

The global 3D-Printed Skincare Market is projected to surpass USD 4,213.2 million by 2035, rising sharply from USD 864.3 million in 2025-representing an absolute increase of USD 3,348.9 million, or a nearly 5X expansion over the decade. This exceptional growth reflects a CAGR of 17.2%, driven by technological convergence, shifting consumer behavior, and personalization in skincare solutions.
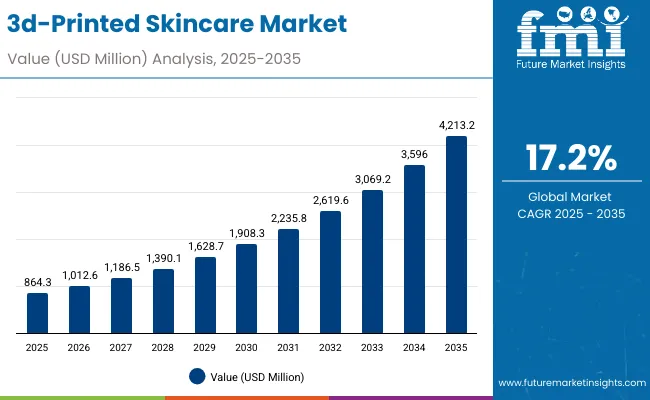
Quick Stats for 3d-Printed Skincare Market

  • 3D-Printed Skincare Market Value (2025): USD 864.3 Million
  • • 3D-Printed Skincare Market Forecast Value (2035): USD 4,213.2 Million
  • • 3D-Printed Skincare Market Forecast CAGR (2025 to 2035): 17.2%
  • • Leading Segment in 2025: Others (by Application) - 58.6% Market Share
  • • Key Growth Regions: North America, Asia-Pacific, Europe
  • • Top Key Players: Neutrogena MaskiD, L’Oréal Perso, Shiseido, Amorepacific, SkinCeuticals, FOREO, Revieve, Procter & Gamble, Albéa Group, Younique

3d Printed Skincare Market

3d-Printed Skincare Market Key Takeaways

Metric Value
Market Estimated Value in (2025E) USD 864.3 Million
Market Forecast Value in (2035F) USD 4,213.2 Million
Forecast CAGR (2025 to 2035) 17.20%

As the market transitions from a niche innovation to mainstream adoption, its value trajectory is anticipated to follow an accelerated curve across two distinct phases of growth.

Between 2025 and 2030, the market is forecasted to expand from USD 864.3 million to USD 1,908.3 million, contributing USD 1,044 million, which accounts for nearly 31.2% of the total 10-year growth. This period is expected to be characterized by foundational adoption of bioprinting technologies, increased demand for personalized skincare masks, and commercialization of on-demand patch systems in North America and Asia-Pacific. Bioprinting is projected to contribute a sizable share early on, as dermatology clinics and premium beauty brands integrate advanced skin diagnostics and printed formulations.

The second growth phase from 2030 to 2035 is expected to deliver USD 2,304.9 million, or 68.8% of the total incremental growth, driven by high-volume deployment of 3D-printed creams, smart refills, and AI-enhanced beauty solutions. Emerging markets such as China and India are anticipated to outpace mature economies, owing to higher CAGR projections of 16.3% and 18.3%, respectively. By 2035, this shift is likely to make Asia the epicenter of scalable, tech-driven skincare manufacturing.

The segment’s growth is forecasted to remain robust, underpinned by personalization, sustainability, and AI-3D convergence.

From 2020 to 2024, rapid advancements in personalized skincare formulation were enabled through innovations in bioprinting and digital customization tools. Market traction was primarily driven by single-use masks and on-demand creams, which were promoted by both dermatology clinics and premium skincare brands. A clear consumer shift toward hyper-personalized, tech-enabled beauty solutions was observed.

By 2025, the market is expected to be valued at USD 864.3 million, with robust adoption in the USA and China. Personalized masks and cartridge-based refill formats are anticipated to dominate application growth. Bioprinting is projected to contribute over 41% of the total market revenue by the same year.

Over the next decade, digital interfaces and at-home diagnostics are expected to transform delivery models. By 2035, a value of USD 4.21 billion is projected to be reached, supported by recurring purchases of refill cartridges, AI-powered skin mapping, and cloud-enabled customization platforms.

The competitive edge is forecast to favor companies that integrate bioprinting hardware with real-time skin diagnostics, cloud databases, and dermatologist-backed formulations. Strategic alliances between consumer beauty brands and 3D tech firms are likely to shape ecosystem dominance. Leading firms are expected to shift from standalone hardware models to hybrid, subscription-driven personalization ecosystems.

Why the 3d-Printed Skincare Market is growing?

Growth in the 3D-Printed Skincare Market is being fueled by technological breakthroughs in bioprinting precision, material customization, and AI-based facial scanning. Consumer expectations for hyper-personalized skincare have been reshaped by the ability to analyze skin in real-time and deliver tailor-made formulations through 3D printing. Demand has been elevated as custom masks and dermal patches allow active ingredients to be deposited with anatomical accuracy, improving efficacy and user satisfaction.

Adoption has been supported by dermatology clinics and tech-forward beauty brands, which have integrated smart diagnostics with formulation engines. A growing preference for eco-conscious and refillable formats has aligned well with 3D-printing’s on-demand production capabilities, minimizing waste. The market’s momentum is further propelled by Asia-Pacific’s rapid adoption, especially in China and India, due to affordability and innovation scaling.

With personalization, sustainability, and digital integration converging, 3D-printed skincare is expected to transition from luxury to essential, redefining future skincare delivery systems.

Segmental Analysis

The 3D-Printed Skincare Market has been strategically segmented into printing technology, application, and product form, each offering distinct growth dynamics and innovation potential. These segments reflect how 3D printing is being embedded into skincare personalization at both clinical and consumer levels. By printing technology, segmentation includes bioprinting and others (powder jetting, extrusion), highlighting hardware-led precision and cellular-level formulations.

The application segment captures usage diversity, such as personalized masks, on-demand serums, and dermal repair patches. Product form segmentation includes single-use masks and refillable formats like cartridges and patch sheets, emphasizing sustainability and usability. This structure enables deeper insights into consumer demand patterns, technological shifts, and business model evolution within a rapidly transforming beauty-tech landscape.
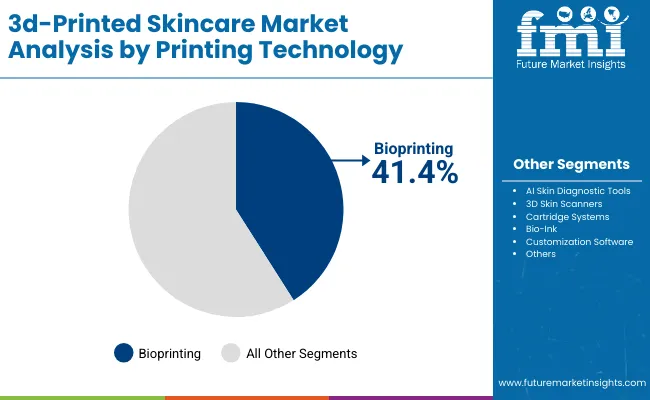
Insights into the Printing Technology Segment with Bioprinting Leading

3d Printed Skincare Market By Printing

Printing Technology Market Value Share, 2025
Bioprinting 41.4%
Others 58.6%

Bioprinting is projected to contribute 41.4% of the total value in 2025, equal to USD 357.94 million. This segment is being driven by demand for cell-compatible formulations, enabling precision delivery of active ingredients. In dermatology clinics, bioprinting is being applied for hyper-customized skin patches that match facial contours and skin conditions. Its growth is further supported by rising investment in bio-inks and 3D skin simulation models, making bioprinting a critical enabler of future-ready skincare platforms.
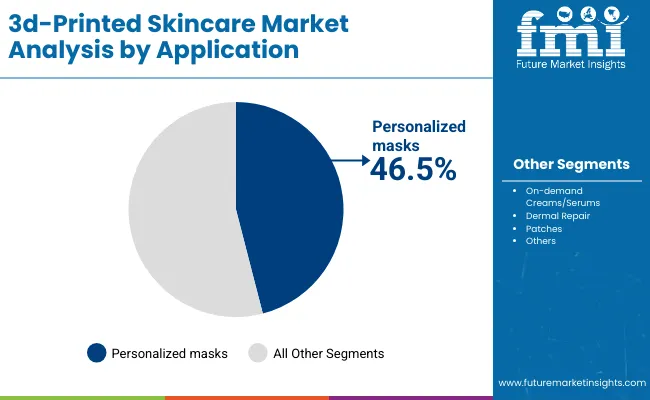
Insights into the Application Segment with Personalized Masks Dominating

3d Printed Skincare Market By Application

Application Market Value Share, 2025
Personalized masks 46.5%
Others 53.5%

The personalized masks segment is forecasted to generate USD 401.59 million in 2025, accounting for 46.5% of total application revenue. This dominance is being driven by strong consumer demand for custom-fitted facial solutions that address hydration, aging, pigmentation, and sensitivity on an individual level. Real-time skin scanning paired with app-enabled personalization is enabling mass-market scalability for this category. Strategic alliances between tech firms and skincare brands are also enhancing the formulation and delivery of ingredients. As consumers shift from generic to algorithm-guided routines, personalized masks are expected to remain the cornerstone of product innovation.
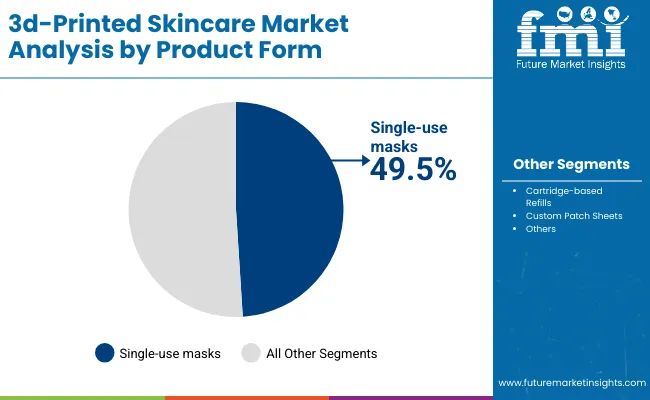
Insights into the Product Form Segment with Single-use Masks Leading

3d Printed Skincare Market By Product

Product Form Market Value Share, 2025
Single-use masks 49.5%
Others 50.5%

Single-use masks are anticipated to lead the product form segment in 2025, contributing USD 427.78 million, or 49.5% of the total value. Adoption has been driven by ease of use, hygienic application, and cost-effectiveness for consumers seeking fast, visible skincare results. Although sustainability concerns are being raised, innovations in biodegradable materials are allowing continued growth in this category. Dermatologists and wellness retailers are favoring single-use formats for precision dosage and enhanced treatment efficacy. As user expectations evolve toward convenience without compromising performance, this format is projected to maintain significant relevance across both premium and mass-market channels.

What are the Drivers, Restraints, and Key Trends of the 3d-Printed Skincare Market?

While personalization is accelerating adoption, the 3D-Printed Skincare Market continues to be shaped by shifts in consumer diagnostics, clinic integration challenges, and the sophistication of bio-formulation software that demands real-time interoperability between skin imaging, AI analytics, and print delivery systems.

Emergence of AI-Powered Skin Diagnostics as Input Feedstock

The evolution of AI-driven skin diagnostics is being recognized not just as a feature, but as the foundational input layer for 3D-printed skincare systems. Skin texture, hydration levels, UV damage, and melanin distribution are now being analyzed at micro-resolution using computer vision and neural networks. These insights are being algorithmically translated into precise ingredient maps for real-time 3D printing, ensuring dosage alignment with physiological needs. With APIs linking skin scanners, mobile apps, and printers, a closed-loop system has been created where biological data becomes digital design, then printed reality. This paradigm shift is fueling commercial interest among dermatology chains and tech-native beauty startups aiming to deliver quantifiable results at scale.

Material Compatibility Challenges in Bio-Ink Formulation

Formulation of skin-safe, printable bio-inks remains a key bottleneck in the scale-up of 3D-printed skincare products. Bio-inks must meet dermatological safety standards, possess rheological properties suitable for extrusion, and maintain stability under varied climate conditions all without compromising bioavailability of actives. Incompatibility between printer hardware and emerging bio-ink classes often results in clogging, uneven layering, or delayed curing. As ingredient personalization expands, so too does the complexity of chemical interactions during the print process. Without universal material-machine harmonization, product consistency across geographies and consumer skin types remains a high-risk constraint for mass deployment.
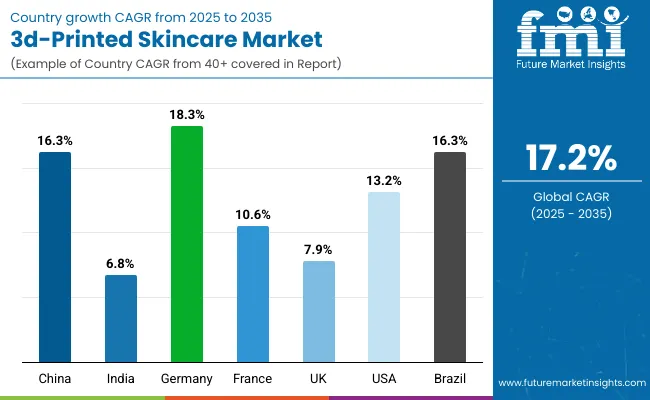
Analysis of 3d-Printed Skincare Market By Key Countries

3d Printed Skincare Market By Country

Countries CAGR
China 16.3%
India 6.8%
Germany 18.3%
France 10.6%
UK 7.9%
USA 13.2%
Brazil 16.3%

The global 3D-Printed Skincare Market demonstrates a clear geographical divergence in growth patterns, shaped by factors such as digital healthcare infrastructure, consumer openness to tech-based personalization, and regulatory adaptability in cosmetic innovation. Asia-Pacific is emerging as the most dynamic region, led by India (18.3% CAGR) and China (16.3% CAGR), where high mobile penetration, growing middle-class spending, and government-backed biotech innovation are catalyzing market readiness. In these countries, startups and conglomerates alike are investing in AI-skin analysis tools integrated with 3D-printable formulations, offering hyper-localized beauty solutions to an increasingly health-conscious population.

Japan, with a 13.2% CAGR, is benefiting from a deeply ingrained skincare culture and strong institutional support for dermatological R&D, driving faster clinic-based adoption. The UK (10.6% CAGR) and Germany (7.9% CAGR) continue to show steady expansion, influenced by Europe's leadership in regulatory compliance, sustainability mandates, and clinical validation of beauty-tech devices.

Meanwhile, the USA, at 6.8% CAGR, reflects a more mature and segmented landscape, where growth is being driven by premium consumer preferences, dermatology-led platforms, and wellness tech integration. Despite slower macro-level adoption, the USA continues to lead in innovation pipelines, strategic partnerships, and connected beauty ecosystems fostering value creation through personalization-as-a-service models.
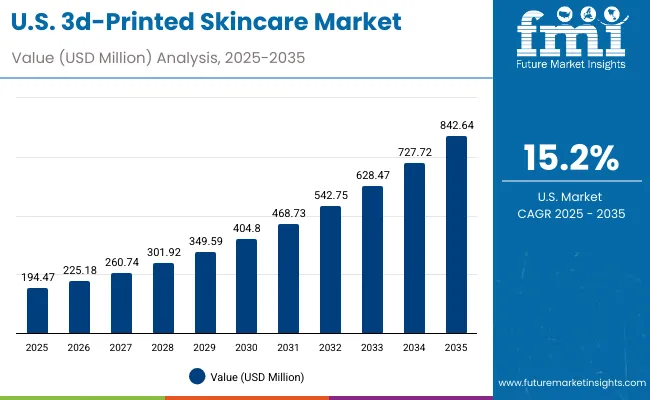
Sales Outlook for 3d-Printed Skincare in the United States

3d Printed Skincare Market Usa

Year USA 3D-Printed Skincare Market (USD Million)
2025 194.47
2026 225.18
2027 260.74
2028 301.92
2029 349.59
2030 404.80
2031 468.73
2032 542.75
2033 628.47
2034 727.72
2035 842.64

The 3D-Printed Skincare Market in the United States is projected to expand at a CAGR of 15.2%, increasing from USD 194.47 million in 2025 to USD 842.64 million by 2035. This growth is being enabled by the rise of dermatology-grade bioprinting, greater AI-driven diagnostics adoption, and custom formulation labs being integrated into skincare clinics and luxury retail experiences.

Consumer preference has shifted toward evidence-based personalization, leading to increasing use of facial mapping and skin simulation before 3D-printed mask or patch generation. A growing number of skin-tech startups have partnered with dermatologists and medical spas to roll out device-based treatment personalization platforms, which are enhancing treatment efficacy and clinical confidence.

  • Bioprinting contributed USD 76.04 million in 2025, with 39.1% market share by technology
  • Clinic-based 3D printing of patches is being scaled as a premium offering in urban centers
  • Luxury retailers are piloting skin kiosks where diagnostic scans trigger on-site product printing
  • Device and software bundling is being offered through subscription-based personalization models

Growth and Expansion Outlook for 3d-Printed Skincare Market in the United Kingdom

The 3D-Printed Skincare Market in the UK is projected to expand at a CAGR of 10.6% between 2025 and 2035, driven by a clinical-grade approach to cosmetic personalization and a highly regulated innovation environment. Adoption has been led by medical spas, dermatology clinics, and luxury skincare houses offering AI-assisted diagnostics and patch printing in-office. Regulatory support from the MHRA has accelerated the pilot testing of dermal bioprinting for skin recovery and anti-aging treatments.

Bioprinting is being leveraged for formulation matching based on genomic data and allergy profiles, a trend visible in London’s skin-tech accelerators. Consumer demand for transparent ingredient sourcing and sustainability is further promoting refillable and printed-on-demand formats.

  • Clinic-grade printing is being bundled with subscription skincare plans
  • Regulations are emphasizing traceability and hypoallergenic formulation design
  • Bioprinting is being validated for dermatological use in NHS-affiliated trials
  • London and Manchester are emerging as skin-tech innovation clusters

Growth and Expansion Outlook for 3d-Printed Skincare Market in India

India’s 3D-Printed Skincare Market is expected to grow at a CAGR of 18.3%, the highest among major markets, driven by urban consumer adoption, startup-led innovations, and affordability-focused printing models. Mobile-first skin diagnostics are being scaled across metros and Tier 2 cities, where consumers are offered customized skincare routines through AI + 3D printing kiosks.

Dermatology chains and D2C beauty platforms have begun offering on-demand personalized face masks, utilizing skin scans uploaded via app or in-store consultation. Regional skin needs such as pigmentation and acne are being addressed through customized patch printing linked with Ayurvedic and cosmeceutical integrations.

  • Fastest-growing global market with deep localization of skin profiles
  • Bioprinting use cases are emerging in mid-tier clinics and e-pharmacies
  • Skin analysis and mask generation are being made available on smartphones
  • Indigenous bio-inks are under development using herbal and mineral bases

Sales Outlook for 3d-Printed Skincare in China

China’s 3D-Printed Skincare Market is forecasted to grow at a CAGR of 16.3%, led by ecosystem integration across e-commerce, social commerce, and in-store experiences. Beauty-tech brands have deployed mini printing stations in major cities, offering on-the-spot customization through facial recognition and dynamic skin condition tracking.

Tmall and JD platforms have begun partnering with skin-tech startups to deliver diagnose-to-doorstep solutions, wherein masks are printed based on scanned data and shipped within hours. Regulatory guidance by NMPA is enabling safe commercialization of bioprinted consumables, with increasing product approvals.
  • Custom skincare printing is embedded in social media-driven retail ecosystems
  • Print-on-demand kiosks are placed inside flagship beauty stores
  • Smart mirrors with diagnostic capability are triggering real-time mask fabrication
  • Domestic innovation hubs in Shenzhen and Hangzhou are leading development

In-depth Analysis of 3d-Printed Skincare in Germany

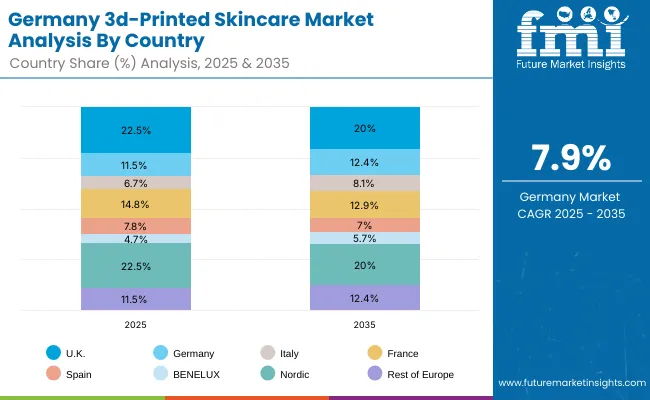
3d Printed Skincare Market Germany

Countries 2025
UK 22.5%
Germany 11.5%
Italy 6.7%
France 14.8%
Spain 7.8%
BNELUX 4.7%
Nordic 22.5%
Rest of Europe 11.5%
Countries 2035
UK 20.0%
Germany 12.4%
Italy 8.1%
France 12.9%
Spain 7.0%
BNELUX 5.7%
Nordic 20.0%
Rest of Europe 12.4%

Germany’s 3D-Printed Skincare Market is expected to grow at a CAGR of 7.9%, shaped by clinical precision, sustainability norms, and rigorous product validation. Integration with cosmeceutical labs and university dermatology departments is driving early-stage adoption of dermal repair patches and AI-matched serums printed in clinical settings.

Growth has been supported by Germany’s preference for ingredient traceability, which is driving interest in real-time printed products that eliminate preservatives. Clinical trials funded through public-private innovation funds are validating the efficacy of 3D-printed skincare for sensitive skin and post-laser recovery protocols.
  • Bioprinting is being explored in skin barrier restoration therapies
  • On-site 3D printers are tested in university-affiliated skin clinics
  • Consumer demand aligns with clean-label, print-on-demand options
  • Germany is influencing EU regulatory dialogue around printed skincare safety

Growth Outlook for 3d-Printed Skincare Market in Japan

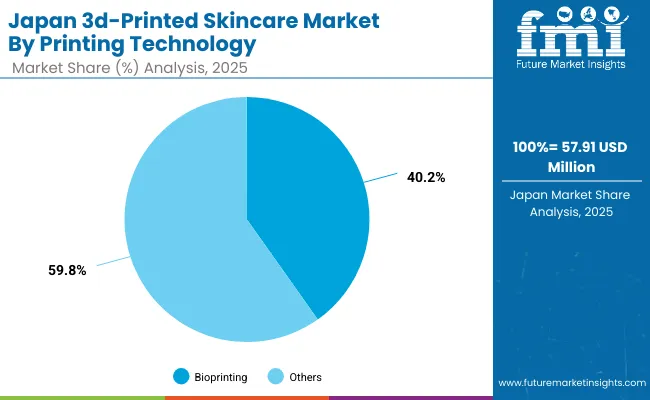
3d Printed Skincare Market Japan

Printing Technology Segment Share (2025) Market Value Share, 2025
Bioprinting 40.2%
Others 59.8%

The 3D-Printed Skincare Market in Japan is projected at USD 57.91 million in 2025, representing 6.7% of the global market. Bioprinting is expected to contribute 40.2%, or approximately USD 23.28 million, while other printing technologies dominate the remaining 59.8%, or USD 34.63 million. This reflects Japan’s clinical precision focus, where deep integration between hardware design and software diagnostics defines innovation.

Growth is being driven by age-focused skincare, a segment prioritized by Japan’s aging population and skin health-conscious consumers. Dermatology clinics are increasingly adopting AI-enabled skin analyzers linked to on-site bioprinting stations, offering customized facial patches and anti-aging masks. Regulatory trust, especially in medical-cosmetic crossovers, is high, encouraging adoption across urban centers like Tokyo and Osaka.

  • Japan is expected to hold 6.7% of global market share in 2025
  • Bioprinting accounts for 40.2%, supported by clinical precision use cases
  • Growth is led by dermal regeneration and anti-aging personalization
  • High trust in regulated beauty-tech is reinforcing market stability

Opportunity Analysis of South Korea 3d-Printed Skincare Market

Printing Technology Segment Share (2025) Market Value Share, 2025
Bioprinting 40.2%
Others 59.8%

The 3D-Printed Skincare Market in South Korea is projected at USD 42.35 million in 2025, accounting for 4.9% of global market value. Bioprinting is estimated to contribute 43.5% (USD 18.42 million), while other printing technologies represent the remaining 56.5% (USD 23.93 million). This share reflects South Korea’s advanced positioning in K-beauty innovation, where hyper-personalized, tech-integrated skincare has already moved into commercial phase.

AI-enabled diagnostics and mobile-integrated 3D skin printers have been widely adopted by leading cosmetics brands, with real-time mask printing already deployed across dermatology clinics and flagship stores. Urban tech centers such as Seoul and Busan are driving pilot projects around dermal repair patches and bio-printed actives, often linked with AR-based skin monitoring.

Supported by government initiatives in biotech R&D and personalized healthcare exports, the South Korean market is expected to scale quickly into East Asian and global channels. Integrated consumer experiences combining diagnostics, data, and real-time formulation are defining the next wave of competition.
  • South Korea is projected to hold 4.9% of global value in 2025
  • Bioprinting accounts for 43.5% of domestic market, led by tech-enabled facial care
  • Retail-integrated skin kiosks and mobile diagnostics are accelerating adoption
  • Exportable personalization platforms are being developed through national biotech grants

Competitive Landscape of 3d-Printed Skincare Market

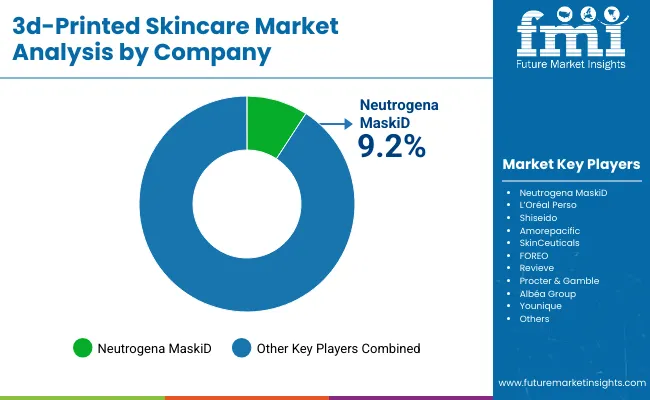
3d Printed Skincare Market By Company

The 3D-Printed Skincare Market is moderately fragmented, with global leaders, mid-sized innovators, and niche-focused digital beauty disruptors competing across highly personalized skincare applications. Leading global brands such as Neutrogena (MaskiD), L’Oréal (Perso), and Shiseido are actively investing in AI-integrated diagnostic engines, skin scanning apps, and bioprinting devices. Neutrogena MaskiD dominates the global market with a 9.2% value share in 2025, and an estimated 8.7% in 2024, attributed to early-mover advantage and mass-market product accessibility.

These large players are setting benchmarks by integrating real-time diagnostics with at-home printing, thus creating an end-to-end ecosystem that combines device hardware, digital consultation, and refillable cartridges. Mid-sized innovators like Amorepacific, SkinCeuticals, FOREO, and Revieve are gaining traction by offering dermatologist-grade formulations, customizable facial masks, and regional ingredient personalization. Their strength lies in agile R&D and targeted offerings across East Asia and North America.

Meanwhile, companies like Younique, Albéa Group, and Procter & Gamble are developing application-specific solutions through private-label printing platforms and retail-personalization models. Their strategies are focused on embedding 3D-printing capability into existing brand ecosystems.

Competitive differentiation is shifting from printing hardware to subscription-based personalization services, cloud-linked diagnostic data, and AR-enabled skincare simulations. Success is being increasingly defined by interoperability between mobile diagnostics, bio-ink chemistry, and printing fidelity.

Key Developments in 3d-Printed Skincare Market

  • In January 2025, South Korea’s K-beauty leadership was recognized for pioneering hyper-personalized skincare, where eco-conscious, AI driven formulations began adapting to individual skin profiles in real time. This milestone signaled that demand for biologically-informed, on-demand product generation was being fuelled by environmental and digital customization expectations.
  • In February 2025, a highly sensitive, self-adhesive DLP3Dprinted oregano hydrogel was demonstrated to be both biocompatible and mechanically robust suitable for extended skin contact and wearable sensors underscoring a materials breakthrough that could be translated into more reliable, long wear personalized skincare delivery platforms.

Scope of the Report

Item Value
Quantitative Units USD 864.3 million (2025 baseline), projected to reach USD 4,213.2 million by 2035
Component Bioprinting Devices, AI Skin Diagnostic Tools, 3D Skin Scanners, Cartridge Systems, Bio-Inks, Customization Software
Application Personalized Masks, On-demand Creams/Serums, Dermal Repair Patches
Product Form Single-use Masks, Cartridge-based Refills, Custom Patch Sheets
End-use Channel E-commerce, Beauty Specialty Stores, Dermatology Clinics, Medispas
Regions Covered North America, Europe, Asia-Pacific, Latin America, Middle East & Africa
Countries Covered United States, Canada, Germany, France, United Kingdom, China, Japan, India, Brazil, South Korea
Key Companies Profiled Neutrogena (MaskiD), L’Oréal Perso, Shiseido, Amorepacific, SkinCeuticals, FOREO, Revieve, Procter & Gamble, Albéa Group, Younique
Additional Attributes Real-time diagnostics and personalization; bio-ink and skin-matching advancements; rise of home-use 3D printing devices; subscription models; refillable mask systems; regulatory and dermatology integration trends
Quantitative Units USD 864.3 million (2025 baseline), projected to reach USD 4,213.2 million by 2035

Key Segments

By Printing Technology:

  • Bioprinting
  • Powder jetting
  • Material extrusion

By Application:

  • Personalized masks
  • On-demand creams/serums
  • Dermal repair & patches

By Product Form:

  • Single-use masks
  • Single-use masks
  • Custom patch sheets

By Distribution Channel:

  • E-commerce
  • Beauty specialty stores
  • Professional dermatology clinics

By Region:

  • North America
  • Latin America
  • Europe
  • East Asia
  • South Asia & Pacific
  • Middle East and Africa

Table of Content

  1. Executive Summary
    • Global Market Outlook
    • Demand-side Trends
    • Supply-side Trends
    • Technology Roadmap Analysis
    • Analysis and Recommendations
  2. Market Overview
    • Market Coverage / Taxonomy
    • Market Definition / Scope / Limitations
  3. Market Background
    • Market Dynamics
      • Drivers
      • Restraints
      • Opportunity
      • Trends
    • Scenario Forecast
      • Demand in Optimistic Scenario
      • Demand in Likely Scenario
      • Demand in Conservative Scenario
    • Opportunity Map Analysis
    • Product Life Cycle Analysis
    • Supply Chain Analysis
      • Supply Side Participants and their Roles
        • Producers
        • Mid-Level Participants (Traders/ Agents/ Brokers)
        • Wholesalers and Distributors
      • Value Added and Value Created at Node in the Supply Chain
      • List of Raw Material Suppliers
      • List of Existing and Potential Buyer’s
    • Investment Feasibility Matrix
    • Value Chain Analysis
      • Profit Margin Analysis
      • Wholesalers and Distributors
      • Retailers
    • PESTLE and Porter’s Analysis
    • Regulatory Landscape
      • By Key Regions
      • By Key Countries
    • Regional Parent Market Outlook
    • Production and Consumption Statistics
    • Import and Export Statistics
  4. Global Market Analysis 2020 to 2024 and Forecast, 2025 to 2035
    • Historical Market Size Value (USD Million) & Volume (Units) Analysis, 2020 to 2024
    • Current and Future Market Size Value (USD Million) & Volume (Units) Projections, 2025 to 2035
      • Y-o-Y Growth Trend Analysis
      • Absolute $ Opportunity Analysis
  5. Global Market Analysis 2020 to 2024 and Forecast 2025 to 2035, By Printing Technology
    • Introduction / Key Findings
    • Historical Market Size Value (USD Million) & Volume (Units) Analysis By Printing Technology, 2020 to 2024
    • Current and Future Market Size Value (USD Million) & Volume (Units) Analysis and Forecast By Printing Technology, 2025 to 2035
      • Bioprinting
      • Powder jetting
      • Material extrusion
    • Y-o-Y Growth Trend Analysis By Printing Technology, 2020 to 2024
    • Absolute $ Opportunity Analysis By Printing Technology, 2025 to 2035
  6. Global Market Analysis 2020 to 2024 and Forecast 2025 to 2035, By Application
    • Introduction / Key Findings
    • Historical Market Size Value (USD Million) & Volume (Units) Analysis By Application, 2020 to 2024
    • Current and Future Market Size Value (USD Million) & Volume (Units) Analysis and Forecast By Application, 2025 to 2035
      • Personalized masks
      • On-demand creams/serums
      • Dermal repair & patches
    • Y-o-Y Growth Trend Analysis By Application, 2020 to 2024
    • Absolute $ Opportunity Analysis By Application, 2025 to 2035
  7. Global Market Analysis 2020 to 2024 and Forecast 2025 to 2035, By Product Form
    • Introduction / Key Findings
    • Historical Market Size Value (USD Million) & Volume (Units) Analysis By Product Form, 2020 to 2024
    • Current and Future Market Size Value (USD Million) & Volume (Units) Analysis and Forecast By Product Form, 2025 to 2035
      • Single-use masks
      • Single-use masks
      • Custom patch sheets
    • Y-o-Y Growth Trend Analysis By Product Form, 2020 to 2024
    • Absolute $ Opportunity Analysis By Product Form, 2025 to 2035
  8. Global Market Analysis 2020 to 2024 and Forecast 2025 to 2035, By Distribution Channel
    • Introduction / Key Findings
    • Historical Market Size Value (USD Million) & Volume (Units) Analysis By Distribution Channel, 2020 to 2024
    • Current and Future Market Size Value (USD Million) & Volume (Units) Analysis and Forecast By Distribution Channel, 2025 to 2035
      • E-commerce
      • Beauty specialty stores
      • Professional dermatology clinics
    • Y-o-Y Growth Trend Analysis By Distribution Channel, 2020 to 2024
    • Absolute $ Opportunity Analysis By Distribution Channel, 2025 to 2035
  9. Global Market Analysis 2020 to 2024 and Forecast 2025 to 2035, By Region
    • Introduction
    • Historical Market Size Value (USD Million) & Volume (Units) Analysis By Region, 2020 to 2024
    • Current Market Size Value (USD Million) & Volume (Units) Analysis and Forecast By Region, 2025 to 2035
      • North America
      • Latin America
      • Europe
      • East Asia
      • South Asia & Pacific
      • Middle East and Africa
    • Market Attractiveness Analysis By Region
  10. North America Market Analysis 2020 to 2024 and Forecast 2025 to 2035, By Country
    • Historical Market Size Value (USD Million) & Volume (Units) Trend Analysis By Market Taxonomy, 2020 to 2024
    • Market Size Value (USD Million) & Volume (Units) Forecast By Market Taxonomy, 2025 to 2035
      • By Country
        • USA
        • Canada
      • By Printing Technology
      • By Application
      • By Product Form
      • By Distribution Channel
    • Market Attractiveness Analysis
      • By Country
      • By Printing Technology
      • By Application
      • By Product Form
      • By Distribution Channel
    • Key Takeaways
  11. Latin America Market Analysis 2020 to 2024 and Forecast 2025 to 2035, By Country
    • Historical Market Size Value (USD Million) & Volume (Units) Trend Analysis By Market Taxonomy, 2020 to 2024
    • Market Size Value (USD Million) & Volume (Units) Forecast By Market Taxonomy, 2025 to 2035
      • By Country
        • Brazil
        • Mexico
        • Colombia
        • Rest of Latin America
      • By Printing Technology
      • By Application
      • By Product Form
      • By Distribution Channel
    • Market Attractiveness Analysis
      • By Country
      • By Printing Technology
      • By Application
      • By Product Form
      • By Distribution Channel
    • Key Takeaways
  12. Europe Market Analysis 2020 to 2024 and Forecast 2025 to 2035, By Country
    • Historical Market Size Value (USD Million) & Volume (Units) Trend Analysis By Market Taxonomy, 2020 to 2024
    • Market Size Value (USD Million) & Volume (Units) Forecast By Market Taxonomy, 2025 to 2035
      • By Country
        • Germany
        • UK
        • France
        • Italy
        • Spain
        • Belgium
        • Netherlands
        • Nordic
        • Switzerland
        • Russia
        • Poland
        • Rest of Europe
      • By Printing Technology
      • By Application
      • By Product Form
      • By Distribution Channel
    • Market Attractiveness Analysis
      • By Country
      • By Printing Technology
      • By Application
      • By Product Form
      • By Distribution Channel
    • Key Takeaways
  13. East Asia Market Analysis 2020 to 2024 and Forecast 2025 to 2035, By Country
    • Historical Market Size Value (USD Million) & Volume (Units) Trend Analysis By Market Taxonomy, 2020 to 2024
    • Market Size Value (USD Million) & Volume (Units) Forecast By Market Taxonomy, 2025 to 2035
      • By Country
        • China
        • Japan
        • South Korea
      • By Printing Technology
      • By Application
      • By Product Form
      • By Distribution Channel
    • Market Attractiveness Analysis
      • By Country
      • By Printing Technology
      • By Application
      • By Product Form
      • By Distribution Channel
    • Key Takeaways
  14. South Asia & Pacific Market Analysis 2020 to 2024 and Forecast 2025 to 2035, By Country
    • Historical Market Size Value (USD Million) & Volume (Units) Trend Analysis By Market Taxonomy, 2020 to 2024
    • Market Size Value (USD Million) & Volume (Units) Forecast By Market Taxonomy, 2025 to 2035
      • By Country
        • India
        • Thailand
        • Malaysia
        • Indonesia
        • Singapore
        • Vietnam
        • Australia
        • New Zealand
        • Rest of South Asia
      • By Printing Technology
      • By Application
      • By Product Form
      • By Distribution Channel
    • Market Attractiveness Analysis
      • By Country
      • By Printing Technology
      • By Application
      • By Product Form
      • By Distribution Channel
    • Key Takeaways
  15. Middle East and Africa Market Analysis 2020 to 2024 and Forecast 2025 to 2035, By Country
    • Historical Market Size Value (USD Million) & Volume (Units) Trend Analysis By Market Taxonomy, 2020 to 2024
    • Market Size Value (USD Million) & Volume (Units) Forecast By Market Taxonomy, 2025 to 2035
      • By Country
        • Turkey
        • UAE
        • Saudi Arabia
        • Israel
        • Other GCC Countries
        • North Africa
        • South Africa
      • By Printing Technology
      • By Application
      • By Product Form
      • By Distribution Channel
    • Market Attractiveness Analysis
      • By Country
      • By Printing Technology
      • By Application
      • By Product Form
      • By Distribution Channel
    • Key Takeaways
  16. Key Countries Market Analysis
    • USA
      • Pricing Analysis
      • Market Share Analysis, 2024
        • By Printing Technology
        • By Application
        • By Product Form
        • By Distribution Channel
    • Canada
      • Pricing Analysis
      • Market Share Analysis, 2024
        • By Printing Technology
        • By Application
        • By Product Form
        • By Distribution Channel
    • Brazil
      • Pricing Analysis
      • Market Share Analysis, 2024
        • By Printing Technology
        • By Application
        • By Product Form
        • By Distribution Channel
    • Mexico
      • Pricing Analysis
      • Market Share Analysis, 2024
        • By Printing Technology
        • By Application
        • By Product Form
        • By Distribution Channel
    • Colombia
      • Pricing Analysis
      • Market Share Analysis, 2024
        • By Printing Technology
        • By Application
        • By Product Form
        • By Distribution Channel
    • Germany
      • Pricing Analysis
      • Market Share Analysis, 2024
        • By Printing Technology
        • By Application
        • By Product Form
        • By Distribution Channel
    • UK
      • Pricing Analysis
      • Market Share Analysis, 2024
        • By Printing Technology
        • By Application
        • By Product Form
        • By Distribution Channel
    • France
      • Pricing Analysis
      • Market Share Analysis, 2024
        • By Printing Technology
        • By Application
        • By Product Form
        • By Distribution Channel
    • Italy
      • Pricing Analysis
      • Market Share Analysis, 2024
        • By Printing Technology
        • By Application
        • By Product Form
        • By Distribution Channel
    • Spain
      • Pricing Analysis
      • Market Share Analysis, 2024
        • By Printing Technology
        • By Application
        • By Product Form
        • By Distribution Channel
    • Belgium
      • Pricing Analysis
      • Market Share Analysis, 2024
        • By Printing Technology
        • By Application
        • By Product Form
        • By Distribution Channel
    • Netherlands
      • Pricing Analysis
      • Market Share Analysis, 2024
        • By Printing Technology
        • By Application
        • By Product Form
        • By Distribution Channel
    • Nordic
      • Pricing Analysis
      • Market Share Analysis, 2024
        • By Printing Technology
        • By Application
        • By Product Form
        • By Distribution Channel
    • Switzerland
      • Pricing Analysis
      • Market Share Analysis, 2024
        • By Printing Technology
        • By Application
        • By Product Form
        • By Distribution Channel
    • Russia
      • Pricing Analysis
      • Market Share Analysis, 2024
        • By Printing Technology
        • By Application
        • By Product Form
        • By Distribution Channel
    • Poland
      • Pricing Analysis
      • Market Share Analysis, 2024
        • By Printing Technology
        • By Application
        • By Product Form
        • By Distribution Channel
    • China
      • Pricing Analysis
      • Market Share Analysis, 2024
        • By Printing Technology
        • By Application
        • By Product Form
        • By Distribution Channel
    • Japan
      • Pricing Analysis
      • Market Share Analysis, 2024
        • By Printing Technology
        • By Application
        • By Product Form
        • By Distribution Channel
    • South Korea
      • Pricing Analysis
      • Market Share Analysis, 2024
        • By Printing Technology
        • By Application
        • By Product Form
        • By Distribution Channel
    • India
      • Pricing Analysis
      • Market Share Analysis, 2024
        • By Printing Technology
        • By Application
        • By Product Form
        • By Distribution Channel
    • Thailand
      • Pricing Analysis
      • Market Share Analysis, 2024
        • By Printing Technology
        • By Application
        • By Product Form
        • By Distribution Channel
    • Indonesia
      • Pricing Analysis
      • Market Share Analysis, 2024
        • By Printing Technology
        • By Application
        • By Product Form
        • By Distribution Channel
    • Australia
      • Pricing Analysis
      • Market Share Analysis, 2024
        • By Printing Technology
        • By Application
        • By Product Form
        • By Distribution Channel
    • New Zealand
      • Pricing Analysis
      • Market Share Analysis, 2024
        • By Printing Technology
        • By Application
        • By Product Form
        • By Distribution Channel
    • Turkey
      • Pricing Analysis
      • Market Share Analysis, 2024
        • By Printing Technology
        • By Application
        • By Product Form
        • By Distribution Channel
    • UAE
      • Pricing Analysis
      • Market Share Analysis, 2024
        • By Printing Technology
        • By Application
        • By Product Form
        • By Distribution Channel
    • Saudi Arabia
      • Pricing Analysis
      • Market Share Analysis, 2024
        • By Printing Technology
        • By Application
        • By Product Form
        • By Distribution Channel
    • Israel
      • Pricing Analysis
      • Market Share Analysis, 2024
        • By Printing Technology
        • By Application
        • By Product Form
        • By Distribution Channel
    • North Africa
      • Pricing Analysis
      • Market Share Analysis, 2024
        • By Printing Technology
        • By Application
        • By Product Form
        • By Distribution Channel
    • South Africa
      • Pricing Analysis
      • Market Share Analysis, 2024
        • By Printing Technology
        • By Application
        • By Product Form
        • By Distribution Channel
  17. Market Structure Analysis
    • Competition Dashboard
    • Competition Benchmarking
    • Market Share Analysis of Top Players
      • By Regional
      • By Printing Technology
      • By Application
      • By Product Form
      • By Distribution Channel
  18. Competition Analysis
    • Competition Deep Dive
      • Neutrogena MaskiD
        • Overview
        • Product Portfolio
        • Profitability by Market Segments (Product/Age /Sales Channel/Region)
        • Sales Footprint
        • Strategy Overview
          • Marketing Strategy
          • Product Strategy
          • Channel Strategy
      • L’Oréal Perso
        • Overview
        • Product Portfolio
        • Profitability by Market Segments (Product/Age /Sales Channel/Region)
        • Sales Footprint
        • Strategy Overview
          • Marketing Strategy
          • Product Strategy
          • Channel Strategy
      • Shiseido
        • Overview
        • Product Portfolio
        • Profitability by Market Segments (Product/Age /Sales Channel/Region)
        • Sales Footprint
        • Strategy Overview
          • Marketing Strategy
          • Product Strategy
          • Channel Strategy
      • Amorepacific
        • Overview
        • Product Portfolio
        • Profitability by Market Segments (Product/Age /Sales Channel/Region)
        • Sales Footprint
        • Strategy Overview
          • Marketing Strategy
          • Product Strategy
          • Channel Strategy
      • SkinCeuticals
        • Overview
        • Product Portfolio
        • Profitability by Market Segments (Product/Age /Sales Channel/Region)
        • Sales Footprint
        • Strategy Overview
          • Marketing Strategy
          • Product Strategy
          • Channel Strategy
      • FOREO
        • Overview
        • Product Portfolio
        • Profitability by Market Segments (Product/Age /Sales Channel/Region)
        • Sales Footprint
        • Strategy Overview
          • Marketing Strategy
          • Product Strategy
          • Channel Strategy
      • Revieve
        • Overview
        • Product Portfolio
        • Profitability by Market Segments (Product/Age /Sales Channel/Region)
        • Sales Footprint
        • Strategy Overview
          • Marketing Strategy
          • Product Strategy
          • Channel Strategy
      • Procter & Gamble
        • Overview
        • Product Portfolio
        • Profitability by Market Segments (Product/Age /Sales Channel/Region)
        • Sales Footprint
        • Strategy Overview
          • Marketing Strategy
          • Product Strategy
          • Channel Strategy
      • Albéa Group
        • Overview
        • Product Portfolio
        • Profitability by Market Segments (Product/Age /Sales Channel/Region)
        • Sales Footprint
        • Strategy Overview
          • Marketing Strategy
          • Product Strategy
          • Channel Strategy
      • Younique
        • Overview
        • Product Portfolio
        • Profitability by Market Segments (Product/Age /Sales Channel/Region)
        • Sales Footprint
        • Strategy Overview
          • Marketing Strategy
          • Product Strategy
          • Channel Strategy
      • Others
        • Overview
        • Product Portfolio
        • Profitability by Market Segments (Product/Age /Sales Channel/Region)
        • Sales Footprint
        • Strategy Overview
          • Marketing Strategy
          • Product Strategy
          • Channel Strategy
  19. Assumptions & Acronyms Used
  20. Research Methodology

List of Tables

  • Table 1: Global Market Value (USD Million) Forecast by Region, 2020-2035
  • Table 2: Global Market Volume (Units) Forecast by Region, 2020-2035
  • Table 3: Global Market Value (USD Million) Forecast by Printing Technology, 2020-2035
  • Table 4: Global Market Volume (Units) Forecast by Printing Technology, 2020-2035
  • Table 5: Global Market Value (USD Million) Forecast by Application, 2020-2035
  • Table 6: Global Market Volume (Units) Forecast by Application, 2020-2035
  • Table 7: Global Market Value (USD Million) Forecast by Product Form, 2020-2035
  • Table 8: Global Market Volume (Units) Forecast by Product Form, 2020-2035
  • Table 9: Global Market Value (USD Million) Forecast by Distribution Channel, 2020-2035
  • Table 10: Global Market Volume (Units) Forecast by Distribution Channel, 2020-2035
  • Table 11: North America Market Value (USD Million) Forecast by Country, 2020-2035
  • Table 12: North America Market Volume (Units) Forecast by Country, 2020-2035
  • Table 13: North America Market Value (USD Million) Forecast by Printing Technology, 2020-2035
  • Table 14: North America Market Volume (Units) Forecast by Printing Technology, 2020-2035
  • Table 15: North America Market Value (USD Million) Forecast by Application, 2020-2035
  • Table 16: North America Market Volume (Units) Forecast by Application, 2020-2035
  • Table 17: North America Market Value (USD Million) Forecast by Product Form, 2020-2035
  • Table 18: North America Market Volume (Units) Forecast by Product Form, 2020-2035
  • Table 19: North America Market Value (USD Million) Forecast by Distribution Channel, 2020-2035
  • Table 20: North America Market Volume (Units) Forecast by Distribution Channel, 2020-2035
  • Table 21: Latin America Market Value (USD Million) Forecast by Country, 2020-2035
  • Table 22: Latin America Market Volume (Units) Forecast by Country, 2020-2035
  • Table 23: Latin America Market Value (USD Million) Forecast by Printing Technology, 2020-2035
  • Table 24: Latin America Market Volume (Units) Forecast by Printing Technology, 2020-2035
  • Table 25: Latin America Market Value (USD Million) Forecast by Application, 2020-2035
  • Table 26: Latin America Market Volume (Units) Forecast by Application, 2020-2035
  • Table 27: Latin America Market Value (USD Million) Forecast by Product Form, 2020-2035
  • Table 28: Latin America Market Volume (Units) Forecast by Product Form, 2020-2035
  • Table 29: Latin America Market Value (USD Million) Forecast by Distribution Channel, 2020-2035
  • Table 30: Latin America Market Volume (Units) Forecast by Distribution Channel, 2020-2035
  • Table 31: Europe Market Value (USD Million) Forecast by Country, 2020-2035
  • Table 32: Europe Market Volume (Units) Forecast by Country, 2020-2035
  • Table 33: Europe Market Value (USD Million) Forecast by Printing Technology, 2020-2035
  • Table 34: Europe Market Volume (Units) Forecast by Printing Technology, 2020-2035
  • Table 35: Europe Market Value (USD Million) Forecast by Application, 2020-2035
  • Table 36: Europe Market Volume (Units) Forecast by Application, 2020-2035
  • Table 37: Europe Market Value (USD Million) Forecast by Product Form, 2020-2035
  • Table 38: Europe Market Volume (Units) Forecast by Product Form, 2020-2035
  • Table 39: Europe Market Value (USD Million) Forecast by Distribution Channel, 2020-2035
  • Table 40: Europe Market Volume (Units) Forecast by Distribution Channel, 2020-2035
  • Table 41: East Asia Market Value (USD Million) Forecast by Country, 2020-2035
  • Table 42: East Asia Market Volume (Units) Forecast by Country, 2020-2035
  • Table 43: East Asia Market Value (USD Million) Forecast by Printing Technology, 2020-2035
  • Table 44: East Asia Market Volume (Units) Forecast by Printing Technology, 2020-2035
  • Table 45: East Asia Market Value (USD Million) Forecast by Application, 2020-2035
  • Table 46: East Asia Market Volume (Units) Forecast by Application, 2020-2035
  • Table 47: East Asia Market Value (USD Million) Forecast by Product Form, 2020-2035
  • Table 48: East Asia Market Volume (Units) Forecast by Product Form, 2020-2035
  • Table 49: East Asia Market Value (USD Million) Forecast by Distribution Channel, 2020-2035
  • Table 50: East Asia Market Volume (Units) Forecast by Distribution Channel, 2020-2035
  • Table 51: South Asia & Pacific Market Value (USD Million) Forecast by Country, 2020-2035
  • Table 52: South Asia & Pacific Market Volume (Units) Forecast by Country, 2020-2035
  • Table 53: South Asia & Pacific Market Value (USD Million) Forecast by Printing Technology, 2020-2035
  • Table 54: South Asia & Pacific Market Volume (Units) Forecast by Printing Technology, 2020-2035
  • Table 55: South Asia & Pacific Market Value (USD Million) Forecast by Application, 2020-2035
  • Table 56: South Asia & Pacific Market Volume (Units) Forecast by Application, 2020-2035
  • Table 57: South Asia & Pacific Market Value (USD Million) Forecast by Product Form, 2020-2035
  • Table 58: South Asia & Pacific Market Volume (Units) Forecast by Product Form, 2020-2035
  • Table 59: South Asia & Pacific Market Value (USD Million) Forecast by Distribution Channel, 2020-2035
  • Table 60: South Asia & Pacific Market Volume (Units) Forecast by Distribution Channel, 2020-2035
  • Table 61: Middle East and Africa Market Value (USD Million) Forecast by Country, 2020-2035
  • Table 62: Middle East and Africa Market Volume (Units) Forecast by Country, 2020-2035
  • Table 63: Middle East and Africa Market Value (USD Million) Forecast by Printing Technology, 2020-2035
  • Table 64: Middle East and Africa Market Volume (Units) Forecast by Printing Technology, 2020-2035
  • Table 65: Middle East and Africa Market Value (USD Million) Forecast by Application, 2020-2035
  • Table 66: Middle East and Africa Market Volume (Units) Forecast by Application, 2020-2035
  • Table 67: Middle East and Africa Market Value (USD Million) Forecast by Product Form, 2020-2035
  • Table 68: Middle East and Africa Market Volume (Units) Forecast by Product Form, 2020-2035
  • Table 69: Middle East and Africa Market Value (USD Million) Forecast by Distribution Channel, 2020-2035
  • Table 70: Middle East and Africa Market Volume (Units) Forecast by Distribution Channel, 2020-2035

List of Figures

  • Figure 1: Global Market Value (USD Million) by Printing Technology, 2025-2035
  • Figure 2: Global Market Value (USD Million) by Application, 2025-2035
  • Figure 3: Global Market Value (USD Million) by Product Form, 2025-2035
  • Figure 4: Global Market Value (USD Million) by Distribution Channel, 2025-2035
  • Figure 5: Global Market Value (USD Million) by Region, 2025-2035
  • Figure 6: Global Market Value (USD Million) Analysis by Region, 2020-2035
  • Figure 7: Global Market Volume (Units) Analysis by Region, 2020-2035
  • Figure 8: Global Market Value Share (%) and BPS Analysis by Region, 2025-2035
  • Figure 9: Global Market Y-o-Y Growth (%) Projections by Region, 2025-2035
  • Figure 10: Global Market Value (USD Million) Analysis by Printing Technology, 2020-2035
  • Figure 11: Global Market Volume (Units) Analysis by Printing Technology, 2020-2035
  • Figure 12: Global Market Value Share (%) and BPS Analysis by Printing Technology, 2025-2035
  • Figure 13: Global Market Y-o-Y Growth (%) Projections by Printing Technology, 2025-2035
  • Figure 14: Global Market Value (USD Million) Analysis by Application, 2020-2035
  • Figure 15: Global Market Volume (Units) Analysis by Application, 2020-2035
  • Figure 16: Global Market Value Share (%) and BPS Analysis by Application, 2025-2035
  • Figure 17: Global Market Y-o-Y Growth (%) Projections by Application, 2025-2035
  • Figure 18: Global Market Value (USD Million) Analysis by Product Form, 2020-2035
  • Figure 19: Global Market Volume (Units) Analysis by Product Form, 2020-2035
  • Figure 20: Global Market Value Share (%) and BPS Analysis by Product Form, 2025-2035
  • Figure 21: Global Market Y-o-Y Growth (%) Projections by Product Form, 2025-2035
  • Figure 22: Global Market Value (USD Million) Analysis by Distribution Channel, 2020-2035
  • Figure 23: Global Market Volume (Units) Analysis by Distribution Channel, 2020-2035
  • Figure 24: Global Market Value Share (%) and BPS Analysis by Distribution Channel, 2025-2035
  • Figure 25: Global Market Y-o-Y Growth (%) Projections by Distribution Channel, 2025-2035
  • Figure 26: Global Market Attractiveness by Printing Technology, 2025-2035
  • Figure 27: Global Market Attractiveness by Application, 2025-2035
  • Figure 28: Global Market Attractiveness by Product Form, 2025-2035
  • Figure 29: Global Market Attractiveness by Distribution Channel, 2025-2035
  • Figure 30: Global Market Attractiveness by Region, 2025-2035
  • Figure 31: North America Market Value (USD Million) by Printing Technology, 2025-2035
  • Figure 32: North America Market Value (USD Million) by Application, 2025-2035
  • Figure 33: North America Market Value (USD Million) by Product Form, 2025-2035
  • Figure 34: North America Market Value (USD Million) by Distribution Channel, 2025-2035
  • Figure 35: North America Market Value (USD Million) by Country, 2025-2035
  • Figure 36: North America Market Value (USD Million) Analysis by Country, 2020-2035
  • Figure 37: North America Market Volume (Units) Analysis by Country, 2020-2035
  • Figure 38: North America Market Value Share (%) and BPS Analysis by Country, 2025-2035
  • Figure 39: North America Market Y-o-Y Growth (%) Projections by Country, 2025-2035
  • Figure 40: North America Market Value (USD Million) Analysis by Printing Technology, 2020-2035
  • Figure 41: North America Market Volume (Units) Analysis by Printing Technology, 2020-2035
  • Figure 42: North America Market Value Share (%) and BPS Analysis by Printing Technology, 2025-2035
  • Figure 43: North America Market Y-o-Y Growth (%) Projections by Printing Technology, 2025-2035
  • Figure 44: North America Market Value (USD Million) Analysis by Application, 2020-2035
  • Figure 45: North America Market Volume (Units) Analysis by Application, 2020-2035
  • Figure 46: North America Market Value Share (%) and BPS Analysis by Application, 2025-2035
  • Figure 47: North America Market Y-o-Y Growth (%) Projections by Application, 2025-2035
  • Figure 48: North America Market Value (USD Million) Analysis by Product Form, 2020-2035
  • Figure 49: North America Market Volume (Units) Analysis by Product Form, 2020-2035
  • Figure 50: North America Market Value Share (%) and BPS Analysis by Product Form, 2025-2035
  • Figure 51: North America Market Y-o-Y Growth (%) Projections by Product Form, 2025-2035
  • Figure 52: North America Market Value (USD Million) Analysis by Distribution Channel, 2020-2035
  • Figure 53: North America Market Volume (Units) Analysis by Distribution Channel, 2020-2035
  • Figure 54: North America Market Value Share (%) and BPS Analysis by Distribution Channel, 2025-2035
  • Figure 55: North America Market Y-o-Y Growth (%) Projections by Distribution Channel, 2025-2035
  • Figure 56: North America Market Attractiveness by Printing Technology, 2025-2035
  • Figure 57: North America Market Attractiveness by Application, 2025-2035
  • Figure 58: North America Market Attractiveness by Product Form, 2025-2035
  • Figure 59: North America Market Attractiveness by Distribution Channel, 2025-2035
  • Figure 60: North America Market Attractiveness by Country, 2025-2035
  • Figure 61: Latin America Market Value (USD Million) by Printing Technology, 2025-2035
  • Figure 62: Latin America Market Value (USD Million) by Application, 2025-2035
  • Figure 63: Latin America Market Value (USD Million) by Product Form, 2025-2035
  • Figure 64: Latin America Market Value (USD Million) by Distribution Channel, 2025-2035
  • Figure 65: Latin America Market Value (USD Million) by Country, 2025-2035
  • Figure 66: Latin America Market Value (USD Million) Analysis by Country, 2020-2035
  • Figure 67: Latin America Market Volume (Units) Analysis by Country, 2020-2035
  • Figure 68: Latin America Market Value Share (%) and BPS Analysis by Country, 2025-2035
  • Figure 69: Latin America Market Y-o-Y Growth (%) Projections by Country, 2025-2035
  • Figure 70: Latin America Market Value (USD Million) Analysis by Printing Technology, 2020-2035
  • Figure 71: Latin America Market Volume (Units) Analysis by Printing Technology, 2020-2035
  • Figure 72: Latin America Market Value Share (%) and BPS Analysis by Printing Technology, 2025-2035
  • Figure 73: Latin America Market Y-o-Y Growth (%) Projections by Printing Technology, 2025-2035
  • Figure 74: Latin America Market Value (USD Million) Analysis by Application, 2020-2035
  • Figure 75: Latin America Market Volume (Units) Analysis by Application, 2020-2035
  • Figure 76: Latin America Market Value Share (%) and BPS Analysis by Application, 2025-2035
  • Figure 77: Latin America Market Y-o-Y Growth (%) Projections by Application, 2025-2035
  • Figure 78: Latin America Market Value (USD Million) Analysis by Product Form, 2020-2035
  • Figure 79: Latin America Market Volume (Units) Analysis by Product Form, 2020-2035
  • Figure 80: Latin America Market Value Share (%) and BPS Analysis by Product Form, 2025-2035
  • Figure 81: Latin America Market Y-o-Y Growth (%) Projections by Product Form, 2025-2035
  • Figure 82: Latin America Market Value (USD Million) Analysis by Distribution Channel, 2020-2035
  • Figure 83: Latin America Market Volume (Units) Analysis by Distribution Channel, 2020-2035
  • Figure 84: Latin America Market Value Share (%) and BPS Analysis by Distribution Channel, 2025-2035
  • Figure 85: Latin America Market Y-o-Y Growth (%) Projections by Distribution Channel, 2025-2035
  • Figure 86: Latin America Market Attractiveness by Printing Technology, 2025-2035
  • Figure 87: Latin America Market Attractiveness by Application, 2025-2035
  • Figure 88: Latin America Market Attractiveness by Product Form, 2025-2035
  • Figure 89: Latin America Market Attractiveness by Distribution Channel, 2025-2035
  • Figure 90: Latin America Market Attractiveness by Country, 2025-2035
  • Figure 91: Europe Market Value (USD Million) by Printing Technology, 2025-2035
  • Figure 92: Europe Market Value (USD Million) by Application, 2025-2035
  • Figure 93: Europe Market Value (USD Million) by Product Form, 2025-2035
  • Figure 94: Europe Market Value (USD Million) by Distribution Channel, 2025-2035
  • Figure 95: Europe Market Value (USD Million) by Country, 2025-2035
  • Figure 96: Europe Market Value (USD Million) Analysis by Country, 2020-2035
  • Figure 97: Europe Market Volume (Units) Analysis by Country, 2020-2035
  • Figure 98: Europe Market Value Share (%) and BPS Analysis by Country, 2025-2035
  • Figure 99: Europe Market Y-o-Y Growth (%) Projections by Country, 2025-2035
  • Figure 100: Europe Market Value (USD Million) Analysis by Printing Technology, 2020-2035
  • Figure 101: Europe Market Volume (Units) Analysis by Printing Technology, 2020-2035
  • Figure 102: Europe Market Value Share (%) and BPS Analysis by Printing Technology, 2025-2035
  • Figure 103: Europe Market Y-o-Y Growth (%) Projections by Printing Technology, 2025-2035
  • Figure 104: Europe Market Value (USD Million) Analysis by Application, 2020-2035
  • Figure 105: Europe Market Volume (Units) Analysis by Application, 2020-2035
  • Figure 106: Europe Market Value Share (%) and BPS Analysis by Application, 2025-2035
  • Figure 107: Europe Market Y-o-Y Growth (%) Projections by Application, 2025-2035
  • Figure 108: Europe Market Value (USD Million) Analysis by Product Form, 2020-2035
  • Figure 109: Europe Market Volume (Units) Analysis by Product Form, 2020-2035
  • Figure 110: Europe Market Value Share (%) and BPS Analysis by Product Form, 2025-2035
  • Figure 111: Europe Market Y-o-Y Growth (%) Projections by Product Form, 2025-2035
  • Figure 112: Europe Market Value (USD Million) Analysis by Distribution Channel, 2020-2035
  • Figure 113: Europe Market Volume (Units) Analysis by Distribution Channel, 2020-2035
  • Figure 114: Europe Market Value Share (%) and BPS Analysis by Distribution Channel, 2025-2035
  • Figure 115: Europe Market Y-o-Y Growth (%) Projections by Distribution Channel, 2025-2035
  • Figure 116: Europe Market Attractiveness by Printing Technology, 2025-2035
  • Figure 117: Europe Market Attractiveness by Application, 2025-2035
  • Figure 118: Europe Market Attractiveness by Product Form, 2025-2035
  • Figure 119: Europe Market Attractiveness by Distribution Channel, 2025-2035
  • Figure 120: Europe Market Attractiveness by Country, 2025-2035
  • Figure 121: East Asia Market Value (USD Million) by Printing Technology, 2025-2035
  • Figure 122: East Asia Market Value (USD Million) by Application, 2025-2035
  • Figure 123: East Asia Market Value (USD Million) by Product Form, 2025-2035
  • Figure 124: East Asia Market Value (USD Million) by Distribution Channel, 2025-2035
  • Figure 125: East Asia Market Value (USD Million) by Country, 2025-2035
  • Figure 126: East Asia Market Value (USD Million) Analysis by Country, 2020-2035
  • Figure 127: East Asia Market Volume (Units) Analysis by Country, 2020-2035
  • Figure 128: East Asia Market Value Share (%) and BPS Analysis by Country, 2025-2035
  • Figure 129: East Asia Market Y-o-Y Growth (%) Projections by Country, 2025-2035
  • Figure 130: East Asia Market Value (USD Million) Analysis by Printing Technology, 2020-2035
  • Figure 131: East Asia Market Volume (Units) Analysis by Printing Technology, 2020-2035
  • Figure 132: East Asia Market Value Share (%) and BPS Analysis by Printing Technology, 2025-2035
  • Figure 133: East Asia Market Y-o-Y Growth (%) Projections by Printing Technology, 2025-2035
  • Figure 134: East Asia Market Value (USD Million) Analysis by Application, 2020-2035
  • Figure 135: East Asia Market Volume (Units) Analysis by Application, 2020-2035
  • Figure 136: East Asia Market Value Share (%) and BPS Analysis by Application, 2025-2035
  • Figure 137: East Asia Market Y-o-Y Growth (%) Projections by Application, 2025-2035
  • Figure 138: East Asia Market Value (USD Million) Analysis by Product Form, 2020-2035
  • Figure 139: East Asia Market Volume (Units) Analysis by Product Form, 2020-2035
  • Figure 140: East Asia Market Value Share (%) and BPS Analysis by Product Form, 2025-2035
  • Figure 141: East Asia Market Y-o-Y Growth (%) Projections by Product Form, 2025-2035
  • Figure 142: East Asia Market Value (USD Million) Analysis by Distribution Channel, 2020-2035
  • Figure 143: East Asia Market Volume (Units) Analysis by Distribution Channel, 2020-2035
  • Figure 144: East Asia Market Value Share (%) and BPS Analysis by Distribution Channel, 2025-2035
  • Figure 145: East Asia Market Y-o-Y Growth (%) Projections by Distribution Channel, 2025-2035
  • Figure 146: East Asia Market Attractiveness by Printing Technology, 2025-2035
  • Figure 147: East Asia Market Attractiveness by Application, 2025-2035
  • Figure 148: East Asia Market Attractiveness by Product Form, 2025-2035
  • Figure 149: East Asia Market Attractiveness by Distribution Channel, 2025-2035
  • Figure 150: East Asia Market Attractiveness by Country, 2025-2035
  • Figure 151: South Asia & Pacific Market Value (USD Million) by Printing Technology, 2025-2035
  • Figure 152: South Asia & Pacific Market Value (USD Million) by Application, 2025-2035
  • Figure 153: South Asia & Pacific Market Value (USD Million) by Product Form, 2025-2035
  • Figure 154: South Asia & Pacific Market Value (USD Million) by Distribution Channel, 2025-2035
  • Figure 155: South Asia & Pacific Market Value (USD Million) by Country, 2025-2035
  • Figure 156: South Asia & Pacific Market Value (USD Million) Analysis by Country, 2020-2035
  • Figure 157: South Asia & Pacific Market Volume (Units) Analysis by Country, 2020-2035
  • Figure 158: South Asia & Pacific Market Value Share (%) and BPS Analysis by Country, 2025-2035
  • Figure 159: South Asia & Pacific Market Y-o-Y Growth (%) Projections by Country, 2025-2035
  • Figure 160: South Asia & Pacific Market Value (USD Million) Analysis by Printing Technology, 2020-2035
  • Figure 161: South Asia & Pacific Market Volume (Units) Analysis by Printing Technology, 2020-2035
  • Figure 162: South Asia & Pacific Market Value Share (%) and BPS Analysis by Printing Technology, 2025-2035
  • Figure 163: South Asia & Pacific Market Y-o-Y Growth (%) Projections by Printing Technology, 2025-2035
  • Figure 164: South Asia & Pacific Market Value (USD Million) Analysis by Application, 2020-2035
  • Figure 165: South Asia & Pacific Market Volume (Units) Analysis by Application, 2020-2035
  • Figure 166: South Asia & Pacific Market Value Share (%) and BPS Analysis by Application, 2025-2035
  • Figure 167: South Asia & Pacific Market Y-o-Y Growth (%) Projections by Application, 2025-2035
  • Figure 168: South Asia & Pacific Market Value (USD Million) Analysis by Product Form, 2020-2035
  • Figure 169: South Asia & Pacific Market Volume (Units) Analysis by Product Form, 2020-2035
  • Figure 170: South Asia & Pacific Market Value Share (%) and BPS Analysis by Product Form, 2025-2035
  • Figure 171: South Asia & Pacific Market Y-o-Y Growth (%) Projections by Product Form, 2025-2035
  • Figure 172: South Asia & Pacific Market Value (USD Million) Analysis by Distribution Channel, 2020-2035
  • Figure 173: South Asia & Pacific Market Volume (Units) Analysis by Distribution Channel, 2020-2035
  • Figure 174: South Asia & Pacific Market Value Share (%) and BPS Analysis by Distribution Channel, 2025-2035
  • Figure 175: South Asia & Pacific Market Y-o-Y Growth (%) Projections by Distribution Channel, 2025-2035
  • Figure 176: South Asia & Pacific Market Attractiveness by Printing Technology, 2025-2035
  • Figure 177: South Asia & Pacific Market Attractiveness by Application, 2025-2035
  • Figure 178: South Asia & Pacific Market Attractiveness by Product Form, 2025-2035
  • Figure 179: South Asia & Pacific Market Attractiveness by Distribution Channel, 2025-2035
  • Figure 180: South Asia & Pacific Market Attractiveness by Country, 2025-2035
  • Figure 181: Middle East and Africa Market Value (USD Million) by Printing Technology, 2025-2035
  • Figure 182: Middle East and Africa Market Value (USD Million) by Application, 2025-2035
  • Figure 183: Middle East and Africa Market Value (USD Million) by Product Form, 2025-2035
  • Figure 184: Middle East and Africa Market Value (USD Million) by Distribution Channel, 2025-2035
  • Figure 185: Middle East and Africa Market Value (USD Million) by Country, 2025-2035
  • Figure 186: Middle East and Africa Market Value (USD Million) Analysis by Country, 2020-2035
  • Figure 187: Middle East and Africa Market Volume (Units) Analysis by Country, 2020-2035
  • Figure 188: Middle East and Africa Market Value Share (%) and BPS Analysis by Country, 2025-2035
  • Figure 189: Middle East and Africa Market Y-o-Y Growth (%) Projections by Country, 2025-2035
  • Figure 190: Middle East and Africa Market Value (USD Million) Analysis by Printing Technology, 2020-2035
  • Figure 191: Middle East and Africa Market Volume (Units) Analysis by Printing Technology, 2020-2035
  • Figure 192: Middle East and Africa Market Value Share (%) and BPS Analysis by Printing Technology, 2025-2035
  • Figure 193: Middle East and Africa Market Y-o-Y Growth (%) Projections by Printing Technology, 2025-2035
  • Figure 194: Middle East and Africa Market Value (USD Million) Analysis by Application, 2020-2035
  • Figure 195: Middle East and Africa Market Volume (Units) Analysis by Application, 2020-2035
  • Figure 196: Middle East and Africa Market Value Share (%) and BPS Analysis by Application, 2025-2035
  • Figure 197: Middle East and Africa Market Y-o-Y Growth (%) Projections by Application, 2025-2035
  • Figure 198: Middle East and Africa Market Value (USD Million) Analysis by Product Form, 2020-2035
  • Figure 199: Middle East and Africa Market Volume (Units) Analysis by Product Form, 2020-2035
  • Figure 200: Middle East and Africa Market Value Share (%) and BPS Analysis by Product Form, 2025-2035
  • Figure 201: Middle East and Africa Market Y-o-Y Growth (%) Projections by Product Form, 2025-2035
  • Figure 202: Middle East and Africa Market Value (USD Million) Analysis by Distribution Channel, 2020-2035
  • Figure 203: Middle East and Africa Market Volume (Units) Analysis by Distribution Channel, 2020-2035
  • Figure 204: Middle East and Africa Market Value Share (%) and BPS Analysis by Distribution Channel, 2025-2035
  • Figure 205: Middle East and Africa Market Y-o-Y Growth (%) Projections by Distribution Channel, 2025-2035
  • Figure 206: Middle East and Africa Market Attractiveness by Printing Technology, 2025-2035
  • Figure 207: Middle East and Africa Market Attractiveness by Application, 2025-2035
  • Figure 208: Middle East and Africa Market Attractiveness by Product Form, 2025-2035
  • Figure 209: Middle East and Africa Market Attractiveness by Distribution Channel, 2025-2035
  • Figure 210: Middle East and Africa Market Attractiveness by Country, 2025-2035

Frequently Asked Questions

How big is the 3D-Printed Skincare Market in 2025?

The global 3D-Printed Skincare Market is estimated to be valued at USD 864.3 million in 2025.

What will be the size of the 3D-Printed Skincare Market in 2035?

The market size for the 3D-Printed Skincare Market is projected to reach USD 4,213.2 million by 2035.

How much will the 3D-Printed Skincare Market grow between 2025 and 2035?

The 3D-Printed Skincare Market is expected to grow at a CAGR of 17.2% between 2025 and 2035.

What are the key product types in the 3D-Printed Skincare Market?

The key product types in the 3D-Printed Skincare Market include bioprinting devices, AI-powered diagnostic tools, 3D skin scanners, cartridge-based systems, and customization software.

Which application segment will contribute significantly to the market in 2025?

In terms of application, personalized masks are expected to dominate with a 46.5% market share in 2025, reflecting strong demand for tailor-made skincare solutions.

Explore Similar Insights

Future Market Insights

3d-Printed Skincare Market