Reports

- Global Locations -

Headquarters

Future Market Insights, Inc.

Christiana Corporate, 200
Continental Drive, Suite 401,
Newark, Delaware - 19713,
United States

T: +1-347-918-3531

Americas

Future Market Insights, Inc.

616 Corporate Way, Suite 2-9018,
Valley Cottage, NY 10989, United States

MEA

Future Market Insights

1602-6 Jumeirah Bay X2 Tower, Plot No: JLT-PH2-X2A,
Jumeirah Lakes Towers, Dubai,
United Arab Emirates

Europe

Future Market Insights

3rd Floor, 207 Regent Street,
W1B 3HH London
United Kingdom

T: + 44 (0) 20 8123 9659

Asia Pacific

Future Market Insights

IndiaLand Global Tech Park, Unit UG-1, Behind Grand HighStreet, Phase 1, Hinjawadi, MH, Pune – 411057, India

3D Printed Dental Brace Market Outlook for 2024 to 2034

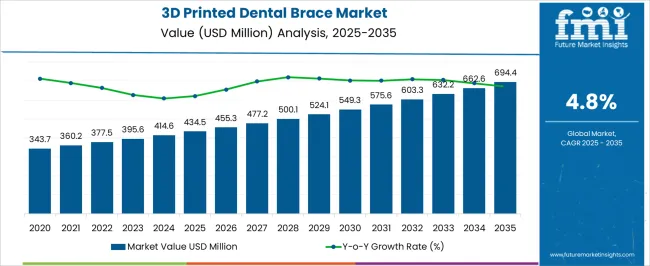
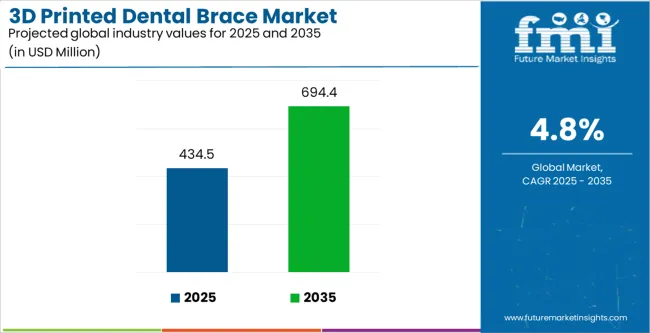
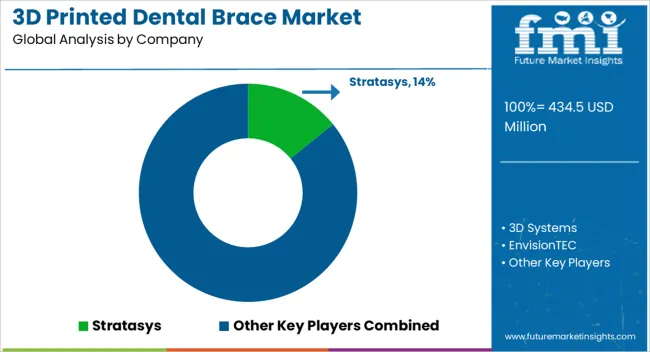
The 3D printed dental brace market is likely to be worth US$ 395.6 million in 2024 and is expected to be valued at US$ 633.9 million by 2034. Between 2024 and 2034, the market is projected to evolve at a compound annual growth rate (CAGR) of 4.8%. The surge in effective and customized orthodontic treatments is driving the market for 3D-printed dental braces.

The increasing demand for customized orthodontic solutions, improvements in 3D printing technology that enable accurate and speedy manufacturing, and growing patient awareness of the advantages of 3D printed braces in terms of comfort and aesthetics drive the global market.

Consumption Analysis of the 3D Printed Dental Brace

  • Dental 3D printing materials are increasingly operated in orthodontics as demand for personalized restorative and orthodontic treatments grows beyond traditional dental functions.
  • Dental 3D printing provides accuracy in orthodontics and cosmetic dentistry, allowing customized solutions to meet each patient's demands. It makes it possible to create tailored braces using precise digital tooth models, leading to more successful orthodontic treatments and a rise in the need for orthodontic products.
  • Dental insurance policies frequently pay for orthodontic braces and other restorative procedures that use 3D printed materials to create personalized orthodontic solutions. As people choose to have more insurance coverage, the demand for custom-fit and precision-fit 3D printed dental braces rises.
  • The medical device business has seen notable market consolidations in recent years. Leading manufacturers of 3D printed dental braces leverage their global product portfolio to grow their company operations through acquisitions and partnerships.
  • By overcoming procedural discomfort and digital workflow, user-friendly 3D printing techniques may cover a variety of dental demands, boost production, shorten fabrication times, and enhance customer satisfaction in dentistry.
Attributes Details
3D Printed Dental Brace Market Value for 2024 US$ 395.6 million
3D Printed Dental Brace Market Size for 2034 US$ 633.9 million
3D Printed Dental Brace Market Forecast CAGR for 2024 to 2034 4.8%

Don't pay for what you don't need

Customize your report by selecting specific countries or regions and save 30%!

Historical Performance and Future Growth of the 3D Printed Dental Brace Market

This section offers a thorough industry analysis over the previous five years, emphasizing the anticipated growth trends for the market for 3D printed dental braces. A 5.7% historical compound annual growth rate indicates a market decline. Up to 2034, the industry is expected to grow at a 4.8%.

Historical CAGR 5.7%
Forecast CAGR 4.8%

Global obstacles affecting the 3D printed dental braces market include medical device regulations and standards, the initial high costs associated with adopting 3D printing technology, and the requirement for extensive patient and dental professional education regarding the advantages and potential applications of 3D printed orthodontic solutions.

Vital factors that are anticipated to upset the demand for 3D printed dental braces through 2034.

  • The widespread application of 3D printed dental braces is hampered by the need to adhere to stringent rules and standards related to medical products.
  • The potentially large initial investment in 3D printing technology and apparatus hinders the cost and accessibility of 3D printed dental braces.
  • Patients' and dentists' need for knowledge about the benefits and potential of 3D printed braces may hinder their widespread acceptance.

Market participants are likely to need to be astute and adaptable during the anticipated period, as these assertive features position the industry for future growth.

Key Trends Influencing the 3D Printed Dental Brace Market

Mounting Desire for Cosmetic Dentistry

Demand for 3D printed dental braces is driven by cosmetic dentistry as patients seek more aesthetically attractive and practical orthodontic treatments. The manufacturing of highly customized and aesthetically pleasing braces is made possible by 3D printing technology, which aligns with the growing need for individualized treatment experiences.

Because of its efficiency and capacity to produce precise, customized designs, 3D printing can potentially revolutionize the field of cosmetic dentistry. By combining cutting-edge technology with aesthetic preferences, orthodontics is changing, becoming more popular, and providing patients with more aesthetically pleasing and comfortable options to achieve a self-assured and striking smile.

Enlargement of Digital Dentistry Amalgamation

Orthodontic procedures are revolutionized by combining 3D printed dental braces with digital dentistry instruments, such as intraoral scanners and CAD software. Intraoral scanners provide exact digital imprints of a patient's teeth, supplying comprehensive information for fabricating a customized brace.

Brace models that are detailed and unique to each patient may be made with CAD software. From concept to fabrication, the whole manufacturing process is streamlined by this digital integration, guaranteeing accuracy and productivity. Digital design refinement allows dentists to optimize treatment regimens and minimize manual mistakes.

Combining digital dentistry with 3D printing is expected to increase treatment accuracy, speed up production, and elevate the bar for orthodontic care throughout the projected period.

Spurring Demand for Dental Aesthetic

Orthodontic treatment is changing due to the focus on patient comfort and aesthetics, with 3D printed dental braces emerging as a key component. These braces, which enable highly adjustable and aesthetically pleasing designs, are meeting the increased demand for orthodontic treatments that improve overall attractiveness and repair oral disorders.

In contrast to traditional braces, 3D printed braces offer a more streamlined and covert solution that alleviates worries about orthodontic hardware being visible. Owing to the precise precision made possible by 3D printing technology, the braces are tailored to each patient's unique dental anatomy, maximizing functionality and aesthetics.

When new materials are employed, thinner, stronger structures may be made, and patients are delighted with the cosmetic outcome of treatment and have a more comfortable orthodontic experience.

Sabyasachi Ghosh
Sabyasachi Ghosh

Principal Consultant

Talk to Analyst

Find your sweet spots for generating winning opportunities in this market.

Comparative View of the Adjacent 3D Printed Dental Brace Market

This section compares the 3D printed dental brace, dental 3D printing material, and dental device markets. The report examines each market from 2024 to 2034, highlighting key trends, prospects for development, and compound annual growth rate.

3D Printed Dental Brace Market:

Attributes 3D Printed Dental Brace Market
CAGR (2024 to 2034) 4.8%
Opportunity The dental industry can offer more comfortable dental adjustment devices
Key Trends Growing trend of cosmetic dentistry

Dental 3D Printing Material Market:

Attributes Dental 3D Printing Material Market
CAGR (2023 to 2033) 3.4%
Opportunity Market players can offer sustainable and inexpensive materials
Key Trends Utilization of reusable dental polymers for the operations

3D Printing Dental Device Market:

Attributes 3D Printing Dental Device Market
CAGR (2023 to 2033) 4.6%
Opportunity Market players can develop personalized dental devices
Key Trends Development in digital dental applications

Category-wise Insights

Comprehensive reviews of certain dental brace industry segments are presented in this section. The two primary topics of the present study are the dental laboratory and the metal braces segments.

Metal Braces Embraces the 3D Printed Dental Brace Industry

Attributes Details
Top Material Type Metal Braces
CAGR from 2024 to 2034 2.7%

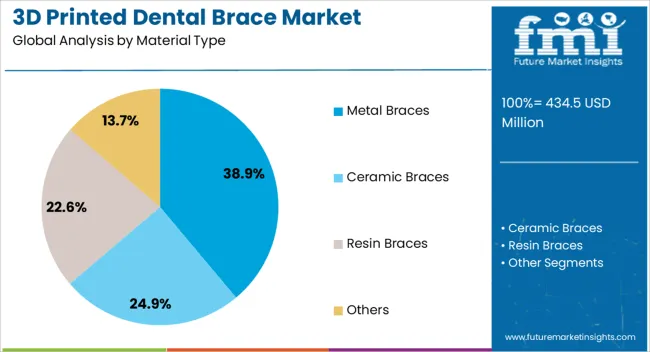
The demand for metal braces is likely to rule the 3D printed dental brace market, with a promising share of 38.9%; the metal braces segment is likely to develop with a sluggish CAGR of 2.7%. There are several reasons for this inclination for metal braces for the dental materials:

  • Metal braces are among the popular material types as they are the least costly and have been around the longest.
  • Braces are constructed from brackets linked by a thin, tight wire and attach individually to teeth.
  • An orthodontist moves teeth until they are straight as part of treatment, making corrections regularly.
  • High resilience, high yield strength, high stiffness, biocompatibility, and corrosion resistance are other advantages of metal braces.
  • Metal braces have long been effectively used in orthodontics. Since they are accustomed to its characteristics, orthodontists are more likely to use and accept metal in the forthcoming decade.

Dental Laboratories Ripens the 3D Printed Dental Brace Need

Attributes Details
Top End User Dental Laboratories
CAGR from 2024 to 2034 4.7%

The utilization of 3D printed dental braces in dental laboratories expands its market share to 39.2%, with a forecasted CAGR of 4.7% in the forthcoming decade. This superiority can be described as follows:

  • The growth of the dental laboratories segment is significantly supplemented by the rising adoption of advanced technologies, particularly 3D bioprinting, in laboratory settings.
  • The expansion in dental laboratories, coupled with a trend toward outsourcing diverse manufacturing functions to these facilities, is a key factor propelling the demand for dental 3D printing technologies.
  • The increased need for fabricated and customized dental framing solutions across various applications drives the adoption of advanced printing techniques within dental labs.
  • The development of dental 3D printing technologies is expected to meet evolving dental application needs, reflecting a significant shift toward new technology in the 3D printed dental braces industry.

Get the data you need at a Fraction of the cost

Personalize your report by choosing insights you need
and save 40%!

Country-wise Insights

This section examines the 3D printed dental brace markets in many countries, such as the United States, China, India, Germany, and the United Kingdom. It explores the aspects influencing 3D printed dental braces' demand, acceptance, and sales in particular countries.
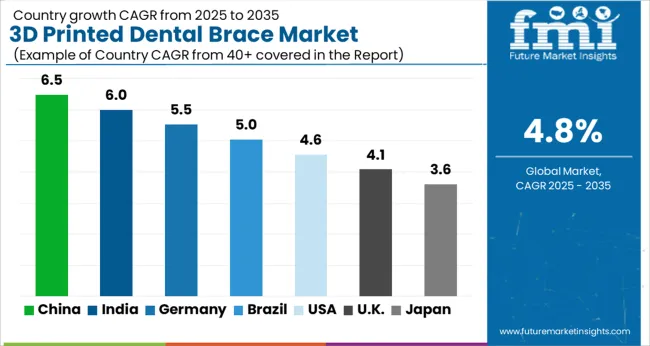
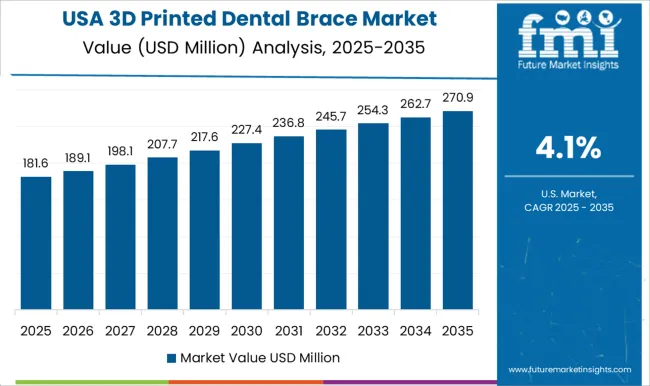
Countries CAGR from 2024 to 2034
United States 3.7%
Germany 4.5%
United Kingdom 4.0%
India 9.4%
China 8.2%

Progress in the 3D Printed Dental Brace Demand in the United States

Through 2034, the demand for a 3D printed dental brace in the United States is anticipated to increase at a CAGR of 3.7%, acquiring a valuation of US$ 120.2 million. Several of the key trends are as follows:

  • The United States is a leader in dental and healthcare technological innovation, particularly in orthodontics.
  • Advancements in 3D printing technology have empowered dental professionals in the United States to achieve unprecedented precision in customizing dental braces, aligners, and other orthodontic devices.
  • Through the utilization of digital impressions or scans of patients' teeth, virtual models are meticulously crafted.
  • This digital approach enables orthodontists to create highly individualized braces that conform precisely to each patient's teeth' unique contours.
  • In the United States, orthodontic solutions are customized to each patient's demands and anatomy, leading to better therapy outcomes and satisfied clients.

German Oral Care Sector Found Cutting-edge Dental Braces

The demand for 3D printed dental braces in Germany is anticipated to expand at a compound annual growth rate of 4.5% through 2034, reaching a valuation of US$ 24.9 million by that year. The following factors fuel this rapid growth:

  • Continuous emphasis on technological innovation positions the German dental industry as a leader in developing advanced equipment and digital solutions for dental practices and laboratories.
  • Prioritizing education and training programs reflects a commitment to keeping dental professionals updated on the latest technologies and methodologies, ensuring a skilled workforce that effectively utilizes cutting-edge tools.
  • German dental companies have a robust global market presence, exporting diverse dental products and technologies to countries globally. This international outreach underscores the industry's competitiveness and influence on a global scale.

Chinese Chews Down the Customized Endodontics Industry

China is experiencing a surge in demand for a 3D printed dental brace, with a valuation of US$ 87.5 million alongside a predicted CAGR of 8.2% through 2034. Some of the primary drivers include:

  • Dental product manufacturers in China are recognized for their commitment to precision engineering, producing top-tier dental instruments, high-quality materials, and advanced prosthetics.
  • The dental industry in China is shifting toward patient-centric approaches, with manufacturers prioritizing clinical effectiveness and enhancing the overall patient experience during dental treatments.
  • Dental equipment suppliers significantly impact the global market. Their products are exported to various countries, showcasing the industry's expanding reach and influence.
  • The industry is embracing innovation, with a growing emphasis on adopting new technologies to enhance the efficiency of dental processes and contribute to the overall advancement of dental care.

Demand for Dental Braces Skyrockets in the United Kingdom

The United Kingdom is seeing an increase in demand for 3D printed dental braces, estimated at US$ 19.9 million, with a predicted CAGR of 4.0% through 2034. Among the main trends are:

  • In the United Kingdom, dental professionals and patients are becoming more aware of the advantages and personalization choices of 3D printed braces.
  • The United Kingdom tends to adopt cutting-edge technology, and in orthodontics, 3D printing is becoming increasingly popular for creating braces.
  • Demand for 3D printed dental braces is rising in the United Kingdom as treatment decisions are influenced by referrals from friends and family, positive feedback, and greater patient satisfaction.

The 3D Bioprinting influences the Dental Industry in India

The 3D printed dental brace market is expanding in India with an estimated CAGR of 9.4% and a valuation of US$ 94.5 million through 2034. Here are a few of the ongoing trends:
  • The Indian population's growing awareness of dental health and aesthetics has significantly influenced the demand for orthodontic treatments.
  • This indicates a shift from practical considerations to a desire for aesthetically pleasing solutions that enhance well-being and self-expression.
  • Dental health in India has evolved from treating functional issues to promoting dental aesthetics due to global beauty standards, educational programs, and awareness campaigns.
  • The growing demand for orthodontic treatment in India is driven by a shift in cultural priorities towards functional correction and achieving aesthetically beautiful smiles, driven by increased knowledge of dental health and aesthetics.

Establishments Shaping the Outlook of the 3D Printed Dental Brace Industry

Dental organizations play a pivotal role in shaping the outlook of the 3D printed dental brace industry through various key factors. Research and development institutions contribute significantly by driving innovation in materials and printing technologies, advancing dental braces' precision and customization capabilities.

Both independent and affiliated with healthcare institutions, dental laboratories serve as crucial manufacturing hubs, integrating 3D printing into their workflows to produce tailored orthodontic solutions.

Academic institutions and training centers play a role in educating dental professionals on the latest advancements, ensuring a skilled workforce capable of leveraging 3D printing technologies effectively.

Regulatory agencies and groups that set industry standards also contribute to developing policies that guarantee the effectiveness and safety of 3D printed braces. Together, these companies' cooperation and synergy impact the direction of the 3D printed dental brace market, driving developments, uptake, and expansion.

Recent Developments in the 3D Printed Dental Brace Industry:

  • In August 2023, LightForce Orthodontics received US$ 80 million to develop 3D printed braces to provide personalized care, scale production, and utilize AI in digital workflows for optimal patient solutions.
  • In April 2023, SprintRay collaborated with Braces On Demand to produce orthodontic brackets and fixed appliances in the office using the SprintRay 3D printing ecosystem in under 30 minutes.
  • In March 2023, Smile Health Orthodontics (SHO) introduced 3D printed clear aligners and lightForce ceramic braces, which provide patients with safety and comfort and enable faster treatment than traditional metal braces.

Key Companies in the 3D Printed Dental Brace Market

  • Stratasys
  • 3D Systems
  • EnvisionTEC
  • Carbon
  • Formlabs
  • Renishaw
  • DWS Systems
  • Prodways
  • PowerResins
  • SprintRay GmbH
  • Deutsche Edelstahlwerke
  • dentona AG
  • Nexa3D
  • SAREMCO Dental AG
  • Nagase ChemteX Corporation
  • NextDent B.V.
  • LuxCreo, Inc.
  • Desktop Metal, Inc.
  • DentaFab

Key Segments

By Material Type:

  • Metal Braces
    • Non-Precious Metal Alloys
      • Cobalt Chromium Alloy
      • Ti-Based Alloys
      • Stainless Steel
    • Precious Metal Alloys
  • Ceramic Braces
  • Resin Braces
  • Others

By End User:

  • Dental Clinics
  • Dental Laboratories
  • Academic & Research Institutes
  • Hospitals
  • Others

By Region:

  • North America
  • Latin America
  • Europe
  • East Asia
  • South Asia
  • Oceania
  • The Middle East and Africa

Frequently Asked Questions

How Big is the 3D Printed Dental Brace Market?

The 3D printed dental brace market is expected to have a value of US$ 395.6 million in 2024.

What was the Historical Performance of the Market?

The demand for 3D printed dental braces grew at a 5.7% annual pace between 2019 and 2024.

What is the Growth Outlook of the 3D Printed Dental Brace Market in India?

The market is likely to register a growth of 9.4% in India through 2034.

What is the 3D Printed Dental Brace Market Growth Outlook for 2034?

The 3D printed dental brace market is anticipated to surpass US$ 633.9 billion by 2034.

What is the Sales Outlook for the 3D Printed Dental Brace from 2024 to 2034?

The 3D printed dental brace industry is anticipated to grow at a rate of 4.8% from 2024 to 2034.

Table of Content

1. Executive Summary

    1.1. Global Market Outlook

    1.2. Demand Side Trends

    1.3. Supply-Side Side Trends

    1.4. Analysis and Recommendations

2. Market Overview

    2.1. Market Coverage / Taxonomy

    2.2. Market Definition / Scope / Limitations

    2.3. Inclusions and Exclusions

3. Key Market Trends

    3.1. Key Trends Impacting the Market

    3.2. Material Type Innovation / Development Trends

4. Value Added Insights

    4.1. Material Type Assessment

        4.1.1. Material Type Adoption Analysis

        4.1.2. Material Type USP's/Features Analysis

        4.1.3. Recent Material Type Launches and Innovations

    4.2. Regulatory Scenario

        4.2.1. Regulatory Frameworks in USA

        4.2.2. Regulatory Frameworks in Canada

        4.2.3. Regulatory Frameworks in Europe

        4.2.4. Regulatory Frameworks in India

        4.2.5. Regulatory Frameworks in China

        4.2.6. Regulatory Frameworks in Australia

        4.2.7. Regulatory Frameworks in Middle East & Africa

    4.3. Diseases Epidemiology

    4.4. Value Chain Analysis

    4.5. PESTLE Analysis

    4.6. Porter’s Analysis

5. Market Background

    5.1. Macro-Economic Factors

        5.1.1. Global Healthcare R&D Expenditure

        5.1.2. R&D funding By Region & Country

        5.1.3. Global Orthodontics Market Outlook

    5.2. Forecast Factors - Relevance & Impact

        5.2.1. Increase in Global Healthcare Expenditure

        5.2.2. Development of Unique Materials and Technologies

        5.2.3. Technological Advancement

        5.2.4. Rising Adoption of Universal Health Coverage

        5.2.5. Cost of Material

        5.2.6. Growing Number of Dental Treatment Sites

        5.2.7. New Material Type Launches and Approvals

        5.2.8. Top Companies’ Historical Growth

    5.3. Market Dynamics

        5.3.1. Drivers

        5.3.2. Restraints

        5.3.3. Opportunity Analysis

6. Global Market Demand (in Value or Size in US$ Million) Analysis 2018 to 2023 and Forecast, 2024 to 2034

    6.1. Revenue Opportunity Scenarios – Likely/Conservative/Optimistic

    6.2. Historical Market Value (US$ Million) Analysis 2018 to 2023

    6.3. Current and Future Market Value (US$ Million) Projections, 2024 to 2034

        6.3.1. Y-o-Y Growth Trend Analysis

        6.3.2. Absolute $ Opportunity Analysis

7. Global Market Analysis 2018 to 2023 and Forecast 2024 to 2034, By Material type

    7.1. Introduction / Key Findings

    7.2. Historical Market Size (US$ Million) Analysis By Material type, 2018 to 2023

    7.3. Current and Future Market Size (US$ Million) Analysis and Forecast By Material type, 2024 to 2034

        7.3.1. Metal Braces

            7.3.1.1. Non-Precious Metal Alloys

                7.3.1.1.1. Cobalt Chromium Alloy

                7.3.1.1.2. Ti-Based Alloys

                7.3.1.1.3. Stainless Steel

            7.3.1.2. Precious Metal Alloys

        7.3.2. Ceramic Braces

        7.3.3. Resin Braces

        7.3.4. Others

    7.4. Market Attractiveness Analysis By Material type

8. Global Market Analysis 2018 to 2023 and Forecast 2024 to 2034, By End User

    8.1. Introduction / Key Findings

    8.2. Historical Market Size (US$ Million) Analysis By End User, 2018 to 2023

    8.3. Current and Future Market Size (US$ Million) Analysis and Forecast By End User, 2024 to 2034

        8.3.1. Dental Clinics

        8.3.2. Dental Laboratories

        8.3.3. Academic & Research Institutes

        8.3.4. Hospitals

        8.3.5. Others

    8.4. Market Attractiveness Analysis By End User

9. Global Market Analysis 2018 to 2023 and Forecast 2024 to 2034, by Region

    9.1. Introduction

    9.2. Historical Market Size (US$ Million) Analysis By Region, 2018 to 2023

    9.3. Current and Future Market Size (US$ Million) Analysis and Forecast By Region, 2024 to 2034

        9.3.1. North America

        9.3.2. Latin America

        9.3.3. East Asia

        9.3.4. South Asia & Pacific

        9.3.5. Western Europe

        9.3.6. Eastern Europe

        9.3.7. Middle East & Africa

    9.4. Market Attractiveness Analysis By Region

10. North America Market Analysis 2018 to 2023 and Forecast 2024 to 2034

    10.1. Introduction

    10.2. Historical Market Size (US$ Million) Analysis By Market Taxonomy, 2018 to 2023

    10.3. Current and Future Market Size (US$ Million) Analysis and Forecast By Market Taxonomy, 2024 to 2034

        10.3.1. By Country

            10.3.1.1. USA

            10.3.1.2. Canada

            10.3.1.3. Mexico

        10.3.2. By Material type

        10.3.3. By End User

    10.4. Market Attractiveness Analysis

        10.4.1. By Country

        10.4.2. By Material type

        10.4.3. By End User

    10.5. Market Trends

    10.6. Key Market Participants - Intensity Mapping

    10.7. Drivers and Restraints - Impact Analysis

    10.8. Country Level Analysis & Forecast

        10.8.1. USA Market

            10.8.1.1. Introduction

            10.8.1.2. Market Analysis and Forecast by Market Taxonomy

                10.8.1.2.1. By Material type

                10.8.1.2.2. By End User

        10.8.2. Canada Market

        10.8.3. Introduction

        10.8.4. Market Analysis and Forecast by Market Taxonomy

            10.8.4.1. By Material type

            10.8.4.2. By End User

        10.8.5. Mexico Market

        10.8.6. Introduction

        10.8.7. Market Analysis and Forecast by Market Taxonomy

            10.8.7.1. By Material type

            10.8.7.2. By End User

11. Latin America Market Analysis 2018 to 2023 and Forecast 2024 to 2034

    11.1. Introduction

    11.2. Historical Market Size (US$ Million) Analysis By Market Taxonomy, 2018 to 2023

    11.3. Current and Future Market Size (US$ Million) Analysis and Forecast By Market Taxonomy, 2024 to 2034

        11.3.1. By Country

            11.3.1.1. Brazil

            11.3.1.2. Chile

            11.3.1.3. Rest of Latin America

        11.3.2. By Material type

        11.3.3. End User

    11.4. Market Attractiveness Analysis

        11.4.1. By Country

        11.4.2. By Material type

        11.4.3. By End User

    11.5. Market Trends

    11.6. Key Market Participants - Intensity Mapping

    11.7. Drivers and Restraints - Impact Analysis

    11.8. Country Level Analysis & Forecast

        11.8.1. Brazil Market

            11.8.1.1. Introduction

            11.8.1.2. Market Analysis and Forecast by Market Taxonomy

                11.8.1.2.1. By Material type

                11.8.1.2.2. By End User

        11.8.2. Chile Market

            11.8.2.1. Introduction

            11.8.2.2. Market Analysis and Forecast by Market Taxonomy

                11.8.2.2.1. By Material type

                11.8.2.2.2. By End User

12. East Asia Market Analysis 2018 to 2023 and Forecast 2024 to 2034

    12.1. Introduction

    12.2. Historical Market Size (US$ Million) Analysis By Market Taxonomy, 2018 to 2023

    12.3. Current and Future Market Size (US$ Million) Analysis and Forecast By Market Taxonomy, 2024 to 2034

        12.3.1. By Country

            12.3.1.1. China

            12.3.1.2. Japan

            12.3.1.3. South Korea

        12.3.2. By Material type

        12.3.3. By End User

    12.4. Market Attractiveness Analysis

        12.4.1. By Country

        12.4.2. By Material type

        12.4.3. By End User

    12.5. Market Trends

    12.6. Key Market Participants - Intensity Mapping

    12.7. Drivers and Restraints - Impact Analysis

    12.8. Country Level Analysis & Forecast

        12.8.1. China Market

            12.8.1.1. Introduction

            12.8.1.2. Market Analysis and Forecast by Market Taxonomy

                12.8.1.2.1. By Material type

                12.8.1.2.2. By End User

        12.8.2. Japan Market

            12.8.2.1. Introduction

            12.8.2.2. Market Analysis and Forecast by Market Taxonomy

                12.8.2.2.1. By Material type

                12.8.2.2.2. By End User

        12.8.3. South Korea Market

            12.8.3.1. Introduction

            12.8.3.2. Market Analysis and Forecast by Market Taxonomy

                12.8.3.2.1. By Material type

                12.8.3.2.2. By End User

13. South Asia & Pacific Market Analysis 2018 to 2023 and Forecast 2024 to 2034

    13.1. Introduction

    13.2. Historical Market Size (US$ Million) Analysis By Market Taxonomy, 2018 to 2023

    13.3. Current and Future Market Size (US$ Million) Analysis and Forecast By Market Taxonomy, 2024 to 2034

        13.3.1. By Country

            13.3.1.1. India

            13.3.1.2. ASEAN Countries

            13.3.1.3. Australia & New Zealand

            13.3.1.4. Rest of South Asia & Pacific

        13.3.2. By Material type

        13.3.3. By End User

    13.4. Market Attractiveness Analysis

        13.4.1. By Country

        13.4.2. By Material type

        13.4.3. By End User

    13.5. Market Trends

    13.6. Key Market Participants - Intensity Mapping

    13.7. Drivers and Restraints - Impact Analysis

    13.8. Country Level Analysis & Forecast

        13.8.1. India Market

            13.8.1.1. Introduction

            13.8.1.2. Market Analysis and Forecast by Market Taxonomy

                13.8.1.2.1. By Material type

                13.8.1.2.2. By End User

        13.8.2. ASEAN Countries Market

            13.8.2.1. Introduction

            13.8.2.2. Market Analysis and Forecast by Market Taxonomy

                13.8.2.2.1. By Material type

                13.8.2.2.2. By End User

        13.8.3. Australia & New Zealand Market

            13.8.3.1. Introduction

            13.8.3.2. Market Analysis and Forecast by Market Taxonomy

                13.8.3.2.1. By Material type

                13.8.3.2.2. By End User

14. Western Europe Market Analysis 2018 to 2023 and Forecast 2024 to 2034

    14.1. Introduction

    14.2. Historical Market Size (US$ Million) Analysis By Market Taxonomy, 2018 to 2023

    14.3. Current and Future Market Size (US$ Million) Analysis and Forecast By Market Taxonomy, 2024 to 2034

        14.3.1. By Country

            14.3.1.1. Germany

            14.3.1.2. Italy

            14.3.1.3. France

            14.3.1.4. UK

            14.3.1.5. Spain

            14.3.1.6. BENELUX

            14.3.1.7. Nordic Countries

            14.3.1.8. Rest of Western Europe

        14.3.2. By Material type

        14.3.3. By End User

    14.4. Market Attractiveness Analysis

        14.4.1. By Country

        14.4.2. By Material type

        14.4.3. By End User

    14.5. Market Trends

    14.6. Key Market Participants - Intensity Mapping

    14.7. Drivers and Restraints - Impact Analysis

    14.8. Country Level Analysis & Forecast

        14.8.1. Germany Market

            14.8.1.1. Introduction

            14.8.1.2. Market Analysis and Forecast by Market Taxonomy

                14.8.1.2.1. By Material type

                14.8.1.2.2. By End User

        14.8.2. Italy Market

            14.8.2.1. Introduction

            14.8.2.2. Market Analysis and Forecast by Market Taxonomy

                14.8.2.2.1. By Material type

                14.8.2.2.2. By End User

        14.8.3. France Market

            14.8.3.1. Introduction

            14.8.3.2. Market Analysis and Forecast by Market Taxonomy

                14.8.3.2.1. By Material type

                14.8.3.2.2. By End User

        14.8.4. UK Market

            14.8.4.1. Introduction

            14.8.4.2. Market Analysis and Forecast by Market Taxonomy

                14.8.4.2.1. By Material type

                14.8.4.2.2. By End User

        14.8.5. Spain Market

            14.8.5.1. Introduction

            14.8.5.2. Market Analysis and Forecast by Market Taxonomy

                14.8.5.2.1. By Material type

                14.8.5.2.2. By End User

        14.8.6. BENELUX Market

            14.8.6.1. Introduction

            14.8.6.2. Market Analysis and Forecast by Market Taxonomy

                14.8.6.2.1. By Material type

                14.8.6.2.2. By End User

        14.8.7. Nordic Countries Market

            14.8.7.1. Introduction

            14.8.7.2. Market Analysis and Forecast by Market Taxonomy

                14.8.7.2.1. By Material type

                14.8.7.2.2. By End User

15. Eastern Europe Market Analysis 2018 to 2023 and Forecast 2024 to 2034

    15.1. Introduction

    15.2. Historical Market Size (US$ Million) Analysis By Market Taxonomy, 2018 to 2023

    15.3. Current and Future Market Size (US$ Million) Analysis and Forecast By Market Taxonomy, 2024 to 2034

        15.3.1. By Country

            15.3.1.1. Russia

            15.3.1.2. Hungary

            15.3.1.3. Poland

            15.3.1.4. Rest of Eastern Europe

        15.3.2. By Material type

        15.3.3. By End User

    15.4. Market Attractiveness Analysis

        15.4.1. By Material type

        15.4.2. By End User

    15.5. Market Trends

    15.6. Key Market Participants - Intensity Mapping

    15.7. Drivers and Restraints - Impact Analysis

    15.8. Country Level Analysis & Forecast

        15.8.1. Russia Market

            15.8.1.1. Introduction

            15.8.1.2. Market Analysis and Forecast by Market Taxonomy

                15.8.1.2.1. By Material type

                15.8.1.2.2. By End User

        15.8.2. Hungary Market

            15.8.2.1. Introduction

            15.8.2.2. Market Analysis and Forecast by Market Taxonomy

                15.8.2.2.1. By Material type

                15.8.2.2.2. By End User

        15.8.3. Poland Market

            15.8.3.1. Introduction

            15.8.3.2. Market Analysis and Forecast by Market Taxonomy

                15.8.3.2.1. By Material type

                15.8.3.2.2. By End User

16. Middle East and Africa Market Analysis 2018 to 2023 and Forecast 2024 to 2034

    16.1. Introduction

    16.2. Historical Market Size (US$ Million) Analysis By Market Taxonomy, 2018 to 2023

    16.3. Current and Future Market Size (US$ Million) Analysis and Forecast By Market Taxonomy, 2024 to 2034

        16.3.1. By Country

            16.3.1.1. Saudi Arabia

            16.3.1.2. Türkiye

            16.3.1.3. South Africa

            16.3.1.4. Other African Union

            16.3.1.5. Rest of Middle East & Africa

        16.3.2. By Material type

        16.3.3. By End User

    16.4. Market Attractiveness Analysis

        16.4.1. By Country

        16.4.2. By Material type

        16.4.3. By End User

    16.5. Market Trends

    16.6. Key Market Participants - Intensity Mapping

    16.7. Drivers and Restraints - Impact Analysis

    16.8. Country Level Analysis & Forecast

        16.8.1. Saudi Arabia Market

            16.8.1.1. Introduction

            16.8.1.2. Market Analysis and Forecast by Market Taxonomy

                16.8.1.2.1. By Material type

                16.8.1.2.2. By End User

        16.8.2. Türkiye Market

            16.8.2.1. Introduction

            16.8.2.2. Market Analysis and Forecast by Market Taxonomy

                16.8.2.2.1. By Material type

                16.8.2.2.2. By End User

        16.8.3. South Africa Market

            16.8.3.1. Introduction

            16.8.3.2. Market Analysis and Forecast by Market Taxonomy

                16.8.3.2.1. By Material type

                16.8.3.2.2. By End User

        16.8.4. Other African Union Market

            16.8.4.1. Introduction

            16.8.4.2. Market Analysis and Forecast by Market Taxonomy

                16.8.4.2.1. By Material type

                16.8.4.2.2. By End User

17. Market Structure Analysis

    17.1. Market Analysis by Tier of Companies

    17.2. Market Share Analysis of Top Players

    17.3. Market Presence Analysis

        17.3.1. Regional Footprint of Players

        17.3.2. Channel Foot Print by Players

18. Competition Analysis

    18.1. Competition Dashboard

    18.2. Branding & Promotional Strategies, by Manufacturers

    18.3. Competition Benchmarking

    18.4. Key Development Analysis

    18.5. Competition Deep Dive

        18.5.1. Stratasys

            18.5.1.1. Overview

            18.5.1.2. Key Financials

            18.5.1.3. Material Type Portfolio

            18.5.1.4. Sales Footprint

            18.5.1.5. SWOT Analysis

            18.5.1.6. Key Development

            18.5.1.7. Marketing/ Channel/Material Type Strategy

        18.5.2. 3D Systems

        18.5.3. EnvisionTEC

        18.5.4. Carbon

        18.5.5. Formlabs

        18.5.6. Renishaw

        18.5.7. DWS Systems

        18.5.8. Prodways

        18.5.9. PowerResins

        18.5.10. SprintRay GmbH

        18.5.11. Deutsche Edelstahlwerke

        18.5.12. dentona AG

        18.5.13. Nexa3D

        18.5.14. SAREMCO Dental AG

        18.5.15. Nagase ChemteX Corporation

        18.5.16. NextDent B.V.

        18.5.17. LuxCreo, Inc.

        18.5.18. Desktop Metal, Inc.

        18.5.19. DentaFab

19. Assumptions and Acronyms Used

20. Research Methodology

List of Tables

Table 01: Global Market Value (US$ Million) Analysis and Forecast 2018 to 2034, by Material Type

Table 02: Global Market Value (US$ Million) Analysis and Forecast 2018 to 2034, by End User

Table 03: North America Market Value (US$ Million) Analysis 2017 to 2021 and Forecast 2024 to 2034, by Country

Table 04: North America Market Value (US$ Million) Analysis and Forecast 2018 to 2034, by Material Type

Table 05: North America Market Value (US$ Million) Analysis and Forecast 2018 to 2034, by End User

Table 06: Latin America Market Value (US$ Million) Analysis 2017 to 2021 and Forecast 2024 to 2034, by Country

Table 07: Latin America Market Value (US$ Million) Analysis and Forecast 2018 to 2034, by Material Type

Table 08: Latin America Market Value (US$ Million) Analysis and Forecast 2018 to 2034, by End User

Table 09: East Asia Market Value (US$ Million) Analysis 2017 to 2021 and Forecast 2024 to 2034, by Country

Table 10: East Asia Market Value (US$ Million) Analysis and Forecast 2018 to 2034, by Material Type

Table 11: East Asia Market Value (US$ Million) Analysis and Forecast 2018 to 2034, by End User

Table 12: South Asia & Pacific Market Value (US$ Million) Analysis 2017 to 2021 and Forecast 2024 to 2034, by Country

Table 13: South Asia & Pacific Market Value (US$ Million) Analysis and Forecast 2018 to 2034, by Material Type

Table 14: South Asia & Pacific Market Value (US$ Million) Analysis and Forecast 2018 to 2034, by End User

Table 15: Western Europe Market Value (US$ Million) Analysis 2017 to 2021 and Forecast 2024 to 2034, by Country

Table 16: Western Europe Market Value (US$ Million) Analysis and Forecast 2018 to 2034, by Material Type

Table 17: Western Europe Market Value (US$ Million) Analysis and Forecast 2018 to 2034, by End User

Table 18: Eastern Europe Market Value (US$ Million) Analysis 2017 to 2021 and Forecast 2024 to 2034, by Country

Table 19: Eastern Europe Market Value (US$ Million) Analysis and Forecast 2018 to 2034, by Material Type

Table 20: Eastern Europe Market Value (US$ Million) Analysis and Forecast 2018 to 2034, by End User

Table 21: Middle East & Africa Market Value (US$ Million) Analysis 2017 to 2021 and Forecast 2024 to 2034, by Country

Table 22: Middle East & Africa Market Value (US$ Million) Analysis and Forecast 2018 to 2034, by Material Type

Table 23: Middle East & Africa Market Value (US$ Million) Analysis and Forecast 2018 to 2034, by End User

List of Charts

Figure 1: Global Market Value (US$ Million) Analysis, 2018 to 2023

Figure 2: Global Market Forecast & Y-o-Y Growth, 2024 to 2034

Figure 3: Global Market Absolute $ Opportunity (US$ Million) Analysis, 2023 to 2034

Figure 4: Global Market Value Share (%) Analysis 2023 to 2034, by Material Type

Figure 5: Global Market Y-o-Y Growth (%) Analysis 2023 to 2034, by Material Type

Figure 6: Global Market Attractiveness Analysis 2024 to 2034, by Material Type

Figure 7: Global Market Value Share (%) Analysis 2023 to 2034, by End User

Figure 8: Global Market Y-o-Y Growth (%) Analysis 2023 to 2034, by End User

Figure 9: Global Market Attractiveness Analysis 2024 to 2034, by End User

Figure 10: Global Market Value Share (%) Analysis 2023 to 2034, by Region

Figure 11: Global Market Y-o-Y Growth (%) Analysis 2023 to 2034, by Region

Figure 12: Global Market Attractiveness Analysis 2024 to 2034, by Region

Figure 13: North America Market Value (US$ Million) Analysis, 2018 to 2023

Figure 14: North America Market Value (US$ Million) Forecast, 2023 to 2034

Figure 15: North America Market Value Share, by Material Type (2024 E)

Figure 16: North America Market Value Share, by End User (2024 E)

Figure 17: North America Market Value Share, by Country (2024 E)

Figure 18: North America Market Attractiveness Analysis by Material Type,

Figure 19: North America Market Attractiveness Analysis by End User, 2024

Figure 20: North America Market Attractiveness Analysis by Country, 2024

Figure 21: USA Market Value Proportion Analysis, 2023

Figure 22: Global Vs. USA Growth Comparison, 2023 to 2034

Figure 23: USA Market Share Analysis (%) by Material Type, 2023 to 2034

Figure 24: USA Market Share Analysis (%) by End User, 2023 to 2034

Figure 25: Canada Market Value Proportion Analysis, 2023

Figure 26: Global Vs. Canada. Growth Comparison, 2023 to 2034

Figure 27: Canada Market Share Analysis (%) by Material Type, 2023 to 2034

Figure 28: Canada Market Share Analysis (%) by End User, 2023 to 2034

Figure 29: Mexico Market Value Proportion Analysis, 2023

Figure 30: Global Vs. Mexico Growth Comparison, 2023 to 2034

Figure 31: Mexico Market Share Analysis (%) by Material Type, 2023 to 2034

Figure 32: Mexico Market Share Analysis (%) by End User, 2023 to 2034

Figure 33: Latin America Market Value (US$ Million) Analysis, 2018 to 2023

Figure 34: Latin America Market Value (US$ Million) Forecast, 2023 to 2034

Figure 35: Latin America Market Value Share, by Material Type (2024 E)

Figure 36: Latin America Market Value Share, by End User (2024 E)

Figure 37: Latin America Market Value Share, by Country (2024 E)

Figure 38: Latin America Market Attractiveness Analysis by Material Type,

Figure 39: Latin America Market Attractiveness Analysis by End User, 2024

Figure 40: Latin America Market Attractiveness Analysis by Country, 2024

Figure 41: Brazil Market Value Proportion Analysis, 2023

Figure 42: Global Vs. Brazil. Growth Comparison, 2023 to 2034

Figure 43: Brazil Market Share Analysis (%) by Material Type, 2023 to 2034

Figure 44: Brazil Market Share Analysis (%) by End User, 2023 to 2034

Figure 45: Chile Market Value Proportion Analysis, 2023

Figure 46: Global Vs. Chile Growth Comparison, 2023 to 2034

Figure 47: Chile Market Share Analysis (%) by Material Type, 2023 to 2034

Figure 48: Chile Market Share Analysis (%) by End User, 2023 to 2034

Figure 49: East Asia Market Value (US$ Million) Analysis, 2018 to 2023

Figure 50: East Asia Market Value (US$ Million) Forecast, 2023 to 2034

Figure 51: East Asia Market Value Share, by Material Type (2024 E)

Figure 52: East Asia Market Value Share, by End User (2024 E)

Figure 53: East Asia Market Value Share, by Country (2024 E)

Figure 54: East Asia Market Attractiveness Analysis by Material Type, 2024

Figure 55: East Asia Market Attractiveness Analysis by End User, 2024 to 2034

Figure 56: East Asia Market Attractiveness Analysis by Country, 2024 to 2034

Figure 57: China Market Value Proportion Analysis, 2023

Figure 58: Global Vs. China Growth Comparison, 2023 to 2034

Figure 59: China Market Share Analysis (%) by Material Type, 2023 to 2034

Figure 60: China Market Share Analysis (%) by End User, 2023 to 2034

Figure 61: Japan Market Value Proportion Analysis, 2023

Figure 62: Global Vs. Japan Growth Comparison, 2023 to 2034

Figure 63: Japan Market Share Analysis (%) by Material Type, 2023 to 2034

Figure 64: Japan Market Share Analysis (%) by End User, 2023 to 2034

Figure 65: South Korea Market Value Proportion Analysis, 2023

Figure 66: Global Vs South Korea Growth Comparison, 2023 to 2034

Figure 67: South Korea Market Share Analysis (%) by Material Type, 2023 to 2034

Figure 68: South Korea Market Share Analysis (%) by End User, 2023 to 2034

Figure 69: South Asia & Pacific Market Value (US$ Million) Analysis, 2018 to 2023

Figure 70: South Asia & Pacific Market Value (US$ Million) Forecast, 2023 to 2034

Figure 71: South Asia & Pacific Market Value Share, by Material Type (2024 E)

Figure 72: South Asia & Pacific Market Value Share, by End User (2024 E)

Figure 73: South Asia & Pacific Market Value Share, by Country (2024 E)

Figure 74: South Asia & Pacific Market Attractiveness Analysis by Material Type, 2024 to 2034

Figure 75: South Asia & Pacific Market Attractiveness Analysis by End User, 2024 to 2034

Figure 76: South Asia & Pacific Market Attractiveness Analysis by Country, 2024 to 2034

Figure 77: India Market Value Proportion Analysis, 2023

Figure 78: Global Vs. India Growth Comparison, 2023 to 2034

Figure 79: India Market Share Analysis (%) by Material Type, 2023 to 2034

Figure 80: India Market Share Analysis (%) by End User, 2023 to 2034

Figure 81: ASEAN Countries Market Value Proportion Analysis, 2023

Figure 82: Global Vs. ASEAN Countries Growth Comparison, 2023 to 2034

Figure 83: ASEAN Countries Market Share Analysis (%) by Material Type, 2023 to 2034

Figure 84: ASEAN Countries Market Share Analysis (%) by End User, 2023 to 2034

Figure 85: Australia & New Zealand Market Value Proportion Analysis, 2023

Figure 86: Global Vs. Australia & New Zealand Growth Comparison, 2023 to 2034

Figure 87: Australia & New Zealand Market Share Analysis (%) by Material Type, 2023 to 2034

Figure 88: Australia & New Zealand Market Share Analysis (%) by End User, 2023 to 2034

Figure 89: Western Europe Market Value (US$ Million) Analysis, 2018 to 2023

Figure 90: Western Europe Market Value (US$ Million) Forecast, 2023 to 2034

Figure 91: Western Europe Market Value Share, by Material Type (2024 E)

Figure 92: Western Europe Market Value Share, by End User (2024 E)

Figure 93: Western Europe Market Value Share, by Country (2024 E)

Figure 94: Western Europe Market Attractiveness Analysis by Material Type, 2024 to 2034

Figure 95: Western Europe Market Attractiveness Analysis by End User, 2024 to 2034

Figure 96: Western Europe Market Attractiveness Analysis by Country, 2024 to 2034

Figure 97: UK Market Value Proportion Analysis, 2023

Figure 98: Global Vs. UK Growth Comparison, 2023 to 2034

Figure 99: UK Market Share Analysis (%) by Material Type, 2023 to 2034

Figure 100: UK Market Share Analysis (%) by End User, 2023 to 2034

Figure 101: Germany Market Value Proportion Analysis, 2023

Figure 102: Global Vs. Germany Growth Comparison, 2023 to 2034

Figure 103: Germany Market Share Analysis (%) by Material Type, 2023 to 2034

Figure 104: Germany Market Share Analysis (%) by End User, 2023 to 2034

Figure 105: Italy Market Value Proportion Analysis, 2023

Figure 106: Global Vs. Italy Growth Comparison, 2023 to 2034

Figure 107: Italy Market Share Analysis (%) by Material Type, 2023 to 2034

Figure 108: Italy Market Share Analysis (%) by End User, 2023 to 2034

Figure 109: France Market Value Proportion Analysis, 2023

Figure 110: Global Vs France Growth Comparison, 2023 to 2034

Figure 111: France Market Share Analysis (%) by Material Type, 2023 to 2034

Figure 112: France Market Share Analysis (%) by End User, 2023 to 2034

Figure 113: Spain Market Value Proportion Analysis, 2023

Figure 114: Global Vs Spain Growth Comparison, 2023 to 2034

Figure 115: Spain Market Share Analysis (%) by Material Type, 2023 to 2034

Figure 116: Spain Market Share Analysis (%) by End User, 2023 to 2034

Figure 117: Nordic Countries Market Value Proportion Analysis, 2023

Figure 118: Global Vs Nordic Countries Growth Comparison, 2023 to 2034

Figure 119: Nordic Countries Market Share Analysis (%) by Material Type, 2023 to 2034

Figure 120: Nordic Countries Market Share Analysis (%) by End User, 2023 to 2034

Figure 121: BENELUX Market Value Proportion Analysis, 2023

Figure 122: Global Vs BENELUX Growth Comparison, 2023 to 2034

Figure 123: BENELUX Market Share Analysis (%) by Material Type, 2023 to 2034

Figure 124: BENELUX Market Share Analysis (%) by End User, 2023 to 2034

Figure 125: Eastern Europe Market Value (US$ Million) Analysis, 2018 to 2023

Figure 126: Eastern Europe Market Value (US$ Million) Forecast, 2023 to 2034

Figure 127: Eastern Europe Market Value Share, by Material Type (2024 E)

Figure 128: Eastern Europe Market Value Share, by End User (2024 E)

Figure 129: Eastern Europe Market Value Share, by Country (2024 E)

Figure 130: Eastern Europe Market Attractiveness Analysis by Material Type, 2024 to 2034

Figure 131: Eastern Europe Market Attractiveness Analysis by End User, 2024 to 2034

Figure 132: Eastern Europe Market Attractiveness Analysis by Country, 2024 to 2034

Figure 133: Russia Market Value Proportion Analysis, 2023

Figure 134: Global Vs. Russia Growth Comparison, 2023 to 2034

Figure 135: Russia Market Share Analysis (%) by Material Type, 2023 to 2034

Figure 136: Russia Market Share Analysis (%) by End User, 2023 to 2034

Figure 137: Hungary Market Value Proportion Analysis, 2023

Figure 138: Global Vs Hungary Growth Comparison, 2023 to 2034

Figure 139: Hungary Market Share Analysis (%) by Material Type, 2023 to 2034

Figure 140: Hungary Market Share Analysis (%) by End User, 2023 to 2034

Figure 141: Poland Market Value Proportion Analysis, 2023

Figure 142: Global Vs Poland Growth Comparison, 2023 to 2034

Figure 143: Poland Market Share Analysis (%) by Material Type, 2023 to 2034

Figure 144: Poland Market Share Analysis (%) by End User, 2023 to 2034

Figure 145: Middle East & Africa Market Value (US$ Million) Analysis, 2018 to 2023

Figure 146: Middle East & Africa Market Value (US$ Million) Forecast, 2023 to 2034

Figure 147: Middle East & Africa Market Value Share, by Material Type (2024 E)

Figure 148: Middle East & Africa Market Value Share, by End User (2024 E)

Figure 149: Middle East & Africa Market Value Share, by Country (2024 E)

Figure 150: Middle East & Africa Market Attractiveness Analysis by Material Type, 2024 to 2034

Figure 151: Middle East & Africa Market Attractiveness Analysis by End User, 2024 to 2034

Figure 152: Middle East & Africa Market Attractiveness Analysis by Country, 2024 to 2034

Figure 153: Saudi Arabia Market Value Proportion Analysis, 2023

Figure 154: Global Vs Saudi Arabia Growth Comparison, 2023 to 2034

Figure 155: Saudi Arabia Market Share Analysis (%) by Material Type, 2023 to 2034

Figure 156: Saudi Arabia Market Share Analysis (%) by End User, 2023 to 2034

Figure 157: Türkiye Market Value Proportion Analysis, 2023

Figure 158: Global Vs. Türkiye Growth Comparison, 2023 to 2034

Figure 159: Türkiye Market Share Analysis (%) by Material Type, 2023 to 2034

Figure 160: Türkiye Market Share Analysis (%) by End User, 2023 to 2034

Figure 161: South Africa Market Value Proportion Analysis, 2023

Figure 162: Global Vs. South Africa Growth Comparison, 2023 to 2034

Figure 163: South Africa Market Share Analysis (%) by Material Type, 2023 to 2034

Figure 164: South Africa Market Share Analysis (%) by End User, 2023 to 2034

Figure 165: Other African Union Market Value Proportion Analysis, 2023

Figure 166: Global Vs Other African Union Growth Comparison, 2023 to 2034

Figure 167: Other African Union Market Share Analysis (%) by Material Type, 2023 to 2034

Figure 168: Other African Union Market Share Analysis (%) by End User, 2023 to 2034

Recommendations

Healthcare

Dental 3D Printing Material Market

Published : October 2023

Healthcare

3D Printing Dental Device Market

Published : June 2023

Explore Healthcare Insights

View Reports

3D Printed Dental Brace Market