Reports

- Global Locations -

Headquarters

Future Market Insights, Inc.

Christiana Corporate, 200
Continental Drive, Suite 401,
Newark, Delaware - 19713,
United States

T: +1-845-579-5705

Americas

Future Market Insights, Inc.

616 Corporate Way, Suite 2-9018,
Valley Cottage, NY 10989, United States

T: +1-347-918-3531

MEA

Future Market Insights

1602-6 Jumeirah Bay X2 Tower, Plot No: JLT-PH2-X2A,
Jumeirah Lakes Towers, Dubai,
United Arab Emirates

Europe

Future Market Insights

3rd Floor, 207 Regent Street,
W1B 3HH London
United Kingdom

T: + 44 (0) 20 8123 9659
D: +44 (0) 20 3287 4268

Asia Pacific

Future Market Insights

IndiaLand Global Tech Park, Unit UG-1, Behind Grand HighStreet, Phase 1, Hinjawadi, MH, Pune – 411057, India

3D Printed Clear Dental Aligners Market Snapshot

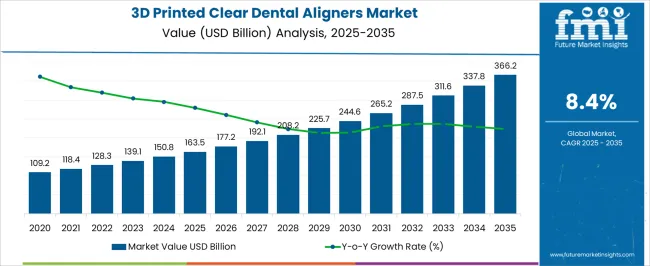
The global 3D printed clear dental aligners market valuation stand at US$ 139.1 Million in 2022, and it is anticipated to expand at a CAGR of 8.4% over the forecasted years. According to a recent study by Future Market Insights, polyurethane resin (PU) are leading the market with a value share of about 36.1% in the year 2022, within the global market.

Market Outlook:

Data Points Market Insights
Market Value 2022 US$ 139.1 Million
Market Value 2033 US$ 332.7 Million
CAGR 2023–2033 8.4%
Market Share of Top 5 Countries 60.3%
Key Market Players 3D System Inc., Align Technology, Inc., ClearCorrect LLC (Straumann Group), Dentsply Sirona, DynaFlex, FORESTADENT, Formlabs, Graphy Inc., Prodways Group, SmileDirectClub, 3M.

The dental industry sector, recently, has been focusing on employing 3D printing technology to create personalized dental aligners. Transparent aligners are used to straighten teeth and improve the overall alignment of the jaw. In recent years, the market for 3D printed clear dental aligners has expanded rapidly as more people seek orthodontic treatments that are less visible than traditional braces.

Don't pay for what you don't need

Customize your report by selecting specific countries or regions and save 30%!

Sales Analysis of 3D Printed Clear Dental Aligners Market from 2016 to 2022 Vs Market Outlook for 2023 to 2033.

The global sales of the 3D printed clear dental aligners market are anticipated to rise at a CAGR of 8.4% between 2023 and 2033, owing to rising demand for orthodontic treatments and increasing adoption of 3D printing technology, customization options for dental aligners, and growing demand for cosmetic dentistry.

The global 3D printed clear dental aligners market holds around 2.1% share of the overall global orthodontics market with a value of around US$ 6.7 Billion, in 2022.

A growing number of dental professionals are using 3D printing technology to produce clear dental aligners as it gets more advanced and affordable. Compared to conventional manufacturing techniques, 3D printing technology provides a more effective and affordable alternative to make personalized aligners.

Patients are increasingly looking for treatment options that are tailored to their specific needs. 3D printing technology enables the production of highly customized clear aligners tailored to a patient's specific needs and preferences. In recent years, a number of businesses have emerged that sell clear aligners to customers directly, eliminating the requirement for an in-person consultation with a dental expert. These businesses often make the aligners using 3D printing technology and provide a more practical and cost-effective orthodontic treatment option.

The market for 3D printed clear dental aligners is expanding beyond North America and Europe. Clear aligners are in high demand in emerging markets such as Asia-Pacific, Latin America, and the Middle East, which is propelling the market forward globally. Owing to the above-mentioned factors, the global market is expected to grow at a prominent pace, and reach a valuation of around US$ 332.7 Million during the year 2033.

What Are the Key Opportunities for the Manufacturers Operating in the Global Market?

Treatment for adult patients is a recent development in the 3D printed clear dental aligners sector, which can be attributed to the increasing demand for orthodontic procedures from adults due to increasing awareness and understanding about oral health and dental appearance. Increasing dental disorders and orthodontics problems will lead to growth of the market for 3D printed clear dental aligners. Additionally, cosmetic dentistry is becoming more popular around the world, as more people seek treatments to improve the appearance of their teeth, Clear dental aligners offer a precise and convenient option for teeth straightening

The benefits of orthodontics related to periodontics, temporomandibular disorders, and restorative dentistry have boosted the number of adults undergoing procedures related to orthodontics. Orthodontics for adults is a growing segment in the global dentistry market. Adult patients receiving orthodontic treatments provide the orthodontists with the stimulus to develop effective treatment approaches for non-growing patients. All these factors provide huge opportunities for the players active within this market space.

Sabyasachi Ghosh
Sabyasachi Ghosh

Principal Consultant

Talk to Analyst

Find your sweet spots for generating winning opportunities in this market.

What Are the Factors Restraining Demand within the Global Market?

There are various factors, which might hinder the market growth for 3D printed clear dental aligners. The initial investment required for dental practices to adopt 3D printing technology for producing clear aligners can be substantial, which can be prohibitive for small practices or those with limited resources. Additionally clear dental aligners are subject to regulatory requirements that vary depending on region or country. Compliance with these requirements can be difficult and time-consuming, potentially limiting market growth.

Clear dental aligners also compete with other orthodontic procedures like lingual braces, ceramic braces, and self-ligating braces despite the fact that they provide a discreet and practical option to conventional braces. However, they are not always appropriate for complicated orthodontic cases involving significant tooth movement or jaw realignment. This can render them less appealing to patients who require intensive orthodontic therapy. Further, many dental insurance policies abroad do not cover the cost of these aligners. As a result, patients who cannot afford to pay for them out of pocket find them less available and costly.
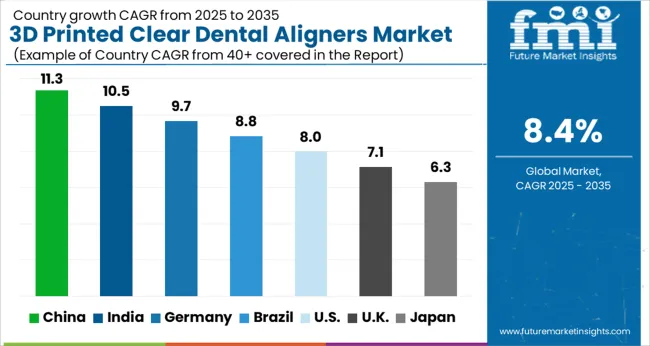
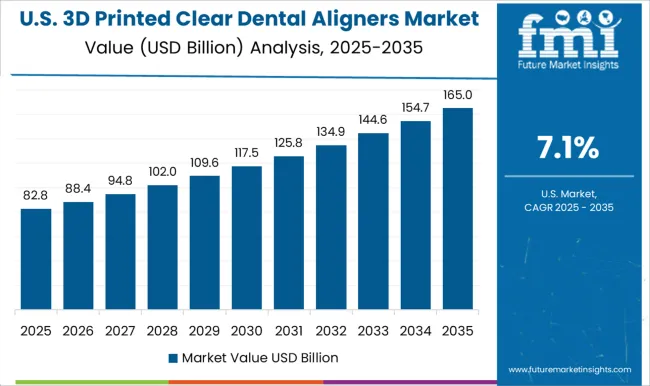
Country-wise Insights

What Makes the USA a Large Market for 3D Printed Clear Dental Aligners?

The USA dominates the North American region with a total market share of around 94.7% in 2022.

The USA is a world leader in the development and widespread use of 3D printing technology, which is pushing innovation in the market for 3D printed clear dental aligners. Healthcare in the USA is expensive, and 3D printing technology can produce clear dental aligners more efficiently and affordably than conventional manufacturing methods. This opens up clear dental aligners to a broader variety of patients.

Clear dental aligners, which are nearly invisible and more comfortable to wear than conventional metal braces, are becoming more popular among patients in the U.S. Overall, the market expansion is expected to continue to experience the same growth throughout the forecast period due to technological advancement, cost-effective, and growing consumer awareness.
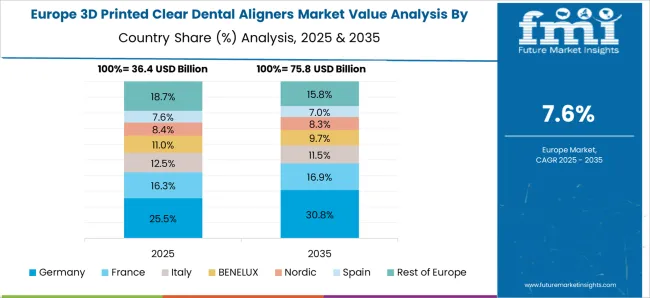
What Is the Scenario of Germany within the Global Market Space?

Germany held a market share of 22.3% in 2022 in the European 3D printed clear dental aligners market, owing to the advanced healthcare infrastructure, favorable reimbursement policies, and presence of numerous established key market players.

There are numerous technologically advanced manufacturing companies in Germany that use 3D printed technology. These companies have attributes like innovativeness, operational excellence, simplexity, customer-centricity, and flexibility allowing them to meet consumer demands at lower costs.

Germany has an advanced healthcare infrastructure, allowing for the development and adoption of 3D printing technology for clear dental aligners. The German healthcare system reimburses orthodontic treatments, including clear dental aligners, favorably. This is increasing patient and healthcare provider demand for the technology.

What Is the Outlook of China in the Global Market?

China held a market share of around 57.0% in the East Asia market 2022 and it is set to expand over the forecast period due to prevalence of orthodontic disorders in adults and increasing orthodontic services, government support for research activities.

China has a large adult population; thus the prevalence of orthodontic disorders is increasing, resulting in increasing demand for orthodontic treatments such as clear dental aligners. Because of the rapid growth in the number of adults with minor orthodontic issues who want to straighten their teeth without using traditional brackets and wires, more GPs are now offering 3D printed clear dental aligners.

The Chinese government supports the development and adoption of 3D printing technology and has invested in Research and Development in this area. This is driving market innovation for 3D printed clear dental aligners.

What Makes India a Highly Lucrative Market for the Global Market?

India held a market share of around 4.9% in the global market 2022 owing to the rising demand for orthodontic treatments and cosmetics dentistry, increasing disposable income, and favorable government policies.

India has a substantial and expanding population, and demand for orthodontic procedures like transparent dental aligners is booming. Indians are also more likely to seek out cosmetic dentistry for aesthetic reasons. A significant population in India are able to afford orthodontic treatments like clear dental aligners as disposable incomes rise.

In order to produce clear dental aligners, Indian firms are investing in 3D printing technology. These firms are also creating novel and cost-effective products for the Indian market. The adoption of 3D printing technology is being encouraged by the Indian government, which is spurring innovation in the market for 3D printed clear dental aligners.

Get the data you need at a Fraction of the cost

Personalize your report by choosing insights you need
and save 40%!

Category-wise Insights

Which Material Is driving the Global Market Expansion?

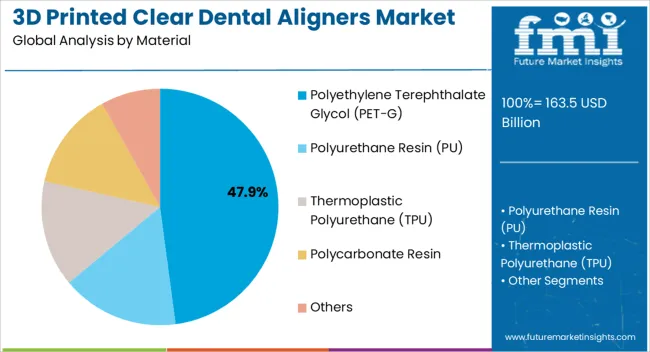
Polyurethane Resin (PU) held around 36.1% of the global market share by value in 2022. PU resin is a material that is increasingly being used in the market for 3D printed clear dental aligners due to its numerous benefits.

Polyurethane resin is a biocompatible material that is safe for use in the human body and does not cause any adverse reactions or irritations. PU resin is translucent and can develop nearly invisible aligners, and hence it is well-liked option among patients.

PU resin is a flexible material that can be easily molded and shaped to fit the patient's teeth. PU resin is a material that 3D printing technology can easily process. This enables dental professionals to create clear dental aligners quickly and efficiently, potentially lowering costs and lead times.

Which Printing Technology Is Largely of Concern within the Global Market?

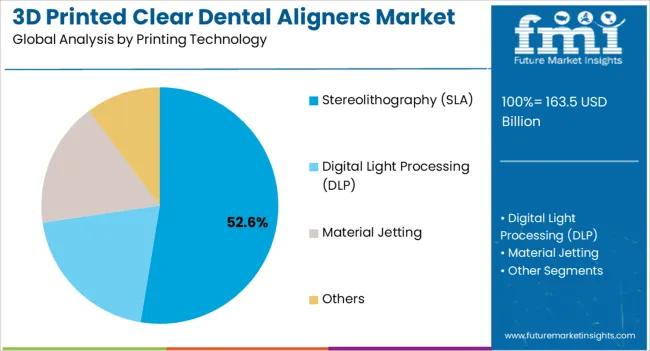
Digital Light Processing (DLP) printing technology held a market share of 37.8% in the global market in 2022. DLP printing technology is being used steadily to develop clear dental aligners because of its several advantages and can improve treatment outcomes and patient satisfaction.

DLP printing technology provides a high level of precision in the production of customized clear dental aligners that are tailored to the patient's specific orthodontic needs. DLP printing technology is a quick printing process that can quickly and efficiently produce clear dental aligners. In the production of clear dental aligners, DLP printing technology provides a high level of consistency and nearly identical results.

In comparison to conventional manufacturing techniques, DLP printing technology is a productive printing method that can lower production costs. As a result, a larger spectrum of patients can find clear dental aligners more convenient.

Which End User Benefits More from the Sales of 3D Printed Clear Dental Aligners within the Global Market?

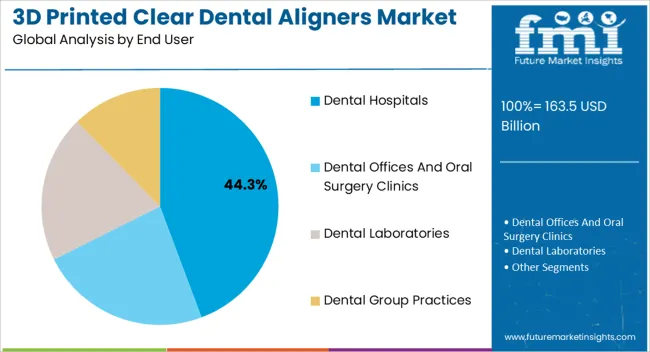
Dental hospitals held a market share of 39.8% in the globally in 2022. Dental hospitals are important end users of 3D printed clear dental aligners. Several factors are influencing dental hospitals for adoption of this technology.

3D printed clear dental aligners are highly customized to the patient's teeth. Dental hospitals are better able to assist their patients, by offering their patients high-quality orthodontic treatments at a lower cost.

Dental hospitals can offer their patients a quicker and more pleasant orthodontic solution with the use of this technology with the use of this technology. This practically invisible 3D printed dental aligners are available from dental offices, boosting patient satisfaction by making it appear as though the patient has real teeth.

Dental hospitals are expected to continue to adopt this technology as a tool to improve patient care and satisfaction as it improves and becomes more widely available.
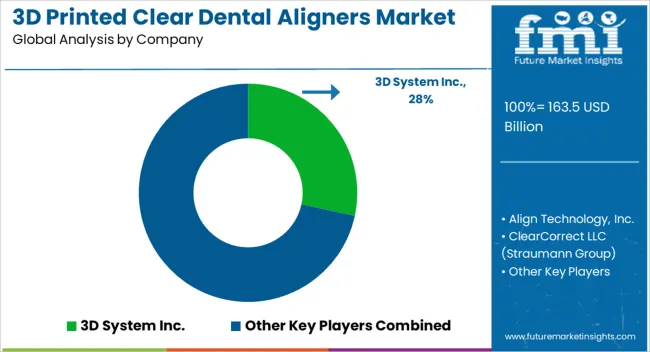
Competitive Landscape

Leading players within the global market focus to develop and introduce new products either through partnership agreement or through authorized certifications from regulatory bodies. These strategies help them to continue maintaining their position in the global leaderboard.

A few examples of strategies acquired by the key players

  • In September 2022, SmileDirectClub, Inc. with its first teeth straightening Medtech platform publicize the transition of its second-generation technology of retainer manufacturing facility in its FDA-registered Smile Labs based in Antioch, Tennessee.
  • In September 2018, 3D Systems and Align Technology announced a partnership that would support the highly customized production for more than 1.6 Million Invisalign clear aligners every week.

Similarly, recent developments related to companies manufacturing 3D printed clear dental aligners have been tracked by the team at Future Market Insights. These are available in the full report.

Report Scope as Per 3D Printed Clear Dental Aligners Market Analysis

Attribute Details
Historical Data Available for 2016 to 2022
Forecast Period 2023 to 2033
Market Analysis US$ Million for Value, and 000 Units for Volume
Key Regions Covered North America, Latin America, Europe, South Asia, East Asia, Oceania, and the Middle East & Africa
Key Countries Covered The USA, Canada, Brazil, Mexico, Argentina, the United kingdom, Germany, Italy, Russia, Spain, France, Benelux, India, Thailand, Indonesia, Malaysia, Japan, China, South Korea, Australia, New Zealand, Türkiye, GCC Countries and South Africa
Key Market Segments Covered Material, Printing Technology, End User, and Region
Key Companies Profiled
  • Abbott
  • 3D System Inc.
  • Align Technology, Inc.
  • ClearCorrect LLC (Straumann Group)
  • Dentsply Sirona
  • DynaFlex, FORESTADENT
  • Formlabs
  • Graphy Inc.
  • Prodways Group
  • SmileDirectClub
  • 3M
Report Coverage Market Forecast, Competition Intelligence, DROT Analysis, Market Dynamics and Challenges, Strategic Growth Initiatives
Pricing Available upon Request

Key Market Segments Covered in the 3D Printed Clear Dental Aligners Industry Research

Material:

  • Polyethylene Terephthalate Glycol (PET-G)
  • Polyurethane Resin (PU)
  • Thermoplastic Polyurethane (TPU)
  • Polycarbonate Resin
  • Others

Printing Technology:

  • Stereolithography (SLA)
  • Digital Light Processing (DLP)
  • Material Jetting
  • Others

End User:

  • Dental Hospitals
  • Dental Offices and Oral Surgery Clinics
  • Dental Laboratories
  • Dental Group Practices

Region:

  • North America
  • Latin America
  • Europe
  • South Asia
  • East Asia
  • Oceania
  • The Middle East and Africa (MEA)

Frequently Asked Questions

What is the 3D Printed Clear Dental Aligners market CAGR for 2033?

The 3D Printed Clear Dental Aligners market CAGR for 2033 is 8.4%.

What is the Current 3D Printed Clear Dental Aligners Market Valuation?

The market is estimated to secure a valuation of US$ 149.0 million in 2023.

What is the projected market value of the global 3D Printed Clear Dental Aligners market for 2033?

The projected market value of the market for 2033 is US$ 332.7 million.

How Key Players are Developing the 3D Printed Clear Dental Aligners Market?

Key players are developing the market by investing in research and development.

Which are the Key Companies in the 3D Printed Clear Dental Aligners Market?

Align Technology, ClearCorrect, and Dentsply Sirona are the key companies in this market.

Table of Content

1. Executive Summary | 3D Printed Clear Dental Aligners Market

    1.1. Global Market Outlook

    1.2. Demand Side Trends

    1.3. Supply-Side Trends

    1.4. Analysis and Recommendations

2. Market Overview

    2.1. Market Coverage / Taxonomy

    2.2. Market Definition / Scope / Limitations

    2.3. Inclusions and Exclusions

3. Key Market Trends

    3.1. Key Trends Impacting the Market

    3.2. Development/Innovation Trends

4. Key Success Factors

    4.1. Product Adoption Analysis, By Region

    4.2. Production Technology Assessment- 3D printed Dental Clear Aligners

    4.3. Dental Clear Aligners Projections, 2022 to 2032

    4.4. Conventional Dental Aligners

    4.5. 3D printed Dental Clear Aligners

    4.6. Promotional Strategies by Key Manufacturers

    4.7. PESTLE Analysis

    4.8. Porter's Analysis

    4.9. Regulatory Scenario

    4.10. Value Chain Analysis

5. Market Background

    5.1. Macro-Economic Factors

        5.1.1. Global GDP Growth Outlook

        5.1.2. Global Healthcare Expenditure

        5.1.3. Global Orthodontics Market Outlook

    5.2. Forecast Factors - Relevance & Impact

        5.2.1. Key Player’s Historic Top Companies’ Historical Growth

        5.2.2. Rising Adoption of Universal Health Coverage

        5.2.3. Rising Awareness about Dental Aesthetics

        5.2.4. Growing Number of Dental Treatment Sites

        5.2.5. Regulatory Framework

        5.2.6. Recent Advancements In Technology

        5.2.7. New product Launches and Approvals

        5.2.8. Key Strategic Developments By Market Players

    5.3. Market Dynamics

        5.3.1. Drivers

        5.3.2. Restraints

        5.3.3. Opportunity

6. COVID-19 Crisis – Impact Assessment

    6.1. Impact of COVID-19: An Overview

    6.2. COVID-19 and Impact Analysis

        6.2.1. Revenue By Material

        6.2.2. Revenue By Printing Technology

        6.2.3. Revenue By End User

        6.2.4. Revenue By Region

    6.3. 2022 Market Scenario

7. Global Market Demand (Volume in Units) Analysis 2016 to 2022 and Forecast, 2023 to 2033

    7.1. Historical Market Value (US$ Million) Analysis, 2016 to 2022

    7.2. Current and Future Market Value (US$ Million) Projections, 2023 to 2033

        7.2.1. Y-o-Y Growth Trend Analysis

8. Global Market - Pricing Analysis

    8.1. Regional Pricing Analysis By Material Type

    8.2. Pricing Break-up

        8.2.1. Manufacturer Level

        8.2.2. Distributor Level

    8.3. Global Average Pricing Analysis Benchmark

    8.4. Pricing Assumptions

9. Global Market Demand (in Value US$ Million) Analysis 2016 to 2022 and Forecast, 2023 to 2033

    9.1. Historical Market Value (US$ Million) Analysis, 2016 to 2022

    9.2. Current and Future Market Value (US$ Million) Projections, 2022-2033

        9.2.1. Y-o-Y Growth Trend Analysis

        9.2.2. Absolute $ Opportunity Analysis

10. Global Market Analysis 2016 to 2022 and Forecast 2023 to 2033, By Material

    10.1. Introduction / Key Findings

    10.2. Historical Market Size (US$ Million) and Volume (000 Units) Analysis by Material, 2016 to 2022

    10.3. Current and Future Market Size (US$ Million) and Volume (000 Units) Analysis and Forecast by Material, 2023 to 2033

        10.3.1. Polyethylene Terephthalate Glycol (PET-G)

        10.3.2. Polyurethane Resin (PU)

        10.3.3. Thermoplastic Polyurethane (TPU)

        10.3.4. Polycarbonate Resin

        10.3.5. Other Material Type

    10.4. Market Attractiveness Analysis By Material

11. Global Market Analysis 2016 to 2022 and Forecast 2023 to 2033, By Printing Technology

    11.1. Introduction / Key Findings

    11.2. Historical Market Size (US$ Million) By Printing Technology, 2016 to 2022

    11.3. Current and Future Market Size (US$ Million) Analysis and Forecast By Printing Technology, 2023 to 2033

        11.3.1. Stereolithography (SLA)

        11.3.2. Digital Light Processing (DLP)

        11.3.3. Material Jetting

        11.3.4. Other Printing Technologies

    11.4. Market Attractiveness Analysis By Printing Technology

12. Global Market Analysis 2016 to 2022 and Forecast 2023 to 2033, By End User

    12.1. Introduction / Key Findings

    12.2. Historical Market Size (US$ Million) By End User, 2016 to 2022

    12.3. Current and Future Market Size (US$ Million) Analysis and Forecast By End User, 2023 to 2033

        12.3.1. Dental Hospitals

        12.3.2. Dental Offices and Oral Surgery Clinics

        12.3.3. Dental Laboratories

        12.3.4. Dental Group Practices

    12.4. Market Attractiveness Analysis By End User

13. Global Market Analysis 2016 to 2022 and Forecast 2023 to 2033, By Region

    13.1. Introduction / Key Findings

    13.2. Historical Market Size (US$ Million) and Volume (000 Units) Analysis, by Region, 2016 to 2022

    13.3. Current and Future Market Size (US$ Million) and Volume (000 Units) Analysis Forecast by Region, 2023 to 2033

        13.3.1. North America

        13.3.2. Latin America

        13.3.3. Europe

        13.3.4. East Asia

        13.3.5. South Asia

        13.3.6. Oceania

        13.3.7. Middle East and Africa (MEA)

    13.4. Market Attractiveness Analysis By Region

14. North America Market Analysis 2016 to 2022 and Forecast 2023 to 2033

    14.1. Introduction

    14.2. Historical Market Size (US$ Million) and Volume (000 Units) Analysis Trend Analysis by Market Taxonomy, 2016 to 2022

    14.3. Current and Future Market Size (US$ Million) and Volume (000 Units) Analysis and Forecast by Market Taxonomy, 2023 to 2033

        14.3.1. By Country

            14.3.1.1. U.S.

            14.3.1.2. Canada

        14.3.2. By Material

        14.3.3. By Printing Technology

        14.3.4. By End User

    14.4. Market Attractiveness Analysis

        14.4.1. By Country

        14.4.2. By Material

        14.4.3. By Printing Technology

        14.4.4. By End User

    14.5. Market Trends

    14.6. Key Market Participants - Intensity Mapping

    14.7. Drivers and Restraints - Impact Analysis

    14.8. Country Level Analysis & Forecast

        14.8.1. U.S. Market Analysis

            14.8.1.1. Introduction

            14.8.1.2. Market Analysis and Forecast by Market Taxonomy

                14.8.1.2.1. By Material

                14.8.1.2.2. By Printing Technology

                14.8.1.2.3. By End User

        14.8.2. Canada Market Analysis

            14.8.2.1. Introduction

            14.8.2.2. Market Analysis and Forecast by Market Taxonomy

                14.8.2.2.1. By Material

                14.8.2.2.2. By Printing Technology

                14.8.2.2.3. By End User

15. Latin America Market Analysis 2016 to 2022 and Forecast 2023 to 2033

    15.1. Introduction

    15.2. Historical Market Size (US$ Million) and Volume (000 Units) Analysis Trend Analysis By Market Taxonomy, 2016 to 2022

    15.3. Current and Future Market Size (US$ Million) and Volume (000 Units) Analysis and Forecast by Market Taxonomy, 2023 to 2033

        15.3.1. By Country

            15.3.1.1. Mexico

            15.3.1.2. Brazil

            15.3.1.3. Argentina

            15.3.1.4. Rest of Latin America

        15.3.2. By Material

        15.3.3. By Printing Technology

        15.3.4. By End User

    15.4. Market Attractiveness Analysis

        15.4.1. By Country

        15.4.2. By Material

        15.4.3. By Printing Technology

        15.4.4. By End User

    15.5. Market Trends

    15.6. Key Market Participants - Intensity Mapping

    15.7. Drivers and Restraints - Impact Analysis

    15.8. Country Level Analysis & Forecast

        15.8.1. Mexico Market Analysis

            15.8.1.1. Introduction

            15.8.1.2. Market Analysis and Forecast by Market Taxonomy

                15.8.1.2.1. By Material

                15.8.1.2.2. By Printing Technology

                15.8.1.2.3. By End User

        15.8.2. Brazil Market Analysis

            15.8.2.1. Introduction

            15.8.2.2. Market Analysis and Forecast by Market Taxonomy

                15.8.2.2.1. By Material

                15.8.2.2.2. By Printing Technology

                15.8.2.2.3. By End User

        15.8.3. Argentina Market Analysis

            15.8.3.1. Introduction

            15.8.3.2. Market Analysis and Forecast by Market Taxonomy

                15.8.3.2.1. By Material

                15.8.3.2.2. By Printing Technology

                15.8.3.2.3. By End User

16. Europe Market Analysis 2016 to 2022 and Forecast 2023 to 2033

    16.1. Introduction

    16.2. Historical Market Size (US$ Million) and Volume (000 Units) Analysis Trend Analysis by Market Taxonomy, 2016 to 2022

    16.3. Current and Future Market Size (US$ Million) and Volume (000 Units) Analysis and Forecast by Market Taxonomy, 2023 to 2033

        16.3.1. By Country

            16.3.1.1. United kingdom

            16.3.1.2. Germany

            16.3.1.3. France

            16.3.1.4. Italy

            16.3.1.5. Spain

            16.3.1.6. BENELUX

            16.3.1.7. Russia

            16.3.1.8. Rest of Europe

        16.3.2. By Material

        16.3.3. By Printing Technology

        16.3.4. By End User

    16.4. Market Attractiveness Analysis

        16.4.1. By Country

        16.4.2. By Material

        16.4.3. By Printing Technology

        16.4.4. By End User

    16.5. Market Trends

    16.6. Key Market Participants - Intensity Mapping

    16.7. Drivers and Restraints - Impact Analysis

    16.8. Country Level Analysis & Forecast

        16.8.1. U.K. Market Analysis

            16.8.1.1. Introduction

            16.8.1.2. Market Analysis and Forecast by Market Taxonomy

                16.8.1.2.1. By Material

                16.8.1.2.2. By Printing Technology

                16.8.1.2.3. By End User

        16.8.2. Germany Market Analysis

            16.8.2.1. Introduction

            16.8.2.2. Market Analysis and Forecast by Market Taxonomy

                16.8.2.2.1. By Material

                16.8.2.2.2. By Printing Technology

                16.8.2.2.3. By End User

        16.8.3. France Market Analysis

            16.8.3.1. Introduction

            16.8.3.2. Market Analysis and Forecast by Market Taxonomy

                16.8.3.2.1. By Material

                16.8.3.2.2. By Printing Technology

                16.8.3.2.3. By End User

        16.8.4. Italy Market Analysis

            16.8.4.1. Introduction

            16.8.4.2. Market Analysis and Forecast by Market Taxonomy

                16.8.4.2.1. By Material

                16.8.4.2.2. By Printing Technology

                16.8.4.2.3. By End User

        16.8.5. Spain Market Analysis

            16.8.5.1. Introduction

            16.8.5.2. Market Analysis and Forecast by Market Taxonomy

                16.8.5.2.1. By Material

                16.8.5.2.2. By Printing Technology

                16.8.5.2.3. By End User

        16.8.6. BENELUX Market Analysis

            16.8.6.1. Introduction

            16.8.6.2. Market Analysis and Forecast by Market Taxonomy

                16.8.6.2.1. By Material

                16.8.6.2.2. By Printing Technology

                16.8.6.2.3. By End User

        16.8.7. Russia Market Analysis

            16.8.7.1. Introduction

            16.8.7.2. Market Analysis and Forecast by Market Taxonomy

                16.8.7.2.1. By Material

                16.8.7.2.2. By Printing Technology

                16.8.7.2.3. By End User

17. East Asia Market Analysis 2016 to 2022 and Forecast 2023 to 2033

    17.1. Introduction

    17.2. Historical Market Size (US$ Million) and Volume (000 Units) Analysis Trend Analysis By Market Taxonomy, 2016 to 2022

    17.3. Current and Future Market Size (US$ Million) and Volume (000 Units) Analysis and Forecast by Market Taxonomy, 2023 to 2033

        17.3.1. By Country

            17.3.1.1. China

            17.3.1.2. Japan

            17.3.1.3. South Korea

        17.3.2. By Material

        17.3.3. By Printing Technology

        17.3.4. By End User

    17.4. Market Attractiveness Analysis

        17.4.1. By Country

        17.4.2. By Material

        17.4.3. By Printing Technology

        17.4.4. By End User

    17.5. Market Trends

    17.6. Key Market Participants - Intensity Mapping

    17.7. Drivers and Restraints - Impact Analysis

    17.8. Country Level Analysis & Forecast

        17.8.1. China Market Analysis

            17.8.1.1. Introduction

            17.8.1.2. Market Analysis and Forecast by Market Taxonomy

                17.8.1.2.1. By Material

                17.8.1.2.2. By Printing Technology

                17.8.1.2.3. By End User

        17.8.2. Japan Market Analysis

            17.8.2.1. Introduction

            17.8.2.2. Market Analysis and Forecast by Market Taxonomy

                17.8.2.2.1. By Material

                17.8.2.2.2. By Printing Technology

                17.8.2.2.3. By End User

        17.8.3. South Korea Market Analysis

            17.8.3.1. Introduction

            17.8.3.2. Market Analysis and Forecast by Market Taxonomy

                17.8.3.2.1. By Material

                17.8.3.2.2. By Printing Technology

                17.8.3.2.3. By End User

18. South Asia Market Analysis 2016 to 2022 and Forecast 2023 to 2033

    18.1. Introduction

    18.2. Historical Market Size (US$ Million) and Volume (000 Units) Analysis Trend Analysis By Market Taxonomy, 2016 to 2022

    18.3. Current and Future Market Size (US$ Million) and Volume (000 Units) Analysis and Forecast by Market Taxonomy, 2023 to 2033

        18.3.1. By Country

            18.3.1.1. India

            18.3.1.2. Malaysia

            18.3.1.3. Thailand

            18.3.1.4. Indonesia

            18.3.1.5. Rest of South Asia

        18.3.2. By Material

        18.3.3. By Printing Technology

        18.3.4. By End User

    18.4. Market Attractiveness Analysis

        18.4.1. By Country

        18.4.2. By Material

        18.4.3. By Printing Technology

        18.4.4. By End User

    18.5. Market Trends

    18.6. Key Market Participants - Intensity Mapping

    18.7. Drivers and Restraints - Impact Analysis

    18.8. Country Level Analysis & Forecast

        18.8.1. India Market Analysis

            18.8.1.1. Introduction

            18.8.1.2. Market Analysis and Forecast by Market Taxonomy

                18.8.1.2.1. By Material

                18.8.1.2.2. By Printing Technology

                18.8.1.2.3. By End User

        18.8.2. Malaysia Market Analysis

            18.8.2.1. Introduction

            18.8.2.2. Market Analysis and Forecast by Market Taxonomy

                18.8.2.2.1. By Material

                18.8.2.2.2. By Printing Technology

                18.8.2.2.3. By End User

        18.8.3. Thailand Market Analysis

            18.8.3.1. Introduction

            18.8.3.2. Market Analysis and Forecast by Market Taxonomy

                18.8.3.2.1. By Material

                18.8.3.2.2. By Printing Technology

                18.8.3.2.3. By End User

        18.8.4. Indonesia Market Analysis

            18.8.4.1. Introduction

            18.8.4.2. Market Analysis and Forecast by Market Taxonomy

                18.8.4.2.1. By Material

                18.8.4.2.2. By Printing Technology

                18.8.4.2.3. By End User

19. Oceania Market 2016 to 2022 and Forecast 2023 to 2033

    19.1. Introduction

    19.2. Historical Market Size (US$ Million) and Volume (000 Units) Analysis Trend Analysis By Market Taxonomy, 2016 to 2022

    19.3. Current and Future Market Size (US$ Million) and Volume (000 Units) Analysis and Forecast by Market Taxonomy, 2023 to 2033

        19.3.1. By Country

            19.3.1.1. Australia

            19.3.1.2. New Zealand

        19.3.2. By Material

        19.3.3. By Printing Technology

        19.3.4. By End User

    19.4. Market Attractiveness Analysis

        19.4.1. By Country

        19.4.2. By Material

        19.4.3. By Printing Technology

        19.4.4. By End User

    19.5. Market Trends

    19.6. Key Market Participants - Intensity Mapping

    19.7. Drivers and Restraints - Impact Analysis

    19.8. Country Level Analysis & Forecast

        19.8.1. Australia Market Analysis

            19.8.1.1. Introduction

            19.8.1.2. Market Analysis and Forecast by Market Taxonomy

                19.8.1.2.1. By Material

                19.8.1.2.2. By Printing Technology

                19.8.1.2.3. By End User

        19.8.2. New Zealand Market Analysis

            19.8.2.1. Introduction

            19.8.2.2. Market Analysis and Forecast by Market Taxonomy

                19.8.2.2.1. By Material

                19.8.2.2.2. By Printing Technology

                19.8.2.2.3. By End User

20. Middle East and Africa (MEA) Market Analysis 2016 to 2022 and Forecast 2023 to 2033

    20.1. Introduction

    20.2. Historical Market Size (US$ Million) and Volume (000 Units) Analysis Trend Analysis by Market Taxonomy, 2016 to 2022

    20.3. Current and Future Market Size (US$ Million) and Volume (000 Units) Analysis and Forecast by Market Taxonomy, 2023 to 2033

        20.3.1. By Country

            20.3.1.1. GCC Countries

            20.3.1.2. Türkiye

            20.3.1.3. South Africa

            20.3.1.4. North Africa

            20.3.1.5. Rest of Middle East and Africa

        20.3.2. By Material

        20.3.3. By Printing Technology

        20.3.4. By End User

    20.4. Market Attractiveness Analysis

        20.4.1. By Country

        20.4.2. By Material

        20.4.3. By Printing Technology

        20.4.4. By End User

    20.5. Market Trends

    20.6. Key Market Participants - Intensity Mapping

    20.7. Drivers and Restraints - Impact Analysis

    20.8. Country Level Analysis & Forecast

        20.8.1. GCC Countries Market Analysis

            20.8.1.1. Introduction

            20.8.1.2. Market Analysis and Forecast by Market Taxonomy

                20.8.1.2.1. By Material

                20.8.1.2.2. By Printing Technology

                20.8.1.2.3. By End User

        20.8.2. Türkiye Market Analysis

            20.8.2.1. Introduction

            20.8.2.2. Market Analysis and Forecast by Market Taxonomy

                20.8.2.2.1. By Material

                20.8.2.2.2. By Printing Technology

                20.8.2.2.3. By End User

        20.8.3. South Africa Market Analysis

            20.8.3.1. Introduction

            20.8.3.2. Market Analysis and Forecast by Market Taxonomy

                20.8.3.2.1. By Material

                20.8.3.2.2. By Printing Technology

                20.8.3.2.3. By End User

        20.8.4. North Africa Market Analysis

            20.8.4.1. Introduction

            20.8.4.2. Market Analysis and Forecast by Market Taxonomy

                20.8.4.2.1. By Material

                20.8.4.2.2. By Printing Technology

                20.8.4.2.3. By End User

21. Market Structure Analysis

    21.1. Market Analysis by Tier of Companies

    21.2. Market Share Analysis of Top Players (%)

    21.3. Market Presence Analysis

        21.3.1. By Regional Footprint of Players

        21.3.2. Product Footprint of Players

        21.3.3. Channel Footprint of Players

22. Competition Analysis

    22.1. Competition Dashboard

    22.2. Competition Benchmarking

    22.3. Competition Deep Dive

        22.3.1. 3D System Inc.

            22.3.1.1. Overview

            22.3.1.2. Product Portfolio

            22.3.1.3. Key Financials

            22.3.1.4. SWOT Analysis

            22.3.1.5. Key Developments

            22.3.1.6. Sales Footprint

            22.3.1.7. Strategy Overview

                22.3.1.7.1. Marketing Strategies

                22.3.1.7.2. Product Strategies

                22.3.1.7.3. Channel Strategies

        22.3.2. Align Technology, Inc.

            22.3.2.1. Overview

            22.3.2.2. Product Portfolio

            22.3.2.3. Key Financials

            22.3.2.4. SWOT Analysis

            22.3.2.5. Key Developments

            22.3.2.6. Sales Footprint

            22.3.2.7. Strategy Overview

                22.3.2.7.1. Marketing Strategies

                22.3.2.7.2. Product Strategies

                22.3.2.7.3. Channel Strategies

        22.3.3. ClearCorrect LLC (Straumann Group)

            22.3.3.1. Overview

            22.3.3.2. Product Portfolio

            22.3.3.3. Key Financials

            22.3.3.4. SWOT Analysis

            22.3.3.5. Key Developments

            22.3.3.6. Sales Footprint

            22.3.3.7. Strategy Overview

                22.3.3.7.1. Marketing Strategies

                22.3.3.7.2. Product Strategies

                22.3.3.7.3. Channel Strategies

        22.3.4. Dentsply Sirona

            22.3.4.1. Overview

            22.3.4.2. Product Portfolio

            22.3.4.3. Key Financials

            22.3.4.4. SWOT Analysis

            22.3.4.5. Key Developments

            22.3.4.6. Sales Footprint

            22.3.4.7. Strategy Overview

                22.3.4.7.1. Marketing Strategies

                22.3.4.7.2. Product Strategies

                22.3.4.7.3. Channel Strategies

        22.3.5. DynaFlex

            22.3.5.1. Overview

            22.3.5.2. Product Portfolio

            22.3.5.3. Key Financials

            22.3.5.4. SWOT Analysis

            22.3.5.5. Key Developments

            22.3.5.6. Sales Footprint

            22.3.5.7. Strategy Overview

                22.3.5.7.1. Marketing Strategies

                22.3.5.7.2. Product Strategies

                22.3.5.7.3. Channel Strategies

        22.3.6. FORESTADENT

            22.3.6.1. Overview

            22.3.6.2. Product Portfolio

            22.3.6.3. Key Financials

            22.3.6.4. SWOT Analysis

            22.3.6.5. Key Developments

            22.3.6.6. Sales Footprint

            22.3.6.7. Strategy Overview

                22.3.6.7.1. Marketing Strategies

                22.3.6.7.2. Product Strategies

                22.3.6.7.3. Channel Strategies

        22.3.7. Formlabs

            22.3.7.1. Overview

            22.3.7.2. Product Portfolio

            22.3.7.3. Key Financials

            22.3.7.4. SWOT Analysis

            22.3.7.5. Key Developments

            22.3.7.6. Sales Footprint

            22.3.7.7. Strategy Overview

                22.3.7.7.1. Marketing Strategies

                22.3.7.7.2. Product Strategies

                22.3.7.7.3. Channel Strategies

        22.3.8. Graphy Inc.

            22.3.8.1. Overview

            22.3.8.2. Product Portfolio

            22.3.8.3. Key Financials

            22.3.8.4. SWOT Analysis

            22.3.8.5. Key Developments

            22.3.8.6. Sales Footprint

            22.3.8.7. Strategy Overview

                22.3.8.7.1. Marketing Strategies

                22.3.8.7.2. Product Strategies

                22.3.8.7.3. Channel Strategies

        22.3.9. Prodways Group

            22.3.9.1. Overview

            22.3.9.2. Product Portfolio

            22.3.9.3. Key Financials

            22.3.9.4. SWOT Analysis

            22.3.9.5. Key Developments

            22.3.9.6. Sales Footprint

            22.3.9.7. Strategy Overview

                22.3.9.7.1. Marketing Strategies

                22.3.9.7.2. Product Strategies

                22.3.9.7.3. Channel Strategies

        22.3.10. SmileDirectClub

            22.3.10.1. Overview

            22.3.10.2. Product Portfolio

            22.3.10.3. Key Financials

            22.3.10.4. SWOT Analysis

            22.3.10.5. Key Developments

            22.3.10.6. Sales Footprint

            22.3.10.7. Strategy Overview

                22.3.10.7.1. Marketing Strategies

                22.3.10.7.2. Product Strategies

                22.3.10.7.3. Channel Strategies

        22.3.11. 3M

            22.3.11.1. Overview

            22.3.11.2. Product Portfolio

            22.3.11.3. Key Financials

            22.3.11.4. SWOT Analysis

            22.3.11.5. Key Developments

            22.3.11.6. Sales Footprint

            22.3.11.7. Strategy Overview

                22.3.11.7.1. Marketing Strategies

                22.3.11.7.2. Product Strategies

                22.3.11.7.3. Channel Strategies

23. Assumptions and Acronyms Used

24. Research Methodology

Don't pay for what you don't need

Customize your report by selecting specific countries or regions and save 30%!

List of Tables

Table 1: Global Urinary Catheters Market Value (US$ Million) Analysis 2015 to 2022 and Forecast 2023 to 2033 by Material

Table 2: Global Urinary Catheters Market Volume (000 Units) Analysis 2015 to 2022 and Forecast 2023 to 2033 by Material

Table 3: Global Urinary Catheters Market Value (US$ Million) Analysis 2015 to 2022 and Forecast 2023 to 2033 by Printing Technology

Table 4: Global Urinary Catheters Market Value (US$ Million) Analysis 2015 to 2022 and Forecast 2023 to 2033 by End User

Table 5: Global Urinary Catheters Market Analysis 2015 to 2022 and Forecast 2023 to 2033, by Region

Table 6: North America Urinary Catheters Market Value (US$ Million) Analysis 2015 to 2022 and Forecast 2023 to 2033 by Country

Table 7: North America Urinary Catheters Market Value (US$ Million) Analysis 2015 to 2022 and Forecast 2023 to 2033 by Material

Table 8: North America Urinary Catheters Market Volume (000 Units) Analysis 2015 to 2022 and Forecast 2023 to 2033 by Material

Table 9: North America Urinary Catheters Market Value (US$ Million) Analysis 2015 to 2022 and Forecast 2023 to 2033 by Printing Technology

Table 10: North America Urinary Catheters Market Value (US$ Million) Analysis 2015 to 2022 and Forecast 2023 to 2033 by End User

Table 11: Latin America Urinary Catheters Market Value (US$ Million) Analysis 2015 to 2022 and Forecast 2023 to 2033 by Country

Table 12: Latin America Urinary Catheters Market Value (US$ Million) Analysis 2015 to 2022 and Forecast 2023 to 2033 by Material

Table 13: Latin America Urinary Catheters Market Volume (000 Units) Analysis 2015 to 2022 and Forecast 2023 to 2033 by Material

Table 14: Latin America Urinary Catheters Market Value (US$ Million) Analysis 2015 to 2022 and Forecast 2023 to 2033 by Printing Technology

Table 15: Latin America Urinary Catheters Market Value (US$ Million) Analysis 2015 to 2022 and Forecast 2023 to 2033 by End User

Table 16: Europe Urinary Catheters Market Value (US$ Million) Analysis 2015 to 2022 and Forecast 2023 to 2033 by Country

Table 17: Europe Urinary Catheters Market Value (US$ Million) Analysis 2015 to 2022 and Forecast 2023 to 2033 by Material

Table 18: Europe Urinary Catheters Market Volume (000 Units) Analysis 2015 to 2022 and Forecast 2023 to 2033 by Material

Table 19: Europe Urinary Catheters Market Value (US$ Million) Analysis 2015 to 2022 and Forecast 2023 to 2033 by Printing Technology

Table 20: Europe Urinary Catheters Market Value (US$ Million) Analysis 2015 to 2022 and Forecast 2023 to 2033 by End User

Table 21: East Asia Urinary Catheters Market Value (US$ Million) Analysis 2015 to 2022 and Forecast 2023 to 2033 by Country

Table 22: East Asia Urinary Catheters Market Value (US$ Million) Analysis 2015 to 2022 and Forecast 2023 to 2033 by Material

Table 23: East Asia Urinary Catheters Market Volume (000 Units) Analysis 2015 to 2022 and Forecast 2023 to 2033 by Material

Table 24: East Asia Urinary Catheters Market Value (US$ Million) Analysis 2015 to 2022 and Forecast 2023 to 2033 by Printing Technology

Table 25: East Asia Urinary Catheters Market Value (US$ Million) Analysis 2015 to 2022 and Forecast 2023 to 2033 by End User

Table 26: South Asia Urinary Catheters Market Value (US$ Million) Analysis 2015 to 2022 and Forecast 2023 to 2033 by Country

Table 27: South Asia Urinary Catheters Market Value (US$ Million) Analysis 2015 to 2022 and Forecast 2023 to 2033 by Material

Table 28: South Asia Urinary Catheters Market Volume (000 Units) Analysis 2015 to 2022 and Forecast 2023 to 2033 by Material

Table 29: South Asia Urinary Catheters Market Value (US$ Million) Analysis 2015 to 2022 and Forecast 2023 to 2033 by Printing Technology

Table 30: South Asia Urinary Catheters Market Value (US$ Million) Analysis 2015 to 2022 and Forecast 2023 to 2033 by End User

Table 31: Oceania Urinary Catheters Market Value (US$ Million) Analysis 2015 to 2022 and Forecast 2023 to 2033 by Country

Table 32: Oceania Urinary Catheters Market Value (US$ Million) Analysis 2015 to 2022 and Forecast 2023 to 2033 by Material

Table 33: Oceania Urinary Catheters Market Volume (000 Units) Analysis 2015 to 2022 and Forecast 2015 to 2033 by Material

Table 34: Oceania Urinary Catheters Market Value (US$ Million) Analysis 2015 to 2022 and Forecast 2023 to 2033 by Printing Technology

Table 35: Oceania Urinary Catheters Market Volume (000 Units) Analysis 2015 to 2022 and Forecast 2015–2033 by End User

Table 36: Middle East & Africa Urinary Catheters Market Value (US$ Million) Analysis 2015 to 2022 and Forecast 2023 to 2033 by Country

Table 37: Middle East & Africa Urinary Catheters Market Value (US$ Million) Analysis 2015 to 2022 and Forecast 2023 to 2033 by Material

Table 38: Middle East & Africa Urinary Catheters Market Volume (000 Units) Analysis 2015 to 2022 and Forecast 2023 to 2033 by Material

Table 39: Middle East & Africa Urinary Catheters Market Value (US$ Million) Analysis 2015 to 2022 and Forecast 2023 to 2033 by Printing Technology

Table 40: Middle East & Africa Urinary Catheters Market Value (US$ Million) Analysis 2015 to 2022 and Forecast 2023 to 2033 by End User
Sabyasachi Ghosh
Sabyasachi Ghosh

Principal Consultant

Talk to Analyst

Find your sweet spots for generating winning opportunities in this market.

List of Charts

Figure 1: Global Market Volume (Units), 2016 to 2022

Figure 2: Global Market Volume (Units) & Y-o-Y Growth (%) Analysis, 2023 to 2033

Figure 3: Market, Pricing Analysis per unit (US$), in 2023

Figure 4: Market, Pricing Forecast per unit (US$), in 2033

Figure 5: Global Market Value (US$ Million) Analysis, 2016 to 2022

Figure 6: Global Market Forecast & Y-o-Y Growth, 2023 to 2033

Figure 7: Global Market Absolute $ Opportunity (US$ Million) Analysis, 2022 to 2033

Figure 8: Global Market Value Share (%) Analysis 2023 and 2033, by Material

Figure 9: Global Market Y-o-Y Growth (%) Analysis 2022 to 2033, by Material

Figure 10: Global Market Attractiveness Analysis 2023 to 2033, by Material

Figure 11: Global Market Value Share (%) Analysis 2023 and 2033, by Printing Technology

Figure 12: Global Market Y-o-Y Growth (%) Analysis 2022 to 2033, by Printing Technology

Figure 13: Global Market Attractiveness Analysis 2023 to 2033, by Printing Technology

Figure 14: Global Market Value Share (%) Analysis 2023 and 2033, by End User

Figure 15: Global Market Y-o-Y Growth (%) Analysis 2022 to 2033, by End User

Figure 16: Global Market Attractiveness Analysis 2023 to 2033, by End User

Figure 17: Global Market Value Share (%) Analysis 2023 and 2033, by Region

Figure 18: Global Market Y-o-Y Growth (%) Analysis 2022 to 2033, by Region

Figure 19: Global Market Attractiveness Analysis 2023 to 2033, by Region

Figure 20: North America Market Value (US$ Million) Analysis, 2016 to 2022

Figure 21: North America Market Value (US$ Million) Forecast, 2023 to 2033

Figure 22: North America Market Value Share, by Material (2023 E)

Figure 23: North America Market Value Share, by Printing Technology (2023 E)

Figure 24: North America Market Value Share, by End User (2023 E)

Figure 25: North America Market Value Share, by Country (2023 E)

Figure 26: North America Market Attractiveness Analysis by Material, 2023 to 2033

Figure 27: North America Market Attractiveness Analysis by Printing Technology, 2023 to 2033

Figure 28: North America Market Attractiveness Analysis by End User, 2023 to 2033

Figure 29: North America Market Attractiveness Analysis by Country, 2023 to 2033

Figure 30: U.S. Market Value Proportion Analysis, 2022

Figure 31: Global Vs. U.S. Growth Comparison

Figure 32: U.S. Market Share Analysis (%) by Material, 2022 & 2033

Figure 33: U.S. Market Share Analysis (%) by Printing Technology, 2022 & 2033

Figure 34: U.S. Market Share Analysis (%) by End User, 2022 & 2033

Figure 35: Canada Market Value Proportion Analysis, 2022

Figure 36: Global Vs. Canada. Growth Comparison

Figure 37: Canada Market Share Analysis (%) by Material, 2022 & 2033

Figure 38: Canada Market Share Analysis (%) by Printing Technology, 2022 & 2033

Figure 39: Canada Market Share Analysis (%) by End User, 2022 & 2033

Figure 40: Latin America Market Value (US$ Million) Analysis, 2016 to 2022

Figure 41: Latin America Market Value (US$ Million) Forecast, 2023 to 2033

Figure 42: Latin America Market Value Share, by Material (2023 E)

Figure 43: Latin America Market Value Share, by Printing Technology (2023 E)

Figure 44: Latin America Market Value Share, by End User (2023 E)

Figure 45: Latin America Market Value Share, by Country (2023 E)

Figure 46: Latin America Market Attractiveness Analysis by Material, 2023 to 2033

Figure 47: Latin America Market Attractiveness Analysis by Printing Technology, 2023 to 2033

Figure 48: Latin America Market Attractiveness Analysis by End User, 2023 to 2033

Figure 49: Latin America Market Attractiveness Analysis by Country, 2023 to 2033

Figure 50: Mexico Market Value Proportion Analysis, 2022

Figure 51: Global Vs Mexico Growth Comparison

Figure 52: Mexico Market Share Analysis (%) by Material, 2022 & 2033

Figure 53: Mexico Market Share Analysis (%) by Printing Technology, 2022 & 2033

Figure 54: Mexico Market Share Analysis (%) by End User, 2022 & 2033

Figure 55: Brazil Market Value Proportion Analysis, 2022

Figure 56: Global Vs. Brazil. Growth Comparison

Figure 57: Brazil Market Share Analysis (%) by Material, 2022 & 2033

Figure 58: Brazil Market Share Analysis (%) by Printing Technology, 2022 & 2033

Figure 59: Brazil Market Share Analysis (%) by End User, 2022 & 2033

Figure 60: Argentina Market Value Proportion Analysis, 2022

Figure 61: Global Vs Argentina Growth Comparison

Figure 62: Argentina Market Share Analysis (%) by Material, 2022 & 2033

Figure 63: Argentina Market Share Analysis (%) by Printing Technology, 2022 & 2033

Figure 64: Argentina Market Share Analysis (%) by End User, 2022 & 2033

Figure 65: Europe Market Value (US$ Million) Analysis, 2016 to 2022

Figure 66: Europe Market Value (US$ Million) Forecast, 2023 to 2033

Figure 67: Europe Market Value Share, by Material (2023 E)

Figure 68: Europe Market Value Share, by Printing Technology (2023 E)

Figure 69: Europe Market Value Share, by End User (2023 E)

Figure 70: Europe Market Value Share, by Country (2023 E)

Figure 71: Europe Market Attractiveness Analysis by Material, 2023 to 2033

Figure 72: Europe Market Attractiveness Analysis by Printing Technology, 2023 to 2033

Figure 73: Europe Market Attractiveness Analysis by End User, 2023 to 2033

Figure 74: Europe Market Attractiveness Analysis by Country, 2023 to 2033

Figure 75: U.K. Market Value Proportion Analysis, 2022

Figure 76: Global Vs. U.K. Growth Comparison

Figure 77: U.K. Market Share Analysis (%) by Material, 2022 & 2033

Figure 78: U.K. Market Share Analysis (%) by Printing Technology, 2022 & 2033

Figure 79: U.K. Market Share Analysis (%) by End User, 2022 & 2033

Figure 80: Germany Market Value Proportion Analysis, 2022

Figure 81: Global Vs. Germany Growth Comparison

Figure 82: Germany Market Share Analysis (%) by Material, 2022 & 2033

Figure 83: Germany Market Share Analysis (%) by Printing Technology, 2022 & 2033

Figure 84: Germany Market Share Analysis (%) by End User, 2022 & 2033

Figure 85: Italy Market Value Proportion Analysis, 2022

Figure 86: Global Vs. Italy Growth Comparison

Figure 87: Italy Market Share Analysis (%) by Material, 2022 & 2033

Figure 88: Italy Market Share Analysis (%) by Printing Technology, 2022 & 2033

Figure 89: Italy Market Share Analysis (%) by End User, 2022 & 2033

Figure 90: France Market Value Proportion Analysis, 2022

Figure 91: Global Vs France Growth Comparison

Figure 92: France Market Share Analysis (%) by Material, 2022 & 2033

Figure 93: France Market Share Analysis (%) by Printing Technology, 2022 & 2033

Figure 94: France Market Share Analysis (%) by End User, 2022 & 2033

Figure 95: Spain Market Value Proportion Analysis, 2022

Figure 96: Global Vs Spain Growth Comparison

Figure 97: Spain Market Share Analysis (%) by Material, 2022 & 2033

Figure 98: Spain Market Share Analysis (%) by Printing Technology, 2022 & 2033

Figure 99: Spain Market Share Analysis (%) by End User, 2022 & 2033

Figure 100: Russia Market Value Proportion Analysis, 2022

Figure 101: Global Vs Russia Growth Comparison

Figure 102: Russia Market Share Analysis (%) by Material, 2022 & 2033

Figure 103: Russia Market Share Analysis (%) by Printing Technology, 2022 & 2033

Figure 104: Russia Market Share Analysis (%) by End User, 2022 & 2033

Figure 105: BENELUX Market Value Proportion Analysis, 2022

Figure 106: Global Vs BENELUX Growth Comparison

Figure 107: BENELUX Market Share Analysis (%) by Material, 2022 & 2033

Figure 108: BENELUX Market Share Analysis (%) by Printing Technology, 2022 & 2033

Figure 109: BENELUX Market Share Analysis (%) by End User, 2022 & 2033

Figure 110: East Asia Market Value (US$ Million) Analysis, 2016 to 2022

Figure 111: East Asia Market Value (US$ Million) Forecast, 2023 to 2033

Figure 112: East Asia Market Value Share, by Material (2023 E)

Figure 113: East Asia Market Value Share, by Printing Technology (2023 E)

Figure 114: East Asia Market Value Share, by End User (2023 E)

Figure 115: East Asia Market Value Share, by Country (2023 E)

Figure 116: East Asia Market Attractiveness Analysis by Material, 2023 to 2033

Figure 117: East Asia Market Attractiveness Analysis by Printing Technology, 2023 to 2033

Figure 118: East Asia Market Attractiveness Analysis by End User, 2023 to 2033

Figure 119: East Asia Market Attractiveness Analysis by Country, 2023 to 2033

Figure 120: China Market Value Proportion Analysis, 2022

Figure 121: Global Vs. China Growth Comparison

Figure 122: China Market Share Analysis (%) by Material, 2022 & 2033

Figure 123: China Market Share Analysis (%) by Printing Technology, 2022 & 2033

Figure 124: China Market Share Analysis (%) by End User, 2022 & 2033

Figure 125: Japan Market Value Proportion Analysis, 2022

Figure 126: Global Vs. Japan Growth Comparison

Figure 127: Japan Market Share Analysis (%) by Material, 2022 & 2033

Figure 128: Japan Market Share Analysis (%) by Printing Technology, 2022 & 2033

Figure 129: Japan Market Share Analysis (%) by End User, 2022 & 2033

Figure 130: South Korea Market Value Proportion Analysis, 2022

Figure 131: Global Vs South Korea Growth Comparison

Figure 132: South Korea Market Share Analysis (%) by Material, 2022 & 2033

Figure 133: South Korea Market Share Analysis (%) by Printing Technology, 2022 & 2033

Figure 134: South Korea Market Share Analysis (%) by End User, 2022 & 2033

Figure 135: South Asia Market Value (US$ Million) Analysis, 2016 to 2022

Figure 136: South Asia Market Value (US$ Million) Forecast, 2023 to 2033

Figure 137: South Asia Market Value Share, by Material (2023 E)

Figure 138: South Asia Market Value Share, by Printing Technology (2023 E)

Figure 139: South Asia Market Value Share, by End User (2023 E)

Figure 140: South Asia Market Value Share, by Country (2023 E)

Figure 141: South Asia Market Attractiveness Analysis by Material, 2023 to 2033

Figure 142: South Asia Market Attractiveness Analysis by Printing Technology, 2023 to 2033

Figure 143: South Asia Market Attractiveness Analysis by End User, 2023 to 2033

Figure 144: South Asia Market Attractiveness Analysis by Country, 2023 to 2033

Figure 145: India Market Value Proportion Analysis, 2022

Figure 146: Global Vs. India Growth Comparison

Figure 147: India Market Share Analysis (%) by Material, 2022 & 2033

Figure 148: India Market Share Analysis (%) by Printing Technology, 2022 & 2033

Figure 149: India Market Share Analysis (%) by End User, 2022 & 2033

Figure 150: Indonesia Market Value Proportion Analysis, 2022

Figure 151: Global Vs. Indonesia Growth Comparison

Figure 152: Indonesia Market Share Analysis (%) by Material, 2022 & 2033

Figure 153: Indonesia Market Share Analysis (%) by Printing Technology, 2022 & 2033

Figure 154: Indonesia Market Share Analysis (%) by End User, 2022 & 2033

Figure 155: Malaysia Market Value Proportion Analysis, 2022

Figure 156: Global Vs. Malaysia Growth Comparison

Figure 157: Malaysia Market Share Analysis (%) by Material, 2022 & 2033

Figure 158: Malaysia Market Share Analysis (%) by Printing Technology, 2022 & 2033

Figure 159: Malaysia Market Share Analysis (%) by End User, 2022 & 2033

Figure 160: Thailand Market Value Proportion Analysis, 2022

Figure 161: Global Vs. Thailand Growth Comparison

Figure 162: Thailand Market Share Analysis (%) by Material, 2022 & 2033

Figure 163: Thailand Market Share Analysis (%) by Printing Technology, 2022 & 2033

Figure 164: Thailand Market Share Analysis (%) by End User, 2022 & 2033

Figure 165: Oceania Market Value (US$ Million) Analysis, 2016 to 2022

Figure 166: Oceania Market Value (US$ Million) Forecast, 2023 to 2033

Figure 167: Oceania Market Value Share, by Material (2023 E)

Figure 168: Oceania Market Value Share, by Printing Technology (2023 E)

Figure 169: Oceania Market Value Share, by End User (2023 E)

Figure 170: Oceania Market Value Share, by Country (2023 E)

Figure 171: Oceania Market Attractiveness Analysis by Material, 2023 to 2033

Figure 172: Oceania Market Attractiveness Analysis by Printing Technology, 2023 to 2033

Figure 173: Oceania Market Attractiveness Analysis by End User, 2023 to 2033

Figure 174: Oceania Market Attractiveness Analysis by Country, 2023 to 2033

Figure 175: Australia Market Value Proportion Analysis, 2022

Figure 176: Global Vs. Australia Growth Comparison

Figure 177: Australia Market Share Analysis (%) by Material, 2022 & 2033

Figure 178: Australia Market Share Analysis (%) by Printing Technology, 2022 & 2033

Figure 179: Australia Market Share Analysis (%) by End User, 2022 & 2033

Figure 180: New Zealand Market Value Proportion Analysis, 2022

Figure 181: Global Vs New Zealand Growth Comparison

Figure 182: New Zealand Market Share Analysis (%) by Material, 2022 & 2033

Figure 183: New Zealand Market Share Analysis (%) by Printing Technology, 2022 & 2033

Figure 184: New Zealand Market Share Analysis (%) by End User, 2022 & 2033

Figure 185: Middle East & Africa Market Value (US$ Million) Analysis, 2016 to 2022

Figure 186: Middle East & Africa Market Value (US$ Million) Forecast, 2023 to 2033

Figure 187: Middle East & Africa Market Value Share, by Material (2023 E)

Figure 188: Middle East & Africa Market Value Share, by Printing Technology (2023 E)

Figure 189: Middle East & Africa Market Value Share, by End User (2023 E)

Figure 190: Middle East & Africa Market Value Share, by Country (2023 E)

Figure 191: Middle East & Africa Market Attractiveness Analysis by Material, 2023 to 2033

Figure 192: Middle East & Africa Market Attractiveness Analysis by Printing Technology, 2023 to 2033

Figure 193: Middle East & Africa Market Attractiveness Analysis by End User, 2023 to 2033

Figure 194: Middle East & Africa Market Attractiveness Analysis by Country, 2023 to 2033

Figure 195: GCC Countries Market Value Proportion Analysis, 2022

Figure 196: Global Vs GCC Countries Growth Comparison

Figure 197: GCC Countries Market Share Analysis (%) by Material, 2022 & 2033

Figure 198: GCC Countries Market Share Analysis (%) by Printing Technology, 2022 & 2033

Figure 199: GCC Countries Market Share Analysis (%) by End User, 2022 & 2033

Figure 200: Türkiye Market Value Proportion Analysis, 2022

Figure 201: Global Vs. Türkiye Growth Comparison

Figure 202: Türkiye Market Share Analysis (%) by Material, 2022 & 2033

Figure 203: Türkiye Market Share Analysis (%) by Printing Technology, 2022 & 2033

Figure 204: Türkiye Market Share Analysis (%) by End User, 2022 & 2033

Figure 205: South Africa Market Value Proportion Analysis, 2022

Figure 206: Global Vs. South Africa Growth Comparison

Figure 207: South Africa Market Share Analysis (%) by Material, 2022 & 2033

Figure 208: South Africa Market Share Analysis (%) by Printing Technology, 2022 & 2033

Figure 209: South Africa Market Share Analysis (%) by End User, 2022 & 2033

Figure 210: North Africa Market Value Proportion Analysis, 2022

Figure 211: Global Vs North Africa Growth Comparison

Figure 212: North Africa Market Share Analysis (%) by Material, 2022 & 2033

Figure 213: North Africa Market Share Analysis (%) by Printing Technology, 2022 & 2033

Figure 214: North Africa Market Share Analysis (%) by End user, 2022 & 2033

Recommendations

Healthcare

Dental Service Market

Published : April 2024

Healthcare

Dental Industry Analysis in Asia Pacific

Published : March 2024

Healthcare

Dental Caries and Endodontic Market

Published : September 2023

Healthcare

Electric Dental Handpiece Market

Published : July 2022

Explore Healthcare Insights

View Reports

3D Printed Clear Dental Aligners Market