3D NAND Flash Memory Market Size and Share Forecast Outlook 2025 to 2035

The 3D NAND Flash Memory Market is estimated to be valued at USD 33.6 billion in 2025 and is projected to reach USD 178.9 billion by 2035, registering a compound annual growth rate (CAGR) of 17.8% over the forecast period.
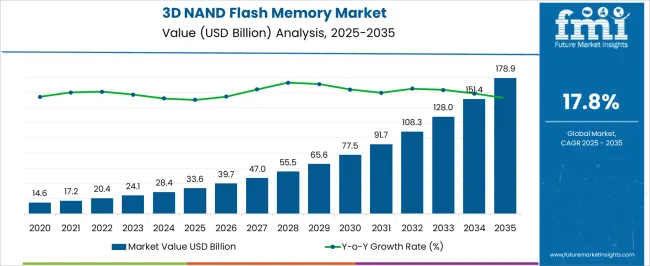
Quick Stats for 3D NAND Flash Memory Market

  • 3D NAND Flash Memory Market Industry Value (2025): USD 33.6 billion
  • 3D NAND Flash Memory Market Forecast Value (2035): USD 178.9 billion
  • 3D NAND Flash Memory Market Forecast CAGR: 17.8%
  • Leading Segment in 3D NAND Flash Memory Market in 2025: Single-Level Cells (42.6%)
  • Key Growth Region in 3D NAND Flash Memory Market: North America, Asia-Pacific, Europe
  • Top Key Players in 3D NAND Flash Memory Market: Intel Corporation, Samsung Group, Micron Technology, Inc., SK Hynix Inc., Toshiba Corporation, Western Digital Corporation, Apple Inc., SanDisk Corp.

3d Nand Flash Memory Market Market Value Analysis

Metric Value
3D NAND Flash Memory Market Estimated Value in (2025 E) USD 33.6 billion
3D NAND Flash Memory Market Forecast Value in (2035 F) USD 178.9 billion
Forecast CAGR (2025 to 2035) 17.8%

Rationale for Segmental Growth in the 3D NAND Flash Memory Market

The 3D NAND flash memory market is advancing steadily, underpinned by escalating demand for high-capacity and energy-efficient storage solutions across consumer and enterprise domains. Industry disclosures and technology press releases have emphasized the role of 3D NAND in overcoming density limitations of planar NAND through vertical stacking, delivering improved performance and lower cost per bit.

Continuous investment by semiconductor manufacturers into advanced process nodes and higher-layer architectures has supported rapid capacity scaling and enhanced endurance. Smartphone adoption, growth in connected devices, and expansion of cloud computing have further driven consumption of 3D NAND across multiple applications.

The market outlook remains favorable as the technology continues to enable next-generation use cases in 5G devices, IoT systems, and data-intensive computing. Segmental expansion is being led by Single-Level Cells for their reliability, Smartphones and Tablets for their mass adoption of high-performance memory, and Consumer Electronics due to the sheer scale of demand for portable storage, entertainment systems, and digital appliances.
Segmental Analysis

Insights into the Type Segment: Single-Level Cells

3d Nand Flash Memory Market Analysis By Type

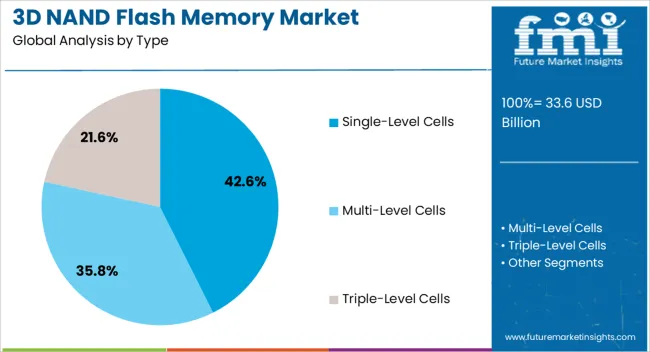
The Single-Level Cells (SLC) segment is projected to hold 42.6% of the 3D NAND flash memory market revenue in 2025, securing its position as the leading type. Growth in this segment has been shaped by its superior reliability, faster write speeds, and higher endurance compared to multi-level or triple-level alternatives. Semiconductor industry updates have highlighted that SLC memory continues to be favored in applications where data integrity and durability are critical.

Manufacturers have optimized production processes to deliver SLC with enhanced performance while addressing cost challenges, sustaining its adoption in high-performance devices. Additionally, its low error rates and longer lifespan have reinforced its deployment in systems requiring consistent and stable operation.

These factors have positioned SLC as the preferred choice for applications demanding robust memory performance, maintaining its significant market share within the broader 3D NAND landscape.
Insights into the Application Segment: Smartphones and Tablets

3d Nand Flash Memory Market Analysis By Application

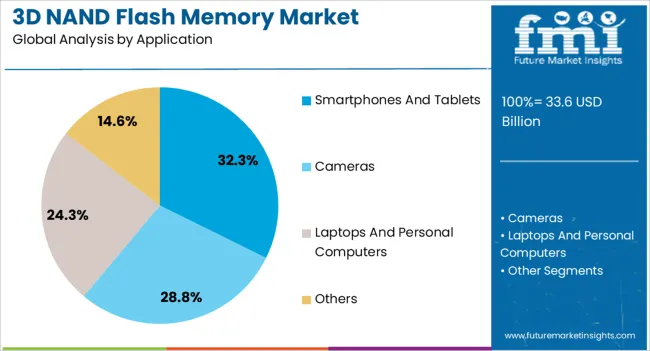
The Smartphones and Tablets segment is projected to contribute 32.3% of the 3D NAND flash memory market revenue in 2025, representing the dominant application category. Market growth has been driven by increasing consumer demand for devices with greater storage capacity to support high-resolution media, mobile gaming, and app ecosystems. Device makers have integrated 3D NAND flash memory to deliver compact storage with faster data access speeds and reduced power consumption, meeting user expectations for performance and battery efficiency.

Industry reports have noted that the widespread adoption of 5G-enabled smartphones has further accelerated the integration of higher-capacity 3D NAND solutions. The growing reliance on mobile devices for both personal and professional use has ensured steady demand, while the need for differentiated device features has reinforced the role of advanced memory technologies.

This trajectory is expected to sustain Smartphones and Tablets as the leading application segment for 3D NAND flash memory.
Insights into the End User Segment: Consumer Electronics

3d Nand Flash Memory Market Analysis By End User

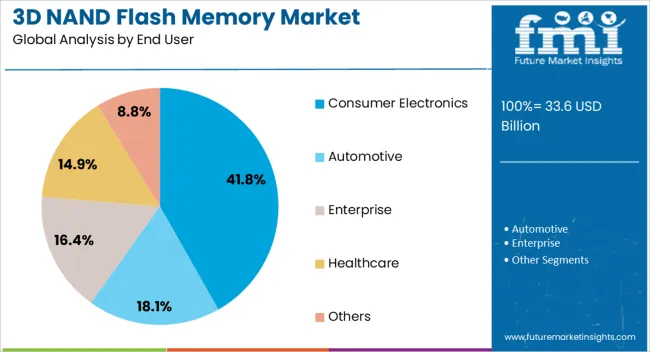
The Consumer Electronics segment is projected to account for 41.8% of the 3D NAND flash memory market revenue in 2025, establishing itself as the leading end-user category. Growth in this segment has been supported by the rising proliferation of smart devices, digital entertainment platforms, and home automation systems. Consumer electronics brands have relied on 3D NAND flash memory to deliver faster storage, compact form factors, and cost-efficient scalability, addressing the evolving expectations of digital consumers.

Press releases and corporate presentations from major manufacturers have highlighted continuous innovation in storage density and durability, ensuring alignment with consumer product lifecycles. Additionally, the expansion of wearables, gaming consoles, and personal computing devices has amplified memory consumption.

As consumer lifestyles become increasingly digital and data-intensive, the Consumer Electronics segment is expected to maintain its dominance, driven by ongoing demand for enhanced device functionality and user experience.

3D NAND Flash Memory Market Trends

As the demand for high-capacity storage solutions increases, the technology is being increasingly adopted in other electronic devices such as smartphones, laptops, tablets, and enterprise storage systems. Advancements in the industry have led to manufacturers curating higher-layer 3D NAND technology to increase storage densities and reduce manufacturing costs.

The emergence of Quad-Level Cell (QLC) NAND flash, which has better storage capabilities as compared to the conventional vertical NAND components, has revolutionized the industry. Manufacturers are also focusing on increasing the performance of 3D NAND flash memory so that they can cater to a wide spectrum of consumers and businesses in the industrial landscape.

Category-wise Insights

The section below explains different segments and their shares in the global market. As per type, single-level cells are anticipated to remain at the forefront by accounting for a 42.6% share in 2025. By application, the smartphone and tablet category is projected to lead by holding a share of 32.3% in 2025.

Single-level Cell Flash Memory Technologies Gain Traction

3D NAND flash memory storage devices are categorized by type on the basis of levels, including single-cell, multi-level cell, triple-level cell, and others. Among these, the single-level cell segment holds an industry share of 42.6% in 2025.

Attributes Details
Type Single-level Cell
Share (2025) 42.6%

The demand for single-level cell (SLC) flash memory has skyrocketed in the past few years as it has the highest endurance among all flash memory types. This is because it stores only one bit of data per cell, making it suitable for applications that require frequent read/write operations over an extended period.

The prominence of SLC flash memory across industries is also rising as they offer faster read and write speeds compared to Multi-Level Cell (MLC) or Triple-Level Cell (TLC) flash memory.

Smartphone and Tablet Manufacturers to Utilize 3D NAND Flash Memory Solutions

The newly launched 3D NAND flash memory technology is being integrated into various electronic devices, such as cameras, laptops & personal computers, smartphones & tablets. Among these, the smartphones and tablets segment holds the maximum share of 32.3% of the overall industry in 2025.

Attributes Details
Applications Smartphones and Tablets
Share (2025) 32.3%

The use of these technologies among smartphone and tablet manufacturing companies has skyrocketed in the past few years. This is primarily due to their capability of storing large quantities of data in a smaller physical footprint compared to planar NAND.

With technological breakthroughs, 3D NAND flash memory is able to offer faster read and write speeds. This leads to better overall performance and responsiveness of smartphones and tablets.

Country-wise Insights

The section discusses the region-wise insights of this market. Considering these figures, it can be projected that the market is spread across the globe and is not confined to any region. Developed and developing economies like Australia, China, the United States, Japan, and Germany are considered to become some of the most lucrative countries in this industry.

Countries CAGR (2025 to 2035)
Australia 21.7%
China 18.7%
United States 12.3%
Germany 7.7%
Japan 7%

Rising Demand for Consumer Electronics Fuel Demand in Australia

Australia, as a country, has experienced a tremendous rise in the sales of consumer electronics products, such as smartphones, tablets, laptops, personal computers, etc., in the last few decades. These devices are equipped with advanced 3D NAND memory chipsets so that they can store significant amounts of data in smaller spaces.

This has generated a huge demand for vertical NAND chips in the country, the market for which is slated to rise at a CAGR of 21.7% through 2035. Besides this, the influx of multinational corporate companies with rapid globalization, has also benefitted the industry in the country.

China’s Dominance in Smartphone Manufacturing Benefits Industry Expansion

China is one of the largest manufacturers of electronics, especially smartphones and tablets. The country witnesses the presence of a multitude of smartphone manufacturers that have a consumer base not just within China but also worldwide. Companies like Huawei, Oppo, Xiaomi, Vivo, OnePlus, etc., generate huge demand for 3D NAND flash memory solutions.

Ongoing trends in the Chinese industrial landscape justify the estimated 18.7% CAGR through 2035. Apart from this, the country is expanding its data center infrastructure to support its growing digital economy. Government as well as the private sector entities are investing heavily in the construction of large-scale data centers which are further contributing to the industry’s growth.

Semiconductor Prowess of the United States Profits Industry Growth

Several industry giants, such as Intel, Micron Technology, and Western Digital, are located in Silicon Valley, United States. This strong presence of leading companies in the country, with hefty investments and extensive research & development activities, is driving innovation in 3D NAND flash memory technology.

The United States market is set to report a 12.3% CAGR through 2035. Besides this, the expansion of cloud computing and data center sectors in the United States has increased the adoption of vertical NAND flash memory solutions.

Automotive Sector Takes Care of the German 3D NAND Flash Memory Market

Germany is one of the top countries in this industry. It is slated to progress at a considerable CAGR of 7.7% through 2035.?

Germany is home to some of the world's leading automotive manufacturers, including Volkswagen, BMW, and Mercedes-Benz. These companies generate an excellent demand for high-performance storage solutions based on 3D NAND flash memory.

They are one of the essential components in advanced electronic systems, including infotainment systems, navigation systems, and ADAS. The emergence of Industry 4.0 in Germany’s engineering manufacturing landscape is also contributing positively to the industry.

Japan to Exhibit Healthy Growth Rate in the Next Decade

Japan, from the beginning of the century, has been welcoming technological innovation and is known for its strong prominence in the semiconductor manufacturing industry. The sector is anticipated to showcase a CAGR of 7% through 2035 due to the existence of companies like Toshiba Memory Corporation and Kioxia Corporation. These companies are investing heavily in curating novel breakthroughs in 3D NAND flash memory technology.
Competitive Landscape

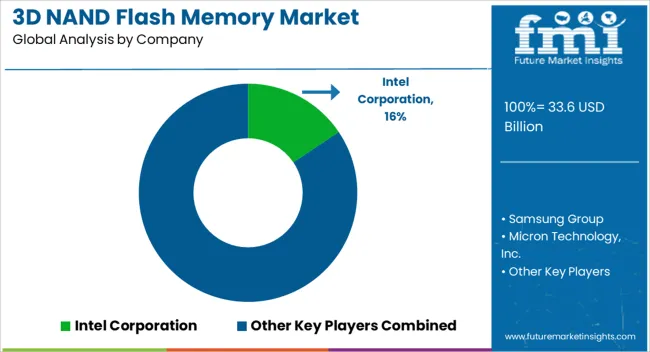
3d Nand Flash Memory Market Analysis By Company

The 3D NAND flash memory market is a very mature one with a multitude of tech companies competing for international dominance. These companies, who already have established themselves in the tech background are investing a substantial amount of their financial capital in the development of more powerful, smaller, and interoperable memory chips.

They are also collaborating with electronics manufacturing players so that they can take advantage of each other's expertise.

Some of the prominent companies in the sector are Samsung Electronics, SK Hynix, Micron Technology, Intel Corporation, Kioxia Corporation, Western Digital Corporation, SanDisk, Nanya Technology Corporation, and Powerchip Technology Corporation.

Recent Developments:

  • In April 2025, Samsung Electronics Co., based in South Korea, launched mass production of its latest 286-layer NAND chips, increasing storage capacity by 50%. Samples were shipped to tech giants like Google and Apple, targeting AI data centers and smartphones.
  • In April 2025, Japan-based Kioxia announced its plan to mass-produce 3D NAND memory with over 1,000 layers by 2035. Hidefumi Miyajima, the company's CTO, discussed the technical challenges and solutions for achieving this during a lecture at the 71st Applied Physics Society Spring Meeting at Tokyo City University.
  • In October 2025, despite facing US sanctions, China's YMTC unveiled the world's most advanced 3D NAND memory chip, the 232-layer X3-9070. This breakthrough showcased China's commitment to its semiconductor industry amid international challenges.
  • In August 2025, SK Hynix, based in South Korea, revealed its groundbreaking 321-layer 3D NAND flash technology at the Flash Memory Summit. The innovation boasted a storage capacity of 1Tbit per silicon die, marking a significant advancement in storage density and performance over its predecessor.
  • In July 2025, CEO Andy Hsu of California-based NEO Semiconductor presented ground-breaking 3D NAND and 3D DRAM architectures at Flash Memory Summit 2025 in Santa Clara. The new AI application "Local Computing" drastically increased AI chip performance to unprecedented levels.
  • In October 2025, China-based Yangtze Memory developed 120-layer NAND flash memory, reportedly as a response to US restrictions on 3D NAND sales to China. This technology, based on enhanced Xtacking, is seen as a strategic move to overcome limitations in the industry.
  • In December 2025, SK Hynix, headquartered in South Korea, actively recruited Richard Pasto, a senior lead engineer from Intel, to bolster its research & development capabilities. Pasto, with 28 years of experience, joined other Intel experts like Rezaul Haque and Erika Shiple, who had joined in June and November 2025, respectively.
  • In October 2025, Japan-based Tokyo Electron unveiled a groundbreaking innovation in 3D NAND flash memory technology, posing a significant threat to Lam Research's industry dominance. This innovation, aimed at increasing storage density, involved a new method for etching channel holes in memory cells.

Key Companies

  • Samsung Electronics
  • SK Hynix
  • Micron Technology
  • Intel Corporation
  • Kioxia Corporation (formerly Toshiba Memory Corporation)
  • Western Digital Corporation
  • SanDisk (a division of Western Digital)
  • Nanya Technology Corporation
  • Powerchip Technology Corporation
  • YMTC (Yangtze Memory Technologies Co., Ltd.)
  • Intel-Micron Flash Technologies (IMFT)
  • XMC (Xiamen Xinxin Semiconductor Manufacturing Corporation)
  • Macronix International
  • Transcend Information
  • ADATA Technology
  • Phison Electronics Corporation
  • Silicon Motion Technology Corporation
  • Netlist, Inc.
  • SK Hynix System IC, Inc.
  • GigaDevice Semiconductor (Beijing) Inc.

Key Segments of the 3D NAND Flash Memory Market

By Type:

On the basis of type, the 3D NAND flash memory market is segmented into single-level cells, multi-level cells, and triple-level cells.

By Application:

Based on applications, the 3D NAND flash memory market is divided into cameras, laptops and personal computers, smartphones and tablets, and others.

By End User:

Based on end-users, the 3D NAND flash memory market is segmented into automotive, consumer electronics, enterprise, healthcare, and others.

By Region:

As per regions, the 3D NAND flash memory market is divided into North America, Latin America, Europe, Asia Pacific, and the Middle East and Africa

Frequently Asked Questions

How big is the 3D NAND flash memory market in 2025?

The global 3D NAND flash memory market is estimated to be valued at USD 33.6 billion in 2025.

What will be the size of 3D NAND flash memory market in 2035?

The market size for the 3D NAND flash memory market is projected to reach USD 178.9 billion by 2035.

How much will be the 3D NAND flash memory market growth between 2025 and 2035?

The 3D NAND flash memory market is expected to grow at a 17.8% CAGR between 2025 and 2035.

What are the key product types in the 3D NAND flash memory market?

The key product types in 3D NAND flash memory market are single-level cells, multi-level cells and triple-level cells.

Which application segment to contribute significant share in the 3D NAND flash memory market in 2025?

In terms of application, smartphones and tablets segment to command 32.3% share in the 3D NAND flash memory market in 2025.

Table of Content

  1. Executive Summary
    • Global Market Outlook
    • Demand-side Trends
    • Supply-side Trends
    • Technology Roadmap Analysis
    • Analysis and Recommendations
  2. Market Overview
    • Market Coverage / Taxonomy
    • Market Definition / Scope / Limitations
  3. Market Background
    • Market Dynamics
      • Drivers
      • Restraints
      • Opportunity
      • Trends
    • Scenario Forecast
      • Demand in Optimistic Scenario
      • Demand in Likely Scenario
      • Demand in Conservative Scenario
    • Opportunity Map Analysis
    • Product Life Cycle Analysis
    • Supply Chain Analysis
    • Investment Feasibility Matrix
    • Value Chain Analysis
    • PESTLE and Porter’s Analysis
    • Regulatory Landscape
    • Regional Parent Market Outlook
    • Production and Consumption Statistics
    • Import and Export Statistics
  4. Global Market Analysis 2020 to 2024 and Forecast, 2025 to 2035
    • Historical Market Size Value (USD Million) Analysis, 2020 to 2024
    • Current and Future Market Size Value (USD Million) Projections, 2025 to 2035
      • Y-o-Y Growth Trend Analysis
      • Absolute $ Opportunity Analysis
  5. Global Market Pricing Analysis 2020 to 2024 and Forecast 2025 to 2035
  6. Global Market Analysis 2020 to 2024 and Forecast 2025 to 2035, By Type
    • Introduction / Key Findings
    • Historical Market Size Value (USD Million) Analysis By Type , 2020 to 2024
    • Current and Future Market Size Value (USD Million) Analysis and Forecast By Type , 2025 to 2035
      • Single-Level Cells
      • Multi-Level Cells
      • Triple-Level Cells
    • Y-o-Y Growth Trend Analysis By Type , 2020 to 2024
    • Absolute $ Opportunity Analysis By Type , 2025 to 2035
  7. Global Market Analysis 2020 to 2024 and Forecast 2025 to 2035, By Application
    • Introduction / Key Findings
    • Historical Market Size Value (USD Million) Analysis By Application, 2020 to 2024
    • Current and Future Market Size Value (USD Million) Analysis and Forecast By Application, 2025 to 2035
      • Smartphones And Tablets
      • Cameras
      • Laptops And Personal Computers
      • Others
    • Y-o-Y Growth Trend Analysis By Application, 2020 to 2024
    • Absolute $ Opportunity Analysis By Application, 2025 to 2035
  8. Global Market Analysis 2020 to 2024 and Forecast 2025 to 2035, By End User
    • Introduction / Key Findings
    • Historical Market Size Value (USD Million) Analysis By End User, 2020 to 2024
    • Current and Future Market Size Value (USD Million) Analysis and Forecast By End User, 2025 to 2035
      • Consumer Electronics
      • Automotive
      • Enterprise
      • Healthcare
      • Others
    • Y-o-Y Growth Trend Analysis By End User, 2020 to 2024
    • Absolute $ Opportunity Analysis By End User, 2025 to 2035
  9. Global Market Analysis 2020 to 2024 and Forecast 2025 to 2035, By Region
    • Introduction
    • Historical Market Size Value (USD Million) Analysis By Region, 2020 to 2024
    • Current Market Size Value (USD Million) Analysis and Forecast By Region, 2025 to 2035
      • North America
      • Latin America
      • Western Europe
      • Eastern Europe
      • East Asia
      • South Asia and Pacific
      • Middle East & Africa
    • Market Attractiveness Analysis By Region
  10. North America Market Analysis 2020 to 2024 and Forecast 2025 to 2035, By Country
    • Historical Market Size Value (USD Million) Trend Analysis By Market Taxonomy, 2020 to 2024
    • Market Size Value (USD Million) Forecast By Market Taxonomy, 2025 to 2035
      • By Country
        • USA
        • Canada
        • Mexico
      • By Type
      • By Application
      • By End User
    • Market Attractiveness Analysis
      • By Country
      • By Type
      • By Application
      • By End User
    • Key Takeaways
  11. Latin America Market Analysis 2020 to 2024 and Forecast 2025 to 2035, By Country
    • Historical Market Size Value (USD Million) Trend Analysis By Market Taxonomy, 2020 to 2024
    • Market Size Value (USD Million) Forecast By Market Taxonomy, 2025 to 2035
      • By Country
        • Brazil
        • Chile
        • Rest of Latin America
      • By Type
      • By Application
      • By End User
    • Market Attractiveness Analysis
      • By Country
      • By Type
      • By Application
      • By End User
    • Key Takeaways
  12. Western Europe Market Analysis 2020 to 2024 and Forecast 2025 to 2035, By Country
    • Historical Market Size Value (USD Million) Trend Analysis By Market Taxonomy, 2020 to 2024
    • Market Size Value (USD Million) Forecast By Market Taxonomy, 2025 to 2035
      • By Country
        • Germany
        • UK
        • Italy
        • Spain
        • France
        • Nordic
        • BENELUX
        • Rest of Western Europe
      • By Type
      • By Application
      • By End User
    • Market Attractiveness Analysis
      • By Country
      • By Type
      • By Application
      • By End User
    • Key Takeaways
  13. Eastern Europe Market Analysis 2020 to 2024 and Forecast 2025 to 2035, By Country
    • Historical Market Size Value (USD Million) Trend Analysis By Market Taxonomy, 2020 to 2024
    • Market Size Value (USD Million) Forecast By Market Taxonomy, 2025 to 2035
      • By Country
        • Russia
        • Poland
        • Hungary
        • Balkan & Baltic
        • Rest of Eastern Europe
      • By Type
      • By Application
      • By End User
    • Market Attractiveness Analysis
      • By Country
      • By Type
      • By Application
      • By End User
    • Key Takeaways
  14. East Asia Market Analysis 2020 to 2024 and Forecast 2025 to 2035, By Country
    • Historical Market Size Value (USD Million) Trend Analysis By Market Taxonomy, 2020 to 2024
    • Market Size Value (USD Million) Forecast By Market Taxonomy, 2025 to 2035
      • By Country
        • China
        • Japan
        • South Korea
      • By Type
      • By Application
      • By End User
    • Market Attractiveness Analysis
      • By Country
      • By Type
      • By Application
      • By End User
    • Key Takeaways
  15. South Asia and Pacific Market Analysis 2020 to 2024 and Forecast 2025 to 2035, By Country
    • Historical Market Size Value (USD Million) Trend Analysis By Market Taxonomy, 2020 to 2024
    • Market Size Value (USD Million) Forecast By Market Taxonomy, 2025 to 2035
      • By Country
        • India
        • ASEAN
        • Australia & New Zealand
        • Rest of South Asia and Pacific
      • By Type
      • By Application
      • By End User
    • Market Attractiveness Analysis
      • By Country
      • By Type
      • By Application
      • By End User
    • Key Takeaways
  16. Middle East & Africa Market Analysis 2020 to 2024 and Forecast 2025 to 2035, By Country
    • Historical Market Size Value (USD Million) Trend Analysis By Market Taxonomy, 2020 to 2024
    • Market Size Value (USD Million) Forecast By Market Taxonomy, 2025 to 2035
      • By Country
        • Kingdom of Saudi Arabia
        • Other GCC Countries
        • Turkiye
        • South Africa
        • Other African Union
        • Rest of Middle East & Africa
      • By Type
      • By Application
      • By End User
    • Market Attractiveness Analysis
      • By Country
      • By Type
      • By Application
      • By End User
    • Key Takeaways
  17. Key Countries Market Analysis
    • USA
      • Pricing Analysis
      • Market Share Analysis, 2024
        • By Type
        • By Application
        • By End User
    • Canada
      • Pricing Analysis
      • Market Share Analysis, 2024
        • By Type
        • By Application
        • By End User
    • Mexico
      • Pricing Analysis
      • Market Share Analysis, 2024
        • By Type
        • By Application
        • By End User
    • Brazil
      • Pricing Analysis
      • Market Share Analysis, 2024
        • By Type
        • By Application
        • By End User
    • Chile
      • Pricing Analysis
      • Market Share Analysis, 2024
        • By Type
        • By Application
        • By End User
    • Germany
      • Pricing Analysis
      • Market Share Analysis, 2024
        • By Type
        • By Application
        • By End User
    • UK
      • Pricing Analysis
      • Market Share Analysis, 2024
        • By Type
        • By Application
        • By End User
    • Italy
      • Pricing Analysis
      • Market Share Analysis, 2024
        • By Type
        • By Application
        • By End User
    • Spain
      • Pricing Analysis
      • Market Share Analysis, 2024
        • By Type
        • By Application
        • By End User
    • France
      • Pricing Analysis
      • Market Share Analysis, 2024
        • By Type
        • By Application
        • By End User
    • India
      • Pricing Analysis
      • Market Share Analysis, 2024
        • By Type
        • By Application
        • By End User
    • ASEAN
      • Pricing Analysis
      • Market Share Analysis, 2024
        • By Type
        • By Application
        • By End User
    • Australia & New Zealand
      • Pricing Analysis
      • Market Share Analysis, 2024
        • By Type
        • By Application
        • By End User
    • China
      • Pricing Analysis
      • Market Share Analysis, 2024
        • By Type
        • By Application
        • By End User
    • Japan
      • Pricing Analysis
      • Market Share Analysis, 2024
        • By Type
        • By Application
        • By End User
    • South Korea
      • Pricing Analysis
      • Market Share Analysis, 2024
        • By Type
        • By Application
        • By End User
    • Russia
      • Pricing Analysis
      • Market Share Analysis, 2024
        • By Type
        • By Application
        • By End User
    • Poland
      • Pricing Analysis
      • Market Share Analysis, 2024
        • By Type
        • By Application
        • By End User
    • Hungary
      • Pricing Analysis
      • Market Share Analysis, 2024
        • By Type
        • By Application
        • By End User
    • Kingdom of Saudi Arabia
      • Pricing Analysis
      • Market Share Analysis, 2024
        • By Type
        • By Application
        • By End User
    • Turkiye
      • Pricing Analysis
      • Market Share Analysis, 2024
        • By Type
        • By Application
        • By End User
    • South Africa
      • Pricing Analysis
      • Market Share Analysis, 2024
        • By Type
        • By Application
        • By End User
  18. Market Structure Analysis
    • Competition Dashboard
    • Competition Benchmarking
    • Market Share Analysis of Top Players
      • By Regional
      • By Type
      • By Application
      • By End User
  19. Competition Analysis
    • Competition Deep Dive
      • Intel Corporation
        • Overview
        • Product Portfolio
        • Profitability by Market Segments (Product/Age /Sales Channel/Region)
        • Sales Footprint
        • Strategy Overview
          • Marketing Strategy
          • Product Strategy
          • Channel Strategy
      • Samsung Group
      • Micron Technology, Inc.
      • SK Hynix Inc.
      • Toshiba Corporation
      • Western Digital Corporation
      • Apple Inc.
      • SanDisk Corp.
  20. Assumptions & Acronyms Used
  21. Research Methodology

List of Tables

  • Table 1: Global Market Value (USD Million) Forecast by Region, 2020-2035
  • Table 2: Global Market Value (USD Million) Forecast by Type , 2020-2035
  • Table 3: Global Market Value (USD Million) Forecast by Application, 2020-2035
  • Table 4: Global Market Value (USD Million) Forecast by End User, 2020-2035
  • Table 5: North America Market Value (USD Million) Forecast by Country, 2020-2035
  • Table 6: North America Market Value (USD Million) Forecast by Type , 2020-2035
  • Table 7: North America Market Value (USD Million) Forecast by Application, 2020-2035
  • Table 8: North America Market Value (USD Million) Forecast by End User, 2020-2035
  • Table 9: Latin America Market Value (USD Million) Forecast by Country, 2020-2035
  • Table 10: Latin America Market Value (USD Million) Forecast by Type , 2020-2035
  • Table 11: Latin America Market Value (USD Million) Forecast by Application, 2020-2035
  • Table 12: Latin America Market Value (USD Million) Forecast by End User, 2020-2035
  • Table 13: Western Europe Market Value (USD Million) Forecast by Country, 2020-2035
  • Table 14: Western Europe Market Value (USD Million) Forecast by Type , 2020-2035
  • Table 15: Western Europe Market Value (USD Million) Forecast by Application, 2020-2035
  • Table 16: Western Europe Market Value (USD Million) Forecast by End User, 2020-2035
  • Table 17: Eastern Europe Market Value (USD Million) Forecast by Country, 2020-2035
  • Table 18: Eastern Europe Market Value (USD Million) Forecast by Type , 2020-2035
  • Table 19: Eastern Europe Market Value (USD Million) Forecast by Application, 2020-2035
  • Table 20: Eastern Europe Market Value (USD Million) Forecast by End User, 2020-2035
  • Table 21: East Asia Market Value (USD Million) Forecast by Country, 2020-2035
  • Table 22: East Asia Market Value (USD Million) Forecast by Type , 2020-2035
  • Table 23: East Asia Market Value (USD Million) Forecast by Application, 2020-2035
  • Table 24: East Asia Market Value (USD Million) Forecast by End User, 2020-2035
  • Table 25: South Asia and Pacific Market Value (USD Million) Forecast by Country, 2020-2035
  • Table 26: South Asia and Pacific Market Value (USD Million) Forecast by Type , 2020-2035
  • Table 27: South Asia and Pacific Market Value (USD Million) Forecast by Application, 2020-2035
  • Table 28: South Asia and Pacific Market Value (USD Million) Forecast by End User, 2020-2035
  • Table 29: Middle East & Africa Market Value (USD Million) Forecast by Country, 2020-2035
  • Table 30: Middle East & Africa Market Value (USD Million) Forecast by Type , 2020-2035
  • Table 31: Middle East & Africa Market Value (USD Million) Forecast by Application, 2020-2035
  • Table 32: Middle East & Africa Market Value (USD Million) Forecast by End User, 2020-2035

List of Figures

  • Figure 1: Global Market Pricing Analysis
  • Figure 2: Global Market Value (USD Million) Forecast 2020-2035
  • Figure 3: Global Market Value Share and BPS Analysis by Type , 2025 and 2035
  • Figure 4: Global Market Y-o-Y Growth Comparison by Type , 2025-2035
  • Figure 5: Global Market Attractiveness Analysis by Type
  • Figure 6: Global Market Value Share and BPS Analysis by Application, 2025 and 2035
  • Figure 7: Global Market Y-o-Y Growth Comparison by Application, 2025-2035
  • Figure 8: Global Market Attractiveness Analysis by Application
  • Figure 9: Global Market Value Share and BPS Analysis by End User, 2025 and 2035
  • Figure 10: Global Market Y-o-Y Growth Comparison by End User, 2025-2035
  • Figure 11: Global Market Attractiveness Analysis by End User
  • Figure 12: Global Market Value (USD Million) Share and BPS Analysis by Region, 2025 and 2035
  • Figure 13: Global Market Y-o-Y Growth Comparison by Region, 2025-2035
  • Figure 14: Global Market Attractiveness Analysis by Region
  • Figure 15: North America Market Incremental Dollar Opportunity, 2025-2035
  • Figure 16: Latin America Market Incremental Dollar Opportunity, 2025-2035
  • Figure 17: Western Europe Market Incremental Dollar Opportunity, 2025-2035
  • Figure 18: Eastern Europe Market Incremental Dollar Opportunity, 2025-2035
  • Figure 19: East Asia Market Incremental Dollar Opportunity, 2025-2035
  • Figure 20: South Asia and Pacific Market Incremental Dollar Opportunity, 2025-2035
  • Figure 21: Middle East & Africa Market Incremental Dollar Opportunity, 2025-2035
  • Figure 22: North America Market Value Share and BPS Analysis by Country, 2025 and 2035
  • Figure 23: North America Market Value Share and BPS Analysis by Type , 2025 and 2035
  • Figure 24: North America Market Y-o-Y Growth Comparison by Type , 2025-2035
  • Figure 25: North America Market Attractiveness Analysis by Type
  • Figure 26: North America Market Value Share and BPS Analysis by Application, 2025 and 2035
  • Figure 27: North America Market Y-o-Y Growth Comparison by Application, 2025-2035
  • Figure 28: North America Market Attractiveness Analysis by Application
  • Figure 29: North America Market Value Share and BPS Analysis by End User, 2025 and 2035
  • Figure 30: North America Market Y-o-Y Growth Comparison by End User, 2025-2035
  • Figure 31: North America Market Attractiveness Analysis by End User
  • Figure 32: Latin America Market Value Share and BPS Analysis by Country, 2025 and 2035
  • Figure 33: Latin America Market Value Share and BPS Analysis by Type , 2025 and 2035
  • Figure 34: Latin America Market Y-o-Y Growth Comparison by Type , 2025-2035
  • Figure 35: Latin America Market Attractiveness Analysis by Type
  • Figure 36: Latin America Market Value Share and BPS Analysis by Application, 2025 and 2035
  • Figure 37: Latin America Market Y-o-Y Growth Comparison by Application, 2025-2035
  • Figure 38: Latin America Market Attractiveness Analysis by Application
  • Figure 39: Latin America Market Value Share and BPS Analysis by End User, 2025 and 2035
  • Figure 40: Latin America Market Y-o-Y Growth Comparison by End User, 2025-2035
  • Figure 41: Latin America Market Attractiveness Analysis by End User
  • Figure 42: Western Europe Market Value Share and BPS Analysis by Country, 2025 and 2035
  • Figure 43: Western Europe Market Value Share and BPS Analysis by Type , 2025 and 2035
  • Figure 44: Western Europe Market Y-o-Y Growth Comparison by Type , 2025-2035
  • Figure 45: Western Europe Market Attractiveness Analysis by Type
  • Figure 46: Western Europe Market Value Share and BPS Analysis by Application, 2025 and 2035
  • Figure 47: Western Europe Market Y-o-Y Growth Comparison by Application, 2025-2035
  • Figure 48: Western Europe Market Attractiveness Analysis by Application
  • Figure 49: Western Europe Market Value Share and BPS Analysis by End User, 2025 and 2035
  • Figure 50: Western Europe Market Y-o-Y Growth Comparison by End User, 2025-2035
  • Figure 51: Western Europe Market Attractiveness Analysis by End User
  • Figure 52: Eastern Europe Market Value Share and BPS Analysis by Country, 2025 and 2035
  • Figure 53: Eastern Europe Market Value Share and BPS Analysis by Type , 2025 and 2035
  • Figure 54: Eastern Europe Market Y-o-Y Growth Comparison by Type , 2025-2035
  • Figure 55: Eastern Europe Market Attractiveness Analysis by Type
  • Figure 56: Eastern Europe Market Value Share and BPS Analysis by Application, 2025 and 2035
  • Figure 57: Eastern Europe Market Y-o-Y Growth Comparison by Application, 2025-2035
  • Figure 58: Eastern Europe Market Attractiveness Analysis by Application
  • Figure 59: Eastern Europe Market Value Share and BPS Analysis by End User, 2025 and 2035
  • Figure 60: Eastern Europe Market Y-o-Y Growth Comparison by End User, 2025-2035
  • Figure 61: Eastern Europe Market Attractiveness Analysis by End User
  • Figure 62: East Asia Market Value Share and BPS Analysis by Country, 2025 and 2035
  • Figure 63: East Asia Market Value Share and BPS Analysis by Type , 2025 and 2035
  • Figure 64: East Asia Market Y-o-Y Growth Comparison by Type , 2025-2035
  • Figure 65: East Asia Market Attractiveness Analysis by Type
  • Figure 66: East Asia Market Value Share and BPS Analysis by Application, 2025 and 2035
  • Figure 67: East Asia Market Y-o-Y Growth Comparison by Application, 2025-2035
  • Figure 68: East Asia Market Attractiveness Analysis by Application
  • Figure 69: East Asia Market Value Share and BPS Analysis by End User, 2025 and 2035
  • Figure 70: East Asia Market Y-o-Y Growth Comparison by End User, 2025-2035
  • Figure 71: East Asia Market Attractiveness Analysis by End User
  • Figure 72: South Asia and Pacific Market Value Share and BPS Analysis by Country, 2025 and 2035
  • Figure 73: South Asia and Pacific Market Value Share and BPS Analysis by Type , 2025 and 2035
  • Figure 74: South Asia and Pacific Market Y-o-Y Growth Comparison by Type , 2025-2035
  • Figure 75: South Asia and Pacific Market Attractiveness Analysis by Type
  • Figure 76: South Asia and Pacific Market Value Share and BPS Analysis by Application, 2025 and 2035
  • Figure 77: South Asia and Pacific Market Y-o-Y Growth Comparison by Application, 2025-2035
  • Figure 78: South Asia and Pacific Market Attractiveness Analysis by Application
  • Figure 79: South Asia and Pacific Market Value Share and BPS Analysis by End User, 2025 and 2035
  • Figure 80: South Asia and Pacific Market Y-o-Y Growth Comparison by End User, 2025-2035
  • Figure 81: South Asia and Pacific Market Attractiveness Analysis by End User
  • Figure 82: Middle East & Africa Market Value Share and BPS Analysis by Country, 2025 and 2035
  • Figure 83: Middle East & Africa Market Value Share and BPS Analysis by Type , 2025 and 2035
  • Figure 84: Middle East & Africa Market Y-o-Y Growth Comparison by Type , 2025-2035
  • Figure 85: Middle East & Africa Market Attractiveness Analysis by Type
  • Figure 86: Middle East & Africa Market Value Share and BPS Analysis by Application, 2025 and 2035
  • Figure 87: Middle East & Africa Market Y-o-Y Growth Comparison by Application, 2025-2035
  • Figure 88: Middle East & Africa Market Attractiveness Analysis by Application
  • Figure 89: Middle East & Africa Market Value Share and BPS Analysis by End User, 2025 and 2035
  • Figure 90: Middle East & Africa Market Y-o-Y Growth Comparison by End User, 2025-2035
  • Figure 91: Middle East & Africa Market Attractiveness Analysis by End User
  • Figure 92: Global Market - Tier Structure Analysis
  • Figure 93: Global Market - Company Share Analysis
Dashboard
Dashboard
Dashboard
Dashboard
Dashboard
Dashboard

Full Research Suite comprises of:

Market outlook & trends analysis

Market outlook & trends analysis

Interviews & case studies

Interviews & case studies

Strategic recommendations

Strategic recommendations

Vendor profiles & capabilities analysis

Vendor profiles & capabilities analysis

5-year forecasts

5-year forecasts

8 regions and 60+ country-level data splits

8 regions and 60+ country-level data splits

Market segment data splits

Market segment data splits

12 months of continuous data updates

12 months of continuous data updates

DELIVERED AS:

PDF EXCEL ONLINE

Full Research Suite


$5000

$7500

$10000

Buy Report Now
Similar Industry Reports

Similar Industry Reports

3D Printed Dental Brace Market

3D Printed Dental Brace Market Size and Share Forecast Outlook 2025 to 2035

3D Reverse Engineering Software Market

3D Reverse Engineering Software Market Forecast and Outlook 2025 to 2035

3D Automatic Optical Inspection Machine Market

3D Automatic Optical Inspection Machine Market Size and Share Forecast Outlook 2025 to 2035

3D Ready Organoid Expansion Service Market

3D Ready Organoid Expansion Service Market Size and Share Forecast Outlook 2025 to 2035

3D Imaging Surgical Solution Market

3D Imaging Surgical Solution Market Size and Share Forecast Outlook 2025 to 2035

3D-Printed Prosthetic Implants Market

3D-Printed Prosthetic Implants Market Size and Share Forecast Outlook 2025 to 2035

3D Printing Ceramics Market

3D Printing Ceramics Market Size and Share Forecast Outlook 2025 to 2035

3D Printing Metal Market

3D Printing Metal Market Size and Share Forecast Outlook 2025 to 2035

3D Bioprinted Organ Transplants Market

3D Bioprinted Organ Transplants Market Size and Share Forecast Outlook 2025 to 2035

3D Mapping and Modeling Market

3D Mapping and Modeling Market Size and Share Forecast Outlook 2025 to 2035

3D Audio Market
3D Audio Market

3D Audio Market Size and Share Forecast Outlook 2025 to 2035

3D Printing in Aerospace and Defense Market

3D Printing in Aerospace and Defense Market Analysis - Size, Share, and Forecast Outlook 2025 to 2035

3D Printed Maxillofacial Implants Market

3D Printed Maxillofacial Implants Market Size and Share Forecast Outlook 2025 to 2035

3D Surgical Microscope Systems Market

3D Surgical Microscope Systems Market Size and Share Forecast Outlook 2025 to 2035

3D-Printed Personalized Masks Market

3D-Printed Personalized Masks Market Size and Share Forecast Outlook 2025 to 2035

3D Printing Market
3D Printing Market

3D Printing Market Size and Share Forecast Outlook 2025 to 2035

3D Printed Packaging Market

3D Printed Packaging Market Size and Share Forecast Outlook 2025 to 2035

3D Printed Clear Dental Aligners Market

3D Printed Clear Dental Aligners Market Size and Share Forecast Outlook 2025 to 2035

3D IC and 2.5D IC Packaging Market

3D IC and 2.5D IC Packaging Market Size and Share Forecast Outlook 2025 to 2035

3d-Printed Skincare Market

3d-Printed Skincare Market Analysis - Size and Share Forecast Outlook 2025 to 2035

Future Market Insights

3D NAND Flash Memory Market

Chat With MaRIA

Chat With

MaRIA

Hi There, I am MaRIA, Your Market Research Intelligence Assistant. How may I help you?