3D Mapping and Modeling Market Outlook (2023 to 2033)

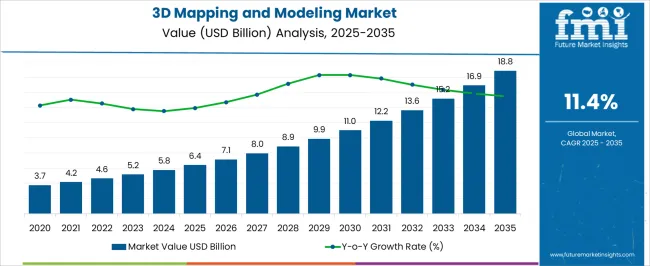
The 3D mapping and modeling market size is projected to be valued at US$ 5,126.7 million in 2023 and is expected to rise to US$ 13,001.4 million by 2033. The sales of 3D mapping and modeling are expected to record a significant CAGR of 11.9% during the forecast period.

Key Trends in 3D Mapping and Modeling

Increased Adoption of LiDAR Technology: LiDAR technology offers high-resolution mapping and is being increasingly used in various applications. Such as urban planning, autonomous driving, and environmental monitoring.

Integration of Artificial Intelligence (AI) and Machine Learning (ML): The integration of AI and ML algorithms in 3D mapping and modeling processes is enhancing efficiency and accuracy. AI and ML algorithms also help in creating realistic 3D models by analyzing large datasets and learning patterns from them.

Advancements in Augmented Reality (AR) and Virtual Reality (VR): AR and VR are finding applications in fields such as architecture, gaming, tourism, and training simulations, providing realistic and engaging experiences.

Expansion of 3D Mapping and Modeling in Drone Applications: Drones equipped with 3D mapping and modeling capabilities are being increasingly utilized in various industries. This is particularly valuable in sectors such as agriculture, construction, and surveying, where drones can efficiently gather data from inaccessible or hazardous locations.

Application of 3D Mapping and Modeling in Cultural Heritage Preservation: They enable the creation of detailed digital replicas of historical sites, artifacts, and monuments, preserving them in a virtual form. This helps in documentation, restoration, and conservation efforts, as well as providing immersive experiences for virtual exploration and education.

Attributes Details
3D Mapping and Modeling Market Estimated Size (2023) US$ 5,126.7 million
3D Mapping and Modeling Market CAGR (2023 to 2033) 11.9%
3D Mapping and Modeling Market Forecasted Size (2033) US$ 13,001.4 million

Don't pay for what you don't need

Customize your report by selecting specific countries or regions and save 30%!

2018 to 2022 3D Mapping and Modeling Market Outlook in Comparison to 2023 to 2033 Growth Forecast

As per the 3D mapping and modeling industry research by Future Market Insights, the market value of the 3D mapping and modeling industry increased at around 21.7% CAGR. Wherein, countries such as the United Kingdom, the United States, China, and Japan held a significant share in the global market.

The 3D mapping and modeling market reached a valuation of US$ 5,126.7 million in 2023. FMI estimates that 3D mapping and modeling revenue is likely to grow 3.6X from 2022 to 2032, reaching nearly US$ 13,001.4 million in 2033.

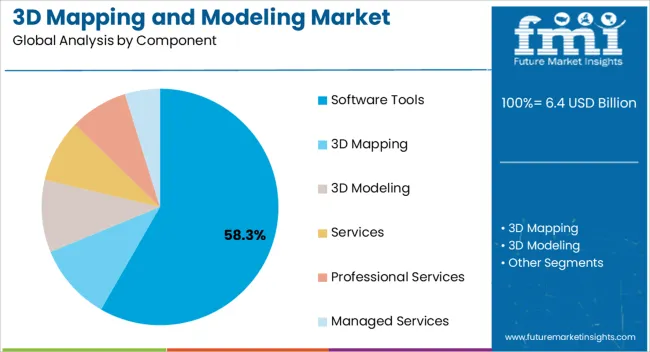
Software tools 3D mapping and modeling held a leading share of the market. The market in Japan is expected to grow significantly for 3D mapping and modeling, with a CAGR of 12.0%.

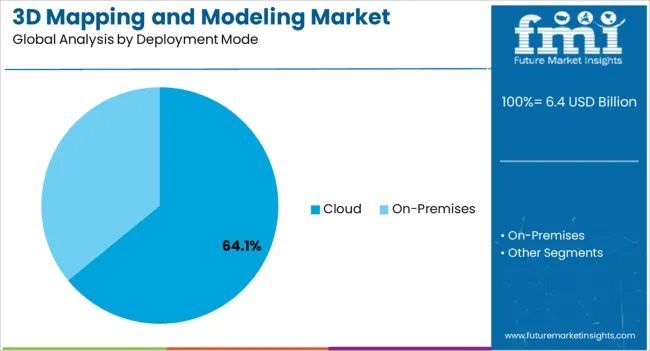
The cloud shows the highest potential for growth in the 3D mapping and modeling industry in the deployment mode segment. It is expected to grow at a rate of about 13% during the next ten years.

What Factors are Leading to the Growth of the 3D Mapping and Modeling Industry?

The growing demand for 3D mapping and modeling in the construction industry is one of the key factors driving the market growth. Different areas like medical, civil, and automotive, among others, further contribute to the increasing sales of 3D mapping and modeling solutions.

3D mapping and modeling utilized in plotting streets and buildings, spans, and its expanding attachment with augmented reality applications have kept the demand aloft. Furthermore, entertainment and gaming end-uses have additionally affected the sales of the 3D mapping and modeling market. Increasing demand for 3D Animation used in smart technologies may also contribute towards the growth of 3D mapping and modeling revenue during the forecast period.

Applications of 3D mapping are further expected to increase in the coming years due to the need for custom-designed maps and open-source navigation. Rising interest in driverless vehicles, metros, as well as other vehicle frameworks has prompted the expanded reception of 3D mapping, which has led the 3D mapping and modeling industry to grow.

Different variables for the market development incorporate the rising interest from the application area owing to the rising utilization of 3D activity, games, and films, and the presentation of 3D empowered show gadgets.

The 3D mapping and modeling industry is expected to be driven by the progressions and simple admittance to 3D gears, including sensors, scanners as well as different GPS parts. Moreover, 3D geospatial information in existing cell phones and cell phones is expected to contribute towards market growth.

Sudip Saha
Sudip Saha

Principal Consultant

Talk to Analyst

Find your sweet spots for generating winning opportunities in this market.

How High Installation Costs and Lack of Skilled Workforce are affecting the 3D Mapping and Modeling Market?

The key factors that affect the market include high installation costs and a lack of skilled workforce. Customers are required to pay an additional cost for lasers and scanners. Users need to spend the extra sum on projectors, media servers, and hard drives for enhanced video content. These factors are expected to limit the development of 3D mapping and modeling innovation.

Modeling Market

3D Mapping and Modeling Market:

Attributes 3D Mapping and Modeling Market
How can Manufacturers/Service Providers Scale their Businesses in the Market?
  • Expansion of product profiles
  • Branding and marketing to scale the technique
  • Expand on untapped economies
  • Focus on sustainability
CAGR (2023 to 2033) 11.9%
Market Value (2023) US 13,001.4 million
Growth Factor The growing demand for 3D mapping and modeling in the construction industry is one of the key factors driving the market growth
Opportunity Growing emphasis on sustainable solutions.
Key Trends The 3D mapping and modeling industry is expected to be driven by the progressions and simple admittance to 3D gears, including sensors, scanners as well as different GPS parts.

3D Packaging Market:

Attributes 3D Packaging Market
How can Manufacturers/Service Providers Scale their Businesses in the Market?
  • Aftersales services
  • Mergers and collaborations for advancing the market
  • Geographical expansions
CAGR (2023 to 2033) 4.1%
Market Value (2023) US$ 2.94 billion
Growth Factor Surging electronics production
Opportunity High need for cost-effective packaging solutions
Key Trends Government initiatives promoting manufacturing hubs in several regions

3D Bio Printing Market:

Attributes 3D Bio Printing Market
How can Manufacturers/Service Providers Scale their Businesses in the Market?
  • Reusability
  • Cost-effectiveness
  • Focus on sustainability
CAGR (2023 to 2033) 4.46%
Market Value (2023) US$ 49.63 billion
Growth Factor To compete in the market, manufacturers are also collaborating with recognized logistics and transportation companies to deliver goods on time.
Opportunity The manufacture of pet jars or pet bottles is one of the most lucrative and effective manufacturing opportunities in the plastic and polymer business.
Key Trends The market outlook for PET bottles has improved as a result of technological developments.

Get the data you need at a Fraction of the cost

Personalize your report by choosing insights you need
and save 40%!

Category-wise Insights of 3D Mapping and Modeling

What makes the Software Tools 3D Mapping and Modeling a Leading Revenue Generator in the 3D Mapping and Modeling Market?

Software tools in 3D mapping and modeling held the market's prominent share of 67.5% in 2022. It is expected to grow at a CAGR of 13.3% in the next ten years. Software devices are utilized in different areas like IT, Medical Engineering area and so forth which are contributing critical growth rate of software tools.

3D mapping and modeling software are used by architects to create three-dimensional models of buildings. 3D mapping and modeling software are like a map of a city. It can show the layout of the city, its streets, and buildings, and help you find the way around.

Which Deployment Mode Shows a Significant Potential over the Next Ten Years for the 3D Mapping and Modeling Market?

Cloud deployment shows significant potential for growth in the 3D mapping and modeling industry among deployment modes. The market through cloud deployment is expected to grow at a rate of about 13% during the next ten years.

Cloud deployment of 3D mapping and modeling can provide a business with the ability to visualize its data in a new and innovative way. It also allows for easier collaboration between team members.

Regional Analysis of the 3D Mapping and Modeling Market

Which Country Topped the Revenue Generation for the 3D Mapping and Modeling Market?

The United States influenced the market in 2022 with a market value of over US$ 1.6 billion. Media and entertainment industry in the country is massive in the world. The increase in the production of colossal 3D movies and 3D gaming in the country is expected to continuously increase the growth rate of the 3D mapping and modeling market in the country.

3D mapping and modeling are becoming increasingly popular in the United States. For example, a recent study found that the use of 3D mapping and modeling increased by nearly 50% between 2014 and 2020. Besides, 3D mapping and modeling are used by many businesses in the United States for various purposes such as creating prototypes and displaying products.

Europe is a Significant Player in the 3D Mapping and Modeling Market, with a Strong Share of 21.7% in 2022

The United Kingdom, Germany, and France are among the leading countries in Europe, all of which are contributing to the market's expansion.

European governments are actively supporting the implementation of 3D mapping and modeling technologies. Initiatives such as the European Spatial Data Infrastructure (ESDI) aim to improve spatial data accessibility and interoperability, facilitating the use of 3D mapping data for various applications. European countries foster collaboration among industry stakeholders, including government bodies, technology providers, and end-users. These collaborations facilitate knowledge sharing, standardization efforts, and the development of best practices in 3D mapping and modeling.

The Market in Asia Pacific is Expected to Witness Transforming Growth

The market during the forecast period spurt in interest in 3D mapping and modeling in emerging countries, particularly Japan and China.

China is likely to record an upward growth trajectory of 10.5% during the analysis period. 3D mapping and modeling are used extensively in China for a variety of purposes including engineering, architecture, and city planning.

For example, the city of Shanghai uses 3D mapping to help plan new developments. Furthermore, The Beijing Institute of Technology is a world-renowned leader in 3D mapping and modeling technology. Their research and development in this field have led to breakthroughs in applications such as medical imaging.
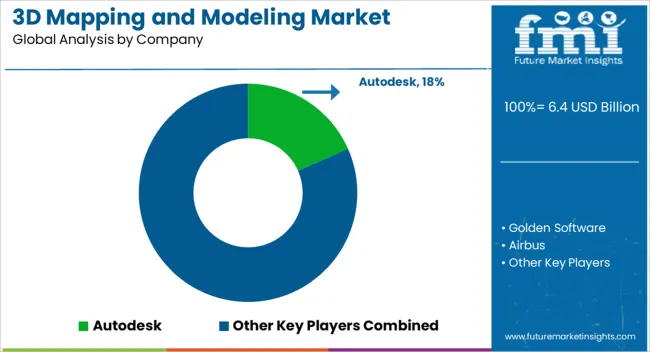
Competitive Landscape

The 3D mapping and modeling market is highly competitive, with several key players vying for market share. These companies are actively involved in research and development activities, strategic partnerships, and product innovations to gain a competitive edge.

  • Autodesk Inc.: Autodesk offers a wide range of 3D mapping and modeling software solutions. Catering to various industries such as architecture, engineering, and construction.
  • Trimble Inc.: Trimble specializes in providing advanced 3D mapping and modeling solutions for sectors like geospatial, construction, and transportation.
  • Bentley Systems, Incorporated: The company's 3D mapping and modeling offerings empower users to create and manage digital twins of physical assets, facilitating efficient decision-making.
  • Esri: The company provides 3D mapping and modeling capabilities that enable users to visualize and analyze geospatial data in a three-dimensional context.
  • Pix4D: Pix4D specializes in photogrammetry and drone mapping software, allowing users to generate accurate 3D models from aerial imagery.
  • Topcon Positioning Systems, Inc.: Topcon offers a wide array of positioning and surveying solutions, including 3D mapping and modeling technologies.
  • Intermap Technologies Corporation: Intermap focuses on providing high-resolution 3D digital elevation models (DEMs) and geospatial solutions.

Scope of the Report

Attributes Details
Growth Rate CAGR of 11.9% from 2023 to 2033
Base Year of Estimation 2023
Historical Data 2018 to 2022
Forecast Period 2023 to 2033
Quantitative Units Revenue in US$ billion and Volume in Units and F-CAGR from 2023 to 2033
Report Coverage Revenue Forecast, Volume Forecast, Company Ranking, Competitive Landscape, growth factors, Trends, and Pricing Analysis
Key Segments Covered Component, Deployment Mode, Organization Size, Vertical, By Region
Regions Covered North America; Latin America; Europe; East Asia; South Asia; The Middle East & Africa; Oceania
Key Countries Profiled The United States, Canada, Brazil, Mexico, Germany, Italy, France, The United Kingdom, Spain, Russia, China, Japan, India, GCC Countries, Australia
Key Companies Profiled Autodesk; Golden Software; Airbus; Trimble; Topcon; Saab ab; Bentley Systems; Dassault Group; Apple
Customization & Pricing Available upon Request

Key Segments Covered in the 3D Mapping and Modeling Market Report

By Component:

  • Software Tools
  • 3D Mapping
  • 3D Modeling
  • Services
  • Professional Services
  • Managed Services

By Deployment Mode:

  • Cloud
  • On-premises

By Organization Size:

  • SMEs
  • Large Enterprise

By Vertical:

  • Retail and Consumer Goods
  • Engineering and Construction
  • Healthcare and Life Sciences
  • Transportation and Logistics
  • Government and Defence
  • Energy and Utilities
  • Media and Entertainment
  • Manufacturing
  • Others (education, agricultural, automotive, and IT and telecom)

By Region:

  • North America
  • Latin America
  • Western Europe
  • Eastern Europe
  • Asia Pacific Excluding Japan (APEJ)
  • Japan
  • The Middle East & Africa (MEA)

Frequently Asked Questions

How Big is the 3D Mapping and Modeling Market?

The market is valued at US$ 5,126.7 million in 2023.

Who are the Key 3D Mapping and Modeling Market Players?

Google, Autodesk, and Trimble are key market players.

Which are the Key Asian Countries in the 3D Mapping and Modeling Market?

India, Japan, and China dominate the Asian market.

How Big Will the 3D Mapping and Modeling Market by 2033?

The market is estimated to reach US$ 13,001.4 million by 2033.

Which Region holds high Lucrativeness?

Asia Pacific is projected to emerge as a lucrative market.

Table of Content
1. Executive Summary

    1.1. Global Market Outlook

    1.2. Demand-side Trends

    1.3. Supply-side Trends

    1.4. Technology Roadmap Analysis

    1.5. Analysis and Recommendations

2. Market Overview

    2.1. Market Coverage / Taxonomy

    2.2. Market Definition / Scope / Limitations

3. Market Background

    3.1. Market Dynamics

        3.1.1. Drivers

        3.1.2. Restraints

        3.1.3. Opportunity

        3.1.4. Trends

    3.2. Scenario Forecast

        3.2.1. Demand in Optimistic Scenario

        3.2.2. Demand in Likely Scenario

        3.2.3. Demand in Conservative Scenario

    3.3. Opportunity Map Analysis

    3.4. Investment Feasibility Matrix

    3.5. PESTLE and Porter’s Analysis

    3.6. Regulatory Landscape

        3.6.1. By Key Regions

        3.6.2. By Key Countries

    3.7. Regional Parent Market Outlook

4. Global Market Analysis 2018 to 2022 and Forecast, 2023 to 2033

    4.1. Historical Market Size Value (US$ Million) Analysis, 2018 to 2022

    4.2. Current and Future Market Size Value (US$ Million) Projections, 2023 to 2033

        4.2.1. Y-o-Y Growth Trend Analysis

        4.2.2. Absolute $ Opportunity Analysis

5. Global Market Analysis 2018 to 2022 and Forecast 2023 to 2033, By Component

    5.1. Introduction / Key Findings

    5.2. Historical Market Size Value (US$ Million) Analysis By Component, 2018 to 2022

    5.3. Current and Future Market Size Value (US$ Million) Analysis and Forecast By Component, 2023 to 2033

        5.3.1. Software Tools

            5.3.1.1. 3D Mapping

            5.3.1.2. 3D Modeling

        5.3.2. Services

            5.3.2.1. Professional Services

            5.3.2.2. Managed Services

    5.4. Y-o-Y Growth Trend Analysis By Component, 2018 to 2022

    5.5. Absolute $ Opportunity Analysis By Component, 2023 to 2033

6. Global Market Analysis 2018 to 2022 and Forecast 2023 to 2033, By Deployment Mode

    6.1. Introduction / Key Findings

    6.2. Historical Market Size Value (US$ Million) Analysis By Deployment Mode, 2018 to 2022

    6.3. Current and Future Market Size Value (US$ Million) Analysis and Forecast By Deployment Mode, 2023 to 2033

        6.3.1. Cloud

        6.3.2. On-premises

    6.4. Y-o-Y Growth Trend Analysis By Deployment Mode, 2018 to 2022

    6.5. Absolute $ Opportunity Analysis By Deployment Mode, 2023 to 2033

7. Global Market Analysis 2018 to 2022 and Forecast 2023 to 2033, By Organization Size

    7.1. Introduction / Key Findings

    7.2. Historical Market Size Value (US$ Million) Analysis By Organization Size, 2018 to 2022

    7.3. Current and Future Market Size Value (US$ Million) Analysis and Forecast By Organization Size, 2023 to 2033

        7.3.1. SMEs

        7.3.2. Large Enterprise

    7.4. Y-o-Y Growth Trend Analysis By Organization Size, 2018 to 2022

    7.5. Absolute $ Opportunity Analysis By Organization Size, 2023 to 2033

8. Global Market Analysis 2018 to 2022 and Forecast 2023 to 2033, By Vertical

    8.1. Introduction / Key Findings

    8.2. Historical Market Size Value (US$ Million) Analysis By Vertical, 2018 to 2022

    8.3. Current and Future Market Size Value (US$ Million) Analysis and Forecast By Vertical, 2023 to 2033

        8.3.1. Retail and Consumer Goods

        8.3.2. Engineering and Construction

        8.3.3. Healthcare and Life Sciences

        8.3.4. Transportation and Logistics

        8.3.5. Government and Defence

        8.3.6. Energy and Utilities

        8.3.7. Media and Entertainment

        8.3.8. Manufacturing

        8.3.9. Others

    8.4. Y-o-Y Growth Trend Analysis By Vertical, 2018 to 2022

    8.5. Absolute $ Opportunity Analysis By Vertical, 2023 to 2033

9. Global Market Analysis 2018 to 2022 and Forecast 2023 to 2033, By Region

    9.1. Introduction

    9.2. Historical Market Size Value (US$ Million) Analysis By Region, 2018 to 2022

    9.3. Current Market Size Value (US$ Million) Analysis and Forecast By Region, 2023 to 2033

        9.3.1. North America

        9.3.2. Latin America

        9.3.3. Europe

        9.3.4. South Asia

        9.3.5. East Asia

        9.3.6. Oceania

        9.3.7. MEA

    9.4. Market Attractiveness Analysis By Region

10. North America Market Analysis 2018 to 2022 and Forecast 2023 to 2033, By Country

    10.1. Historical Market Size Value (US$ Million) Trend Analysis By Market Taxonomy, 2018 to 2022

    10.2. Market Size Value (US$ Million) Forecast By Market Taxonomy, 2023 to 2033

        10.2.1. By Country

            10.2.1.1. USA

            10.2.1.2. Canada

        10.2.2. By Component

        10.2.3. By Deployment Mode

        10.2.4. By Organization Size

        10.2.5. By Vertical

    10.3. Market Attractiveness Analysis

        10.3.1. By Country

        10.3.2. By Component

        10.3.3. By Deployment Mode

        10.3.4. By Organization Size

        10.3.5. By Vertical

    10.4. Key Takeaways

11. Latin America Market Analysis 2018 to 2022 and Forecast 2023 to 2033, By Country

    11.1. Historical Market Size Value (US$ Million) Trend Analysis By Market Taxonomy, 2018 to 2022

    11.2. Market Size Value (US$ Million) Forecast By Market Taxonomy, 2023 to 2033

        11.2.1. By Country

            11.2.1.1. Brazil

            11.2.1.2. Mexico

            11.2.1.3. Rest of Latin America

        11.2.2. By Component

        11.2.3. By Deployment Mode

        11.2.4. By Organization Size

        11.2.5. By Vertical

    11.3. Market Attractiveness Analysis

        11.3.1. By Country

        11.3.2. By Component

        11.3.3. By Deployment Mode

        11.3.4. By Organization Size

        11.3.5. By Vertical

    11.4. Key Takeaways

12. Europe Market Analysis 2018 to 2022 and Forecast 2023 to 2033, By Country

    12.1. Historical Market Size Value (US$ Million) Trend Analysis By Market Taxonomy, 2018 to 2022

    12.2. Market Size Value (US$ Million) Forecast By Market Taxonomy, 2023 to 2033

        12.2.1. By Country

            12.2.1.1. Germany

            12.2.1.2. UK

            12.2.1.3. France

            12.2.1.4. Spain

            12.2.1.5. Italy

            12.2.1.6. Rest of Europe

        12.2.2. By Component

        12.2.3. By Deployment Mode

        12.2.4. By Organization Size

        12.2.5. By Vertical

    12.3. Market Attractiveness Analysis

        12.3.1. By Country

        12.3.2. By Component

        12.3.3. By Deployment Mode

        12.3.4. By Organization Size

        12.3.5. By Vertical

    12.4. Key Takeaways

13. South Asia Market Analysis 2018 to 2022 and Forecast 2023 to 2033, By Country

    13.1. Historical Market Size Value (US$ Million) Trend Analysis By Market Taxonomy, 2018 to 2022

    13.2. Market Size Value (US$ Million) Forecast By Market Taxonomy, 2023 to 2033

        13.2.1. By Country

            13.2.1.1. India

            13.2.1.2. Malaysia

            13.2.1.3. Singapore

            13.2.1.4. Thailand

            13.2.1.5. Rest of South Asia

        13.2.2. By Component

        13.2.3. By Deployment Mode

        13.2.4. By Organization Size

        13.2.5. By Vertical

    13.3. Market Attractiveness Analysis

        13.3.1. By Country

        13.3.2. By Component

        13.3.3. By Deployment Mode

        13.3.4. By Organization Size

        13.3.5. By Vertical

    13.4. Key Takeaways

14. East Asia Market Analysis 2018 to 2022 and Forecast 2023 to 2033, By Country

    14.1. Historical Market Size Value (US$ Million) Trend Analysis By Market Taxonomy, 2018 to 2022

    14.2. Market Size Value (US$ Million) Forecast By Market Taxonomy, 2023 to 2033

        14.2.1. By Country

            14.2.1.1. China

            14.2.1.2. Japan

            14.2.1.3. South Korea

        14.2.2. By Component

        14.2.3. By Deployment Mode

        14.2.4. By Organization Size

        14.2.5. By Vertical

    14.3. Market Attractiveness Analysis

        14.3.1. By Country

        14.3.2. By Component

        14.3.3. By Deployment Mode

        14.3.4. By Organization Size

        14.3.5. By Vertical

    14.4. Key Takeaways

15. Oceania Market Analysis 2018 to 2022 and Forecast 2023 to 2033, By Country

    15.1. Historical Market Size Value (US$ Million) Trend Analysis By Market Taxonomy, 2018 to 2022

    15.2. Market Size Value (US$ Million) Forecast By Market Taxonomy, 2023 to 2033

        15.2.1. By Country

            15.2.1.1. Australia

            15.2.1.2. New Zealand

        15.2.2. By Component

        15.2.3. By Deployment Mode

        15.2.4. By Organization Size

        15.2.5. By Vertical

    15.3. Market Attractiveness Analysis

        15.3.1. By Country

        15.3.2. By Component

        15.3.3. By Deployment Mode

        15.3.4. By Organization Size

        15.3.5. By Vertical

    15.4. Key Takeaways

16. MEA Market Analysis 2018 to 2022 and Forecast 2023 to 2033, By Country

    16.1. Historical Market Size Value (US$ Million) Trend Analysis By Market Taxonomy, 2018 to 2022

    16.2. Market Size Value (US$ Million) Forecast By Market Taxonomy, 2023 to 2033

        16.2.1. By Country

            16.2.1.1. GCC Countries

            16.2.1.2. South Africa

            16.2.1.3. Israel

            16.2.1.4. Rest of MEA

        16.2.2. By Component

        16.2.3. By Deployment Mode

        16.2.4. By Organization Size

        16.2.5. By Vertical

    16.3. Market Attractiveness Analysis

        16.3.1. By Country

        16.3.2. By Component

        16.3.3. By Deployment Mode

        16.3.4. By Organization Size

        16.3.5. By Vertical

    16.4. Key Takeaways

17. Key Countries Market Analysis

    17.1. USA

        17.1.1. Pricing Analysis

        17.1.2. Market Share Analysis, 2022

            17.1.2.1. By Component

            17.1.2.2. By Deployment Mode

            17.1.2.3. By Organization Size

            17.1.2.4. By Vertical

    17.2. Canada

        17.2.1. Pricing Analysis

        17.2.2. Market Share Analysis, 2022

            17.2.2.1. By Component

            17.2.2.2. By Deployment Mode

            17.2.2.3. By Organization Size

            17.2.2.4. By Vertical

    17.3. Brazil

        17.3.1. Pricing Analysis

        17.3.2. Market Share Analysis, 2022

            17.3.2.1. By Component

            17.3.2.2. By Deployment Mode

            17.3.2.3. By Organization Size

            17.3.2.4. By Vertical

    17.4. Mexico

        17.4.1. Pricing Analysis

        17.4.2. Market Share Analysis, 2022

            17.4.2.1. By Component

            17.4.2.2. By Deployment Mode

            17.4.2.3. By Organization Size

            17.4.2.4. By Vertical

    17.5. Germany

        17.5.1. Pricing Analysis

        17.5.2. Market Share Analysis, 2022

            17.5.2.1. By Component

            17.5.2.2. By Deployment Mode

            17.5.2.3. By Organization Size

            17.5.2.4. By Vertical

    17.6. UK

        17.6.1. Pricing Analysis

        17.6.2. Market Share Analysis, 2022

            17.6.2.1. By Component

            17.6.2.2. By Deployment Mode

            17.6.2.3. By Organization Size

            17.6.2.4. By Vertical

    17.7. France

        17.7.1. Pricing Analysis

        17.7.2. Market Share Analysis, 2022

            17.7.2.1. By Component

            17.7.2.2. By Deployment Mode

            17.7.2.3. By Organization Size

            17.7.2.4. By Vertical

    17.8. Spain

        17.8.1. Pricing Analysis

        17.8.2. Market Share Analysis, 2022

            17.8.2.1. By Component

            17.8.2.2. By Deployment Mode

            17.8.2.3. By Organization Size

            17.8.2.4. By Vertical

    17.9. Italy

        17.9.1. Pricing Analysis

        17.9.2. Market Share Analysis, 2022

            17.9.2.1. By Component

            17.9.2.2. By Deployment Mode

            17.9.2.3. By Organization Size

            17.9.2.4. By Vertical

    17.10. India

        17.10.1. Pricing Analysis

        17.10.2. Market Share Analysis, 2022

            17.10.2.1. By Component

            17.10.2.2. By Deployment Mode

            17.10.2.3. By Organization Size

            17.10.2.4. By Vertical

    17.11. Malaysia

        17.11.1. Pricing Analysis

        17.11.2. Market Share Analysis, 2022

            17.11.2.1. By Component

            17.11.2.2. By Deployment Mode

            17.11.2.3. By Organization Size

            17.11.2.4. By Vertical

    17.12. Singapore

        17.12.1. Pricing Analysis

        17.12.2. Market Share Analysis, 2022

            17.12.2.1. By Component

            17.12.2.2. By Deployment Mode

            17.12.2.3. By Organization Size

            17.12.2.4. By Vertical

    17.13. Thailand

        17.13.1. Pricing Analysis

        17.13.2. Market Share Analysis, 2022

            17.13.2.1. By Component

            17.13.2.2. By Deployment Mode

            17.13.2.3. By Organization Size

            17.13.2.4. By Vertical

    17.14. China

        17.14.1. Pricing Analysis

        17.14.2. Market Share Analysis, 2022

            17.14.2.1. By Component

            17.14.2.2. By Deployment Mode

            17.14.2.3. By Organization Size

            17.14.2.4. By Vertical

    17.15. Japan

        17.15.1. Pricing Analysis

        17.15.2. Market Share Analysis, 2022

            17.15.2.1. By Component

            17.15.2.2. By Deployment Mode

            17.15.2.3. By Organization Size

            17.15.2.4. By Vertical

    17.16. South Korea

        17.16.1. Pricing Analysis

        17.16.2. Market Share Analysis, 2022

            17.16.2.1. By Component

            17.16.2.2. By Deployment Mode

            17.16.2.3. By Organization Size

            17.16.2.4. By Vertical

    17.17. Australia

        17.17.1. Pricing Analysis

        17.17.2. Market Share Analysis, 2022

            17.17.2.1. By Component

            17.17.2.2. By Deployment Mode

            17.17.2.3. By Organization Size

            17.17.2.4. By Vertical

    17.18. New Zealand

        17.18.1. Pricing Analysis

        17.18.2. Market Share Analysis, 2022

            17.18.2.1. By Component

            17.18.2.2. By Deployment Mode

            17.18.2.3. By Organization Size

            17.18.2.4. By Vertical

    17.19. GCC Countries

        17.19.1. Pricing Analysis

        17.19.2. Market Share Analysis, 2022

            17.19.2.1. By Component

            17.19.2.2. By Deployment Mode

            17.19.2.3. By Organization Size

            17.19.2.4. By Vertical

    17.20. South Africa

        17.20.1. Pricing Analysis

        17.20.2. Market Share Analysis, 2022

            17.20.2.1. By Component

            17.20.2.2. By Deployment Mode

            17.20.2.3. By Organization Size

            17.20.2.4. By Vertical

    17.21. Israel

        17.21.1. Pricing Analysis

        17.21.2. Market Share Analysis, 2022

            17.21.2.1. By Component

            17.21.2.2. By Deployment Mode

            17.21.2.3. By Organization Size

            17.21.2.4. By Vertical

18. Market Structure Analysis

    18.1. Competition Dashboard

    18.2. Competition Benchmarking

    18.3. Market Share Analysis of Top Players

        18.3.1. By Regional

        18.3.2. By Component

        18.3.3. By Deployment Mode

        18.3.4. By Organization Size

        18.3.5. By Vertical

19. Competition Analysis

    19.1. Competition Deep Dive

        19.1.1. Autodesk

            19.1.1.1. Overview

            19.1.1.2. Product Portfolio

            19.1.1.3. Profitability by Market Segments

            19.1.1.4. Sales Footprint

            19.1.1.5. Strategy Overview

                19.1.1.5.1. Marketing Strategy

        19.1.2. Golden Software

            19.1.2.1. Overview

            19.1.2.2. Product Portfolio

            19.1.2.3. Profitability by Market Segments

            19.1.2.4. Sales Footprint

            19.1.2.5. Strategy Overview

                19.1.2.5.1. Marketing Strategy

        19.1.3. Airbus

            19.1.3.1. Overview

            19.1.3.2. Product Portfolio

            19.1.3.3. Profitability by Market Segments

            19.1.3.4. Sales Footprint

            19.1.3.5. Strategy Overview

                19.1.3.5.1. Marketing Strategy

        19.1.4. Trimble

            19.1.4.1. Overview

            19.1.4.2. Product Portfolio

            19.1.4.3. Profitability by Market Segments

            19.1.4.4. Sales Footprint

            19.1.4.5. Strategy Overview

                19.1.4.5.1. Marketing Strategy

        19.1.5. Topcon

            19.1.5.1. Overview

            19.1.5.2. Product Portfolio

            19.1.5.3. Profitability by Market Segments

            19.1.5.4. Sales Footprint

            19.1.5.5. Strategy Overview

                19.1.5.5.1. Marketing Strategy

        19.1.6. Saab ab

            19.1.6.1. Overview

            19.1.6.2. Product Portfolio

            19.1.6.3. Profitability by Market Segments

            19.1.6.4. Sales Footprint

            19.1.6.5. Strategy Overview

                19.1.6.5.1. Marketing Strategy

        19.1.7. Bentley Systems

            19.1.7.1. Overview

            19.1.7.2. Product Portfolio

            19.1.7.3. Profitability by Market Segments

            19.1.7.4. Sales Footprint

            19.1.7.5. Strategy Overview

                19.1.7.5.1. Marketing Strategy

        19.1.8. Dassault Group

            19.1.8.1. Overview

            19.1.8.2. Product Portfolio

            19.1.8.3. Profitability by Market Segments

            19.1.8.4. Sales Footprint

            19.1.8.5. Strategy Overview

                19.1.8.5.1. Marketing Strategy

        19.1.9. Apple

            19.1.9.1. Overview

            19.1.9.2. Product Portfolio

            19.1.9.3. Profitability by Market Segments

            19.1.9.4. Sales Footprint

            19.1.9.5. Strategy Overview

                19.1.9.5.1. Marketing Strategy

        19.1.10. Intermap

            19.1.10.1. Overview

            19.1.10.2. Product Portfolio

            19.1.10.3. Profitability by Market Segments

            19.1.10.4. Sales Footprint

            19.1.10.5. Strategy Overview

                19.1.10.5.1. Marketing Strategy

20. Assumptions & Acronyms Used

21. Research Methodology
Recommendations

Technology

3D Display Market

September 2024

REP-GB-749

Upcoming

Technology

3D Printing Market

May 2021

REP-GB-553

June 2023

333 pages

Technology

Advanced (3D/4D) Visualization Systems Market

March 2019

REP-GB-9235

May 2023

319 pages

Technology

Industrial 3D Printing Market

September 2024

REP-GB-13105

Upcoming

Explore Technology Insights

View Reports
Future Market Insights

3D Mapping and Modeling Market