The 3D Printing Ceramics Market is estimated to be valued at USD 81.2 million in 2025 and is projected to reach USD 1395.8 million by 2035, registering a compound annual growth rate (CAGR) of 20.6% over the forecast period.
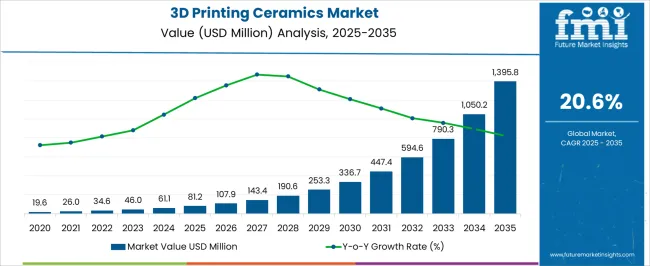
| Metric | Value |
|---|---|
| 3D Printing Ceramics Market Estimated Value in (2025 E) | USD 81.2 million |
| 3D Printing Ceramics Market Forecast Value in (2035 F) | USD 1395.8 million |
| Forecast CAGR (2025 to 2035) | 20.6% |
The 3D printing ceramics market is gaining traction as industries adopt additive manufacturing technologies for high-performance, complex components. Ceramics are increasingly valued for their thermal stability, biocompatibility, and mechanical strength, which enable applications in aerospace, electronics, and healthcare.
The current market is shaped by advancements in printing technologies, including binder jetting, stereolithography, and selective laser sintering, which have expanded material versatility and production efficiency. Cost reductions in powder processing and improved design capabilities are further accelerating adoption.
Growing investments in research and the shift toward customized, on-demand production of advanced ceramic parts are reinforcing the market’s upward trajectory. The long-term outlook remains favorable, driven by innovation in industrial-grade applications and the scalability of ceramic 3D printing technologies.
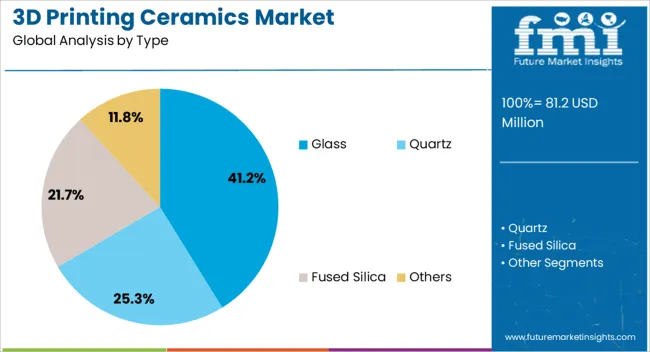
The glass segment dominates the type category, accounting for approximately 41.2% share of the 3D printing ceramics market. This leadership is supported by glass ceramics’ ability to deliver aesthetic appeal, high chemical resistance, and excellent durability in multiple applications.
Adoption has been reinforced by its suitability for both functional and decorative components, particularly in dental, optical, and consumer goods industries. The segment benefits from the growing availability of printable glass powders and resins, which enable precision manufacturing of complex geometries.
Technological improvements in sintering processes and compatibility with multi-material printing systems have further enhanced adoption. With rising demand for custom medical and industrial products, the glass segment is positioned to maintain its strong market presence.
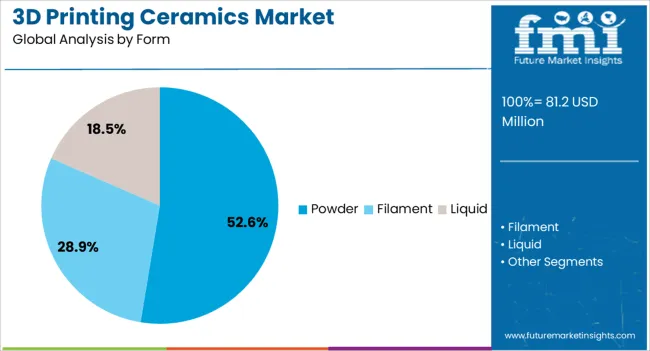
The powder segment leads the form category with approximately 52.6% share, reflecting its widespread use across multiple 3D printing technologies. Powder-based ceramics are preferred due to their ability to achieve fine detailing, consistent material density, and superior mechanical properties after sintering.
The segment has gained traction in industries requiring complex part geometries, such as aerospace and biomedical implants, where precision and performance are critical. Advances in powder processing and particle size control have improved printability and structural outcomes, reinforcing market demand.
With increasing R&D investments and broader adoption of powder-based printing platforms, this segment is expected to retain its dominant role.
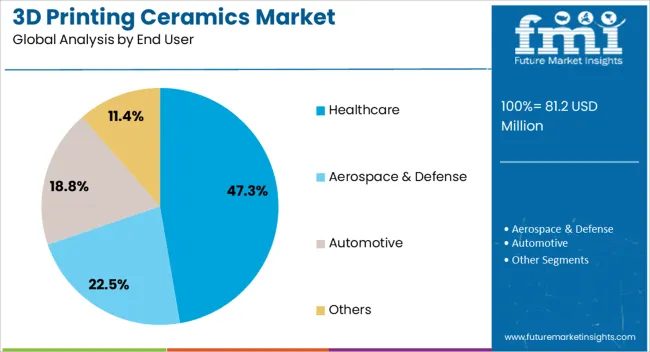
The healthcare segment represents approximately 47.3% share of the end-user category, making it the leading application area for 3D printed ceramics. Biocompatibility and the ability to create patient-specific implants, dental restorations, and surgical tools have driven strong adoption in this sector.
The segment benefits from growing demand for customized solutions in regenerative medicine and prosthetics, supported by advances in design software and printing accuracy. Healthcare providers are increasingly adopting ceramic 3D printing for its precision, reduced production timelines, and improved patient outcomes.
With ongoing innovations in bio-ceramic materials and increasing regulatory approvals, the healthcare segment is projected to maintain its leadership in the forecast period.
Medical Implants Demand for the 3D Printed Ceramics Implants
3D Printed Ceramics Sculpts the Popular Demand of 3D Technology
According to market analysis, the global market for 3D printing ceramics increased by 34.2% between 2020 and 2025, resulting in a worth of USD 81.2 million. The market is likely to experience a slowdown in growth pace in the future years, with a CAGR of 32.9% between 2025 and 2035.
| Attributes | Key Statistics |
|---|---|
| Expected Base Year Value (2025) | USD 81.2 million |
| Final Value (2025) | USD 61.1 million |
| Estimated Growth (2020 to 2025) | 34.2% CAGR |
3D Printed Glass Sector Skyrockets in Global 3D Printing Ceramics Market
| Top Type | Glass |
|---|---|
| CAGR (2025 to 2035) | 32.7% |
Demand for glass type ceramics in the 3D printing ceramics is rising with an anticipated CAGR of 32.7% through 2035. Several key drivers include:
Liquid-based 3D Printed Ceramics Acquires a Larger Stake in Global Industry
| Top Form | Liquid |
|---|---|
| CAGR (2025 to 2035) | 32.5% |
Demand for liquid components is rising, with an anticipated CAGR of 32.5% through 2035. Some of the key drivers include:
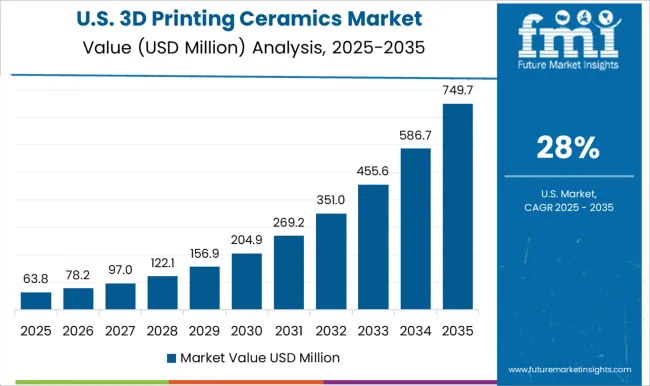
| Country | United States |
|---|---|
| CAGR (2025 to 2035) | 33.2% |
Demand for 3D printed ceramics is rising in the United States, with an anticipated CAGR of 33.2% through 2035. Some of the key drivers include:
| Country | China |
|---|---|
| CAGR (2025 to 2035) | 33.3% |
China is seeing an increase in demand for 3D printed ceramics, with a predicted CAGR of 33.3% through 2035. Among the main trends are:
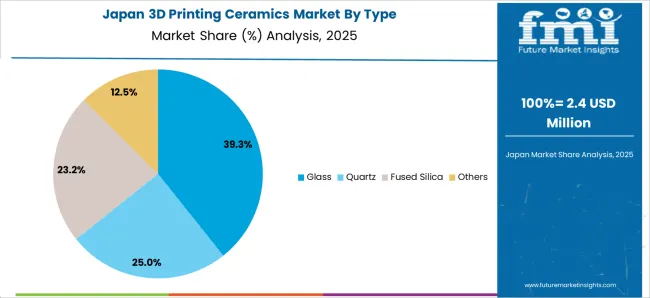
| Country | Japan |
|---|---|
| CAGR (2025 to 2035) | 34.4% |
The market for 3D printed ceramics is expanding in Japan with an estimated CAGR of 34.4% through 2035. Here are a few of the trends:
| Country | United Kingdom |
|---|---|
| CAGR (2025 to 2035) | 33.7% |
The United Kingdom 3D printed ceramics industry is expected to evolve at a CAGR of 33.7% through 2035.
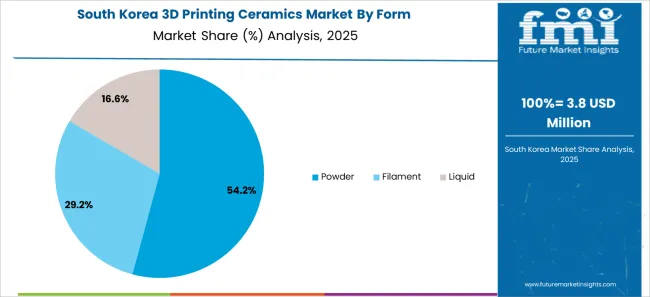
| Country | South Korea |
|---|---|
| CAGR (2025 to 2035) | 36.1% |
The market for 3D printed ceramics in South Korea is anticipated to increase at a CAGR of 36.1% through 2035. Several of the key trends are as follows:
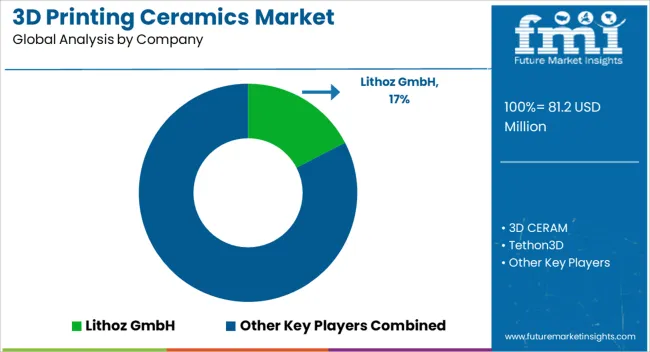
The global 3D printing ceramics industry is rapidly expanding and highly competitive, with many companies competing for market share and a solid foundation. Several factors, including pricing strategies, marketing campaigns, research and development, and the development of innovative products, primarily drive the competition. Because of the 3D printed ceramics market's significant fragmentation and competition among companies for extensive share, there is a greater emphasis on strategic decision-making and competitive pressures. Market players aggressively invest in research and development to create new, more potent 3D printing ceramics and drapes to remain ahead of the competition.
Market players actively seek partnerships, collaborations, and other strategic alliances to enhance their operational efficiency and broaden their market reach. Additionally, companies are leveraging product launches and other marketing initiatives to expand the market for 3D printed ceramics and gain a competitive edge.
Recent Developments in the 3D Printing Ceramics Market
The global 3D printing ceramics market is estimated to be valued at USD 81.2 million in 2025.
The market size for the 3D printing ceramics market is projected to reach USD 1,395.8 million by 2035.
The 3D printing ceramics market is expected to grow at a 20.6% CAGR between 2025 and 2035.
The key product types in 3D printing ceramics market are glass, quartz, fused silica and others.
In terms of form, powder segment to command 52.6% share in the 3D printing ceramics market in 2025.


Our Research Products

The "Full Research Suite" delivers actionable market intel, deep dives on markets or technologies, so clients act faster, cut risk, and unlock growth.

The Leaderboard benchmarks and ranks top vendors, classifying them as Established Leaders, Leading Challengers, or Disruptors & Challengers.

Locates where complements amplify value and substitutes erode it, forecasting net impact by horizon

We deliver granular, decision-grade intel: market sizing, 5-year forecasts, pricing, adoption, usage, revenue, and operational KPIs—plus competitor tracking, regulation, and value chains—across 60 countries broadly.

Spot the shifts before they hit your P&L. We track inflection points, adoption curves, pricing moves, and ecosystem plays to show where demand is heading, why it is changing, and what to do next across high-growth markets and disruptive tech

Real-time reads of user behavior. We track shifting priorities, perceptions of today’s and next-gen services, and provider experience, then pace how fast tech moves from trial to adoption, blending buyer, consumer, and channel inputs with social signals (#WhySwitch, #UX).

Partner with our analyst team to build a custom report designed around your business priorities. From analysing market trends to assessing competitors or crafting bespoke datasets, we tailor insights to your needs.
Supplier Intelligence
Discovery & Profiling
Capacity & Footprint
Performance & Risk
Compliance & Governance
Commercial Readiness
Who Supplies Whom
Scorecards & Shortlists
Playbooks & Docs
Category Intelligence
Definition & Scope
Demand & Use Cases
Cost Drivers
Market Structure
Supply Chain Map
Trade & Policy
Operating Norms
Deliverables
Buyer Intelligence
Account Basics
Spend & Scope
Procurement Model
Vendor Requirements
Terms & Policies
Entry Strategy
Pain Points & Triggers
Outputs
Pricing Analysis
Benchmarks
Trends
Should-Cost
Indexation
Landed Cost
Commercial Terms
Deliverables
Brand Analysis
Positioning & Value Prop
Share & Presence
Customer Evidence
Go-to-Market
Digital & Reputation
Compliance & Trust
KPIs & Gaps
Outputs
Full Research Suite comprises of:
Market outlook & trends analysis
Interviews & case studies
Strategic recommendations
Vendor profiles & capabilities analysis
5-year forecasts
8 regions and 60+ country-level data splits
Market segment data splits
12 months of continuous data updates
DELIVERED AS:
PDF EXCEL ONLINE
3D Printing Industry Analysis in Middle East Size and Share Forecast Outlook 2025 to 2035
3D Printing Metal Market Size and Share Forecast Outlook 2025 to 2035
3D Printing in Aerospace and Defense Market Analysis - Size, Share, and Forecast Outlook 2025 to 2035
3D Printing Market Size and Share Forecast Outlook 2025 to 2035
3D Printing in Automotive Market Size and Share Forecast Outlook 2025 to 2035
3D Printing In Construction Market Size and Share Forecast Outlook 2025 to 2035
3D Printing Dental Devices Market Growth - Trends & Forecast 2025 to 2035
3D Printing Photopolymers Market Trends, Analysis & Forecast by Material, Application and Region through 2035
3D Printing Materials Market Analysis by Material Type, Form, Application, and Region from 2025 to 2035
Market Positioning & Share in the 3D Printing Metal Industry
Evaluating 3D Printing Filament Market Share & Provider Insights
3D Bioprinting Market Analysis - Size, Share & Forecast 2025 to 2035
Dental 3D Printing Material Market Trends, Growth & Forecast by Material, Product, and Region through 2035
Ceramic 3D Printing Market Size and Share Forecast Outlook 2025 to 2035
Aerospace 3D Printing Materials Market Size and Share Forecast Outlook 2025 to 2035
Demand for 3D Printing Materials in Middle East Size and Share Forecast Outlook 2025 to 2035
Industrial 3D Printing Market Size and Share Forecast Outlook 2025 to 2035
Middle East 3D Printing Materials Market Trends 2022 to 2032
Fully Enclosed 3D Printing Smart Warehouse Market Size and Share Forecast Outlook 2025 to 2035
Hearing Devices 3D Printing Market Size and Share Forecast Outlook 2025 to 2035

Thank you!
You will receive an email from our Business Development Manager. Please be sure to check your SPAM/JUNK folder too.
Chat With
MaRIA