The global loudspeaker market is projected to grow from USD 6.1 billion in 2025 to USD 12.4 billion by 2035, reflecting a CAGR of 7.3% over the forecast period. This growth is primarily driven by rising consumer demand for high-fidelity audio devices, increasing integration of smart home systems, and technological advancements in wireless connectivity such as Bluetooth and Wi-Fi. The popularity of smart speakers equipped with voice assistants like Amazon Alexa, Google Assistant, and Apple Siri has significantly expanded market adoption.
Leading manufacturers including Bose Corporation, Sony Corporation, JBL (a Harman International brand), and Sonos Inc. continue to invest in research and development to introduce innovative products that combine enhanced sound quality, compact designs, and seamless connectivity. During its 2024 earnings call, Sonos CEO Patrick Spence highlighted, “Our multi-room wireless speaker systems have transformed how consumers experience sound, driving considerable growth in our installed base and revenue streams.”
Regionally, North America and Europe currently dominate the market due to high consumer spending on premium audio devices and early adoption of smart technologies. However, the Asia Pacific region is anticipated to witness the fastest market growth, fueled by rapid urbanization, rising disposable incomes, and expanding e-commerce platforms.
Emerging trends such as the integration of loudspeakers into Internet of Things (IoT) ecosystems, the adoption of active noise cancellation technology, and the growing demand for compact and portable speaker designs are creating new opportunities in the loudspeaker market. These technological innovations, combined with shifting consumer preferences, are expected to sustain market momentum throughout the forecast period.
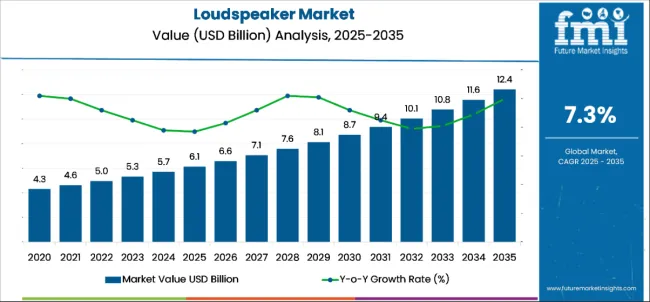
| Attributes | Key Insights |
|---|---|
| Historical Size, 2024 | USD 5729.32 million |
| Estimated Size, 2025 | USD 6.1 billion |
| Projected Size, 2035 | USD 12.4 billion |
| Value-based CAGR (2025 to 2035) | 7.3% |
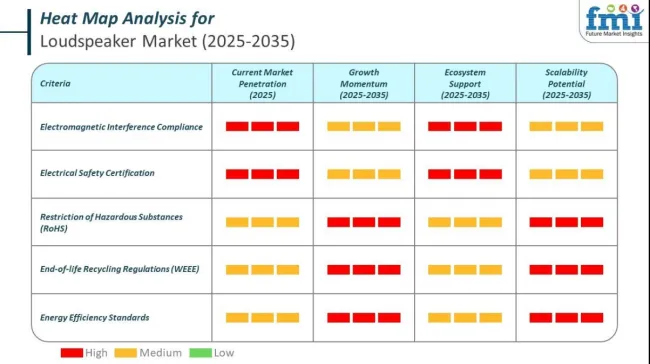
Government regulations in the loudspeaker market shape product design, manufacturing, and distribution globally. These laws are primarily focused on electrical safety, electromagnetic compatibility, environmental sustainability, and sound emission standards.
Loudspeakers, especially wireless and smart models, must comply with strict electromagnetic interference rules. In the United States, devices must adhere to FCC Part 15 regulations. These standards limit radio frequency emissions to prevent interference with other electronic equipment. In the European Union, manufacturers must meet the EMC Directive and Radio Equipment Directive to sell products with CE marking.
The export-import scenario in the loudspeaker market is shaped by global trade dependencies, manufacturing concentration, and evolving tariffs. Loudspeakers are often produced in low-cost manufacturing hubs and shipped to consumer-rich regions, creating both opportunity and volatility in global trade flows.
China dominates global loudspeaker exports due to its large-scale manufacturing capabilities and mature electronics supply chain. Most international brands, including JBL, Sony, and Bose, either manufacture directly in China or source components from Chinese suppliers. This has helped keep global prices competitive but has also exposed the market to geopolitical tensions and trade policy shifts.
The section contains information about the leading segments in the industry. By type, the portable loudspeaker segment is estimated to grow at a CAGR of 7.5% during the forecasted period. Moreover, by deployment, the outdoor deployment segment holds the share of 65.1% in 2025.
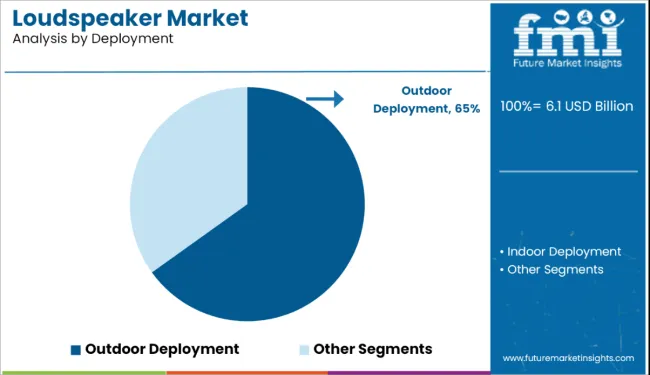
| Deployment | Share (2025) |
|---|---|
| Outdoor Deployment | 65% |
The outdoor deployment segment has the largest market share in the loudspeaker market, mainly due to its widespread use in public address systems, concerts, sporting events, and other large gatherings. High-power loudspeakers with rugged durability are needed for clear and amplified sound over large distances in such environments, thus requiring outdoor-specific designs.
The frequency of outdoor events is increasing while the urban infrastructure is developing smart cities that integrate outdoor audio systems into public safety and information dissemination further supports this segment. Moreover, the progress in weather-resistant and portable outdoor loudspeakers is driving the demand in commercial and institutional applications.
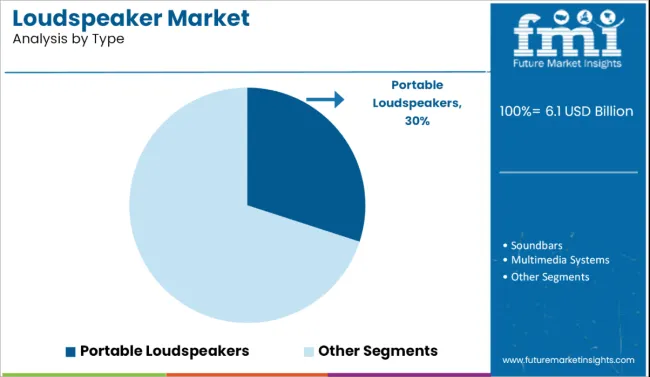
| Type | CAGR (2025 to 2035) |
|---|---|
| Portable Loudspeaker | 7.5% |
Portable loudspeakers are growing at the highest CAGR during the forecasted period, driven by consumers' demand for mobility, easy operation, and compact designs.
The speakers fulfill modern lifestyles through wireless connectivity, lightweight construction, and battery-powered operation, allowing for both indoor and outdoor applications.
Major driving factors include popularity of the usage of devices having a Bluetooth option, increasing music streaming consumption, innovation such as water resistance, quality sound and better battery life for a more youthful demographic, along with professional demand for convenience while presenting at office.
The below table presents the expected CAGR for the global LOUDSPEAKER market over several semi-annual periods spanning from 2025 to 2035. In the first half (H1) of the year from 2024 to 2034, the business is predicted to surge at a CAGR of 6.3%, followed by a slightly higher growth rate of 6.8% in the second half (H2) of the same year.
| Particular | Value CAGR |
|---|---|
| H1, 2024 | 6.3% (2024 to 2034) |
| H2, 2024 | 6.8% (2024 to 2034) |
| H1, 2025 | 7.3% (2025 to 2035) |
| H2, 2025 | 7.5% (2025 to 2035) |
Moving into the subsequent period, from H1 2025 to H2 2035, the CAGR is projected to increase slightly to 7.3% in the first half and remain relatively moderate at 7.5% in the second half. In the first half (H1) the market witnessed a decrease of 30 BPS while in the second half (H2), the market witnessed an increase of 60 BPS.
Rising Adoption of Smart Speakers and Voice-Assistant Integration in Modern Households
The increasing penetration of smart speakers equipped with voice assistants such as Amazon Alexa, Google Assistant, and Apple Siri is a significant driver for the loudspeaker market. Consumers are increasingly adopting these devices for their multifunctional capabilities, including voice-controlled music playback, smart home integration, and hands-free task management.
With the growing smart home ecosystems, loudspeakers are becoming an integral part of connected living. Moreover, improvements in NLP and AI have made these devices more functional and appealing, thereby increasing their adoption in residential and commercial settings.
Growing Demand for High-Quality Audio Solutions in Home Entertainment Systems
The need for better sound quality in home entertainment systems is fueling the adoption of advanced loudspeakers, such as soundbars, subwoofers, and multi-channel speaker systems. With the growing demand for streaming high-definition content, the consumer seeks more immersive audio for their visual entertainment.
Advances such as Dolby Atmos and DTS:X in loudspeakers provide three-dimensional soundscapes that meet this requirement. This is supplemented by growing disposable incomes and rising home theaters in developed and urban markets.
Expansion of Wireless and Portable Speaker Segment Fueled by Technological Advancements
The loudspeaker market is currently experiencing rapid evolution through wireless and portable speaker technologies. With Bluetooth, Wi-Fi, and other innovative technologies, consumer lifestyles are becoming modernized, reflecting a need for portability and convenience through wireless connectivity.
In fact, with recent advancements in batteries and waterproof features, the applications of portable speakers are increasing their usage for entertainment outside and during mobility. The segment is expected to witness growth on account of innovative designs and enhanced audio performance, which appeal to various applications and consumer preferences.
High Competition and Price Sensitivity Among Consumers in Emerging Markets
While significant growth opportunities abound in the market, competition remains intense and highly price-sensitive in emerging markets, and numerous local and regional players offer low-cost alternatives that erode the ability of established brands to command premium pricing.
Additionally, the price conscious region is making consumers more eager to pay minimal for affordable performance, thus adopting expensive loudspeaker. Aggressive competition also led to aggressive prices that might even impact profit lines, hence constraining market development of premium sound makers.
The global Loudspeaker industry recorded a CAGR of 7.3% during the historical period between 2020 and 2024. The growth of LOUDSPEAKER industry was positive as it reached a value of USD 5729.32 million in 2024 from USD 4319.0 million in 2020.
Growing at a significant CAGR rate from 2020 to 2024 Loudspeaker market's growth was found due to significant growth in customer demand for intelligent speakers, as well as enhancements in wireless features, and expanding popularity of multimedia systems.
The market saw high adoption of portable and Bluetooth-enabled speakers, especially among younger demographics, and a boost from work-from-home trends and the growing integration of smart home ecosystems.
Moving into the forecast period from 2025 to 2035, the market is expected to grow at an accelerated pace, fueled by advancements in immersive audio technologies, such as 3D surround sound and AI-driven acoustic optimization. Expansion into emerging markets in Asia-Pacific, Latin America, and the Middle East will be important in this regard due to the growing pace of urbanization and disposable incomes.
Demand for professional-grade loudspeakers for live events, concerts, and public address systems is expected to grow with a normalization of global events and public gatherings post-pandemic, and hence, the next decade is expected to be a period of strong and diversified growth for the loudspeaker industry.
Tier 1- Bose Corporation, Harman International (Samsung Electronics), Sony Corporation, and Sonos, Inc., dominate the Tier 1 space. They have the strongest brand presence in the market and have significant innovation capabilities.
Their products reach out to a vast customer base ranging from high-end audiophiles to general consumers through diversified product lines, such as smart speakers, home theaters, and professional audio equipment. Their consistent R&D investment with partnerships and marketing strategies allow them to stay ahead and dominate the global loudspeaker market.
Tier 2: This tier consists of companies such as Yamaha Corporation, Klipsch Group, Inc., Pioneer Corporation, Vizio Inc., and Bang & Olufsen. They have outstanding performance in regional markets or a niche market area.
These are brands that have good products, which may be aimed at certain types of customers, such as premium home audio or professional-grade sound systems. They wouldn't compare to Tier 1 players on a global level but have strong footholds in regional markets through expertise, brand loyalty, and product specialization, innovation within one niche.
Tier 3: The brands include KEF, Polk Audio, Logitech International S.A., Altec Lansing, and Dynaudio A/S, with business models primarily positioned to meet certain consumer requirements or market segments.
This group is more likely to be known for best-in-class sound quality and aesthetic in targeted application areas such as bookshelf speakers, gaming audio systems, or portable audio devices. While they operate on a smaller scale compared to Tier 1 and Tier 2, their expertise in specialized segments allows them to attract loyal customer bases and compete effectively in targeted markets.
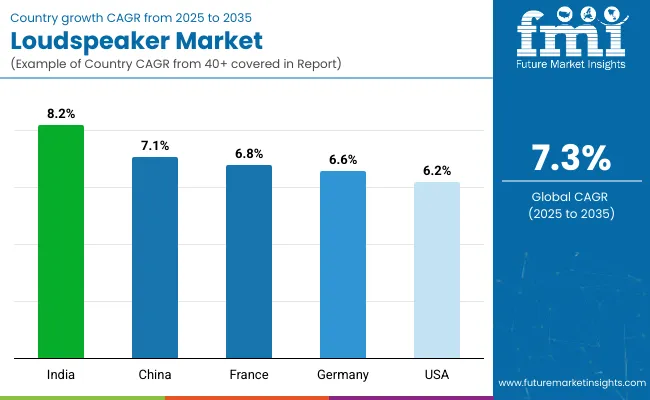
| Countries | Value CAGR (2025 to 2035) |
|---|---|
| USA | 6.2% |
| Germany | 6.6% |
| France | 6.8% |
| China | 7.1% |
| India | 8.2% |
The section below covers the industry analysis for the loudspeaker market for different countries. The market demand analysis on key countries in several countries of the globe, including USA, Germany, Italy, China and India are provided.
The united states are expected to remains at the forefront in North America, with a value share of 55.3% in 2025. In South Asia & Pacific, India is projected to witness a CAGR of 8.2% during the forecasted period.
The United States leads the loudspeaker market due to its strong consumer base for premium audio equipment and early adoption of advanced technologies, including smart speakers and wireless audio solutions. Disposable incomes have been increasing, while home entertainment systems and streaming platforms are popular, making the demand for high-quality loudspeakers higher.
There are also a few leading manufacturers and innovators in the USA, including Bose and Sonos, which constantly push the limits of audio technology. With smart home ecosystems that have gained a footing with the emergence of products like Amazon Echo and Google Nest, this integration propels the growth of the market even further. In fact, the USA has emerged as an innovation hub for loudspeakers.
Loudspeaker Market in India: India's rising urbanization, increasing disposable incomes, and the burgeoning middle class, seeking modern audio solutions for entertainment, have resulted in a rapidly growing market for loudspeakers.
The penetration of the smartphone and affordability of internet services has been on a rise and these have popularized music streaming apps, hence propelling demand in wireless and portable loudspeakers. Also, the penetration of smart home appliances and interest for home theatres among urban consumers are supporting expansion in the market.
India's healthy e-commerce industry has also allowed for greater availability of a variety of loudspeakers to consumers with different tastes, which is further fueling the growth of the market.
China's market for loudspeakers is also growing rapidly due to its massive consumer base, strong manufacturing capabilities, and the increasing adoption of smart home technologies.
The growing middle-class population of this country, along with rising disposable incomes, has increased demand for this country for advanced audio equipment comprising smart speakers and portable devices. The China being one of the world's largest electronic goods manufacturers, its cost-effective production capabilities and a wide array of product offerings ensure accessibility of loudspeakers to the varied segments of the market.
Moreover, the fast growth of IoT and connected devices in China's smart home market has increased the demand for integrated audio solutions, which has made the country a leader in the global loudspeaker industry.
The competitive landscape in the loudspeaker market is quite dynamic, consisting of global majors and niche players that compete in diverse segments, ranging from home audio, portable speakers, to professional sound systems.
Major players, such as Bose Corporation, Harman International, and Sony, continue to dominate the market with solid product portfolios, brand equity, and innovation focus in smart and wireless speaker technologies. Regional players and emerging brands like KEF and Altec Lansing target specific consumer needs with special designs and affordable offerings.
Competition is intense and driving continuous investment in R&D, which brings improvements in features such as voice assistant integration, 3D audio, and enhanced portability. E-commerce platforms and strategic partnerships between manufacturers and retailers further sharpen competition, given the drive for global reach by companies and adaptation to changing consumer preferences.
Recent Industry Developments in Loudspeaker Market
| Report Attributes | Details |
|---|---|
| Current Total Market Size (2025) | USD 6.1 billion |
| Projected Market Size (2035) | USD 12.4 billion |
| CAGR (2025 to 2035) | 7.3% |
| Base Year for Estimation | 2024 |
| Historical Period | 2020 to 2024 |
| Projections Period | 2025 to 2035 |
| Quantitative Units | USD million for value and units for volume |
| Deployment Types Analyzed (Segment 1) | Indoor, Outdoor |
| Speaker Designs Analyzed (Segment 2) | With Diaphragm, Without Diaphragm |
| Types Analyzed (Segment 3) | Soundbars, Home Theatre Arrays, Multimedia Systems, Portable Loudspeakers, Stereo Systems, Others |
| Regions Covered | North America; Latin America; Western Europe; Eastern Europe; South Asia and Pacific; East Asia; Middle East & Africa |
| Countries Covered | United States, Canada, Mexico, Brazil, Argentina, Germany, France, United Kingdom, Italy, Spain, Netherlands, China, India, Japan, South Korea, ANZ, GCC Countries, South Africa |
| Key Players influencing the Loudspeaker Market | Bose Corporation, Harman International (Samsung Electronics), Sony Corporation, Sonos, Inc., Yamaha Corporation, JBL (Harman), Klipsch Group, Inc., Pioneer Corporation, Vizio Inc., Bang & Olufsen, KEF, Polk Audio, Logitech International S.A., Altec Lansing, Dynaudio A/S |
| Additional Attributes | Dollar sales by type (portable, soundbars, multimedia systems), Dollar sales by deployment (indoor vs outdoor), Dollar sales by speaker design (with and without diaphragm), Regional demand patterns for public address systems, Growth in home entertainment and commercial event audio solutions, Influence of wireless and smart speaker technologies |
| Customization and Pricing | Customization and Pricing Available on Request |
In terms of Deployment is segregated Indoor and Outdoor.
In terms of Speaker Design, is distributed into with Diaphragm and Without Diaphragm.
In terms of Type, is distributed into with Soundbars, Home Theatre Arrays, Multimedia Systems, Portable Loudspeakers, Stereo Systems and Others.
Key countries of North America, Latin America, Western Europe, Eastern Europe, East Asia, South Asia & pacific, Middle East and Africa (MEA) have been covered in the report.
The global Loudspeaker industry is projected to witness CAGR of 7.3% between 2025 and 2035.
The global Loudspeaker industry stood at USD 5729.32 million in 2024.
The global Loudspeaker industry is anticipated to reach USD 12.4 billion by 2035 end.
South Asia & Pacific is set to record the highest CAGR of 7.1% in the assessment period.
The key players operating in the global Loudspeaker industry include Bose Corporation, Harman International (Samsung Electronics), Sony Corporation, Sonos, Inc., Yamaha Corporation, JBL (Harman), Klipsch Group, Inc. and others.
Explore Similar Insights

Thank you!
You will receive an email from our Business Development Manager. Please be sure to check your SPAM/JUNK folder too.
Chat With
MaRIA