Reports

- Global Locations -

Headquarters

Future Market Insights, Inc.

Christiana Corporate, 200
Continental Drive, Suite 401,
Newark, Delaware - 19713,
United States

T: +1-845-579-5705

Americas

Future Market Insights, Inc.

616 Corporate Way, Suite 2-9018,
Valley Cottage, NY 10989, United States

T: +1-347-918-3531

MEA

Future Market Insights

1602-6 Jumeirah Bay X2 Tower, Plot No: JLT-PH2-X2A,
Jumeirah Lakes Towers, Dubai,
United Arab Emirates

Europe

Future Market Insights

3rd Floor, 207 Regent Street,
W1B 3HH London
United Kingdom

T: + 44 (0) 20 8123 9659
D: +44 (0) 20 3287 4268

Asia Pacific

Future Market Insights

IndiaLand Global Tech Park, Unit UG-1, Behind Grand HighStreet, Phase 1, Hinjawadi, MH, Pune – 411057, India

Loudspeaker Subwoofer Market Snapshot (2022-2032)

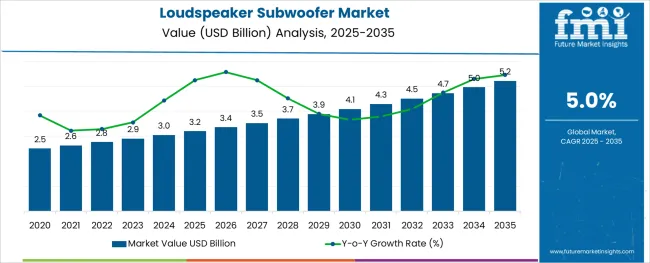
[250 Pages Report] The global sales of loudspeaker subwoofers are anticipated to grow at a moderate CAGR of around 5.0% during the forecast period between 2022 and 2032. Growth is attributed to the rising demand for loudspeaker subwoofers in applications like car audio, sound reinforcement, and home audio.

Report Attribute Details
Loudspeaker Subwoofer Market Projected Growth Rate (2022 to 2032) 5% CAGR

Loudspeaker subwoofers are a type of speaker designed to reproduce low-pitched audio frequencies called bass and sub-bass. Their frequency typically ranges from 20 Hertz to 200 Hertz for most consumer products, below 100 Hz for professional live sound, and below 80Hz in THX certified systems. They are usually made up of one or more woofers mounted in loudspeaker enclosures made of various materials.

In recent years demand for loudspeaker subwoofers has witnessed a significant rise across various end use verticals such as homes, automotive sector, and entertainment industry, and the trend is likely to continue during the forecast period. These loudspeaker subwoofers boost low frequencies of loudspeakers that are intended to cover higher frequency bands. They augment the bass capability of the main speakers and enable the listener to feel the sound

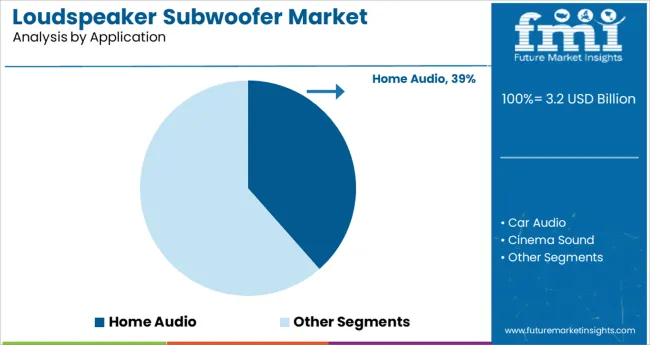
Growing adoption of home theater sound systems and increasing need for improving the sound quality in cinema theaters is expected to boost the sales of loudspeaker subwoofers during the forecast period.

Loudspeaker subwoofer enclosures are available in a variety of designs which includes bass reflex, infinite baffle, tapped horn, acoustic suspension and others.

Don't pay for what you don't need

Customize your report by selecting specific countries or regions and save 30%!

Which are Some Prominent Drivers Spearheading Loudspeaker Subwoofer Market Growth

Rising adoption of loudspeakers for aural communication in conferences, seminars, and other places with large audience, innovations in loudspeakers subwoofer design and size, changing consumer preference and lifestyle, surging adoption of home theater audio systems, and growing demand from entertainment industry are some of the major factors driving the global loudspeaker subwoofer market.

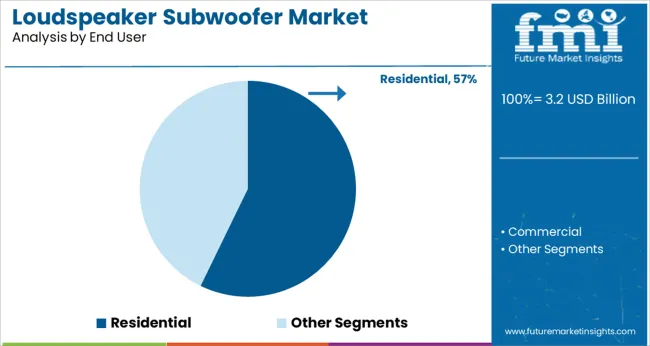
Loudspeaker Subwoofers have gained immense traction across residential and commercial sectors during the last few years due to their ability to reproduce a wide range of frequencies transmitted by audio sources in homes or professional theatres. They are especially ideal for home theater and car stereo systems, as they are compact and easy to set up.

People are increasingly installing loudspeaker subwoofers at homes and theaters for a better sound experience. The audio quality (frequency) that these loudspeaker subwoofers are capable of producing will continue to act as a catalyst for market growth during the forecast period.

Similarly, increasing spending by people on home theatre coupled with rapid expansion of entertainment industry worldwide is expected to generate growth opportunities for the manufactures of loudspeaker subwoofers during the forecast period.

In addition to this, growing adoption of loudspeaker subwoofers in automotive industry and rising popularity of wireless audio and video systems will assist market growth during the forthcoming period.

Today, people, especially the younger generation, are spending large amounts on modifying their vehicle sound systems for a better audio experience. This factor will continue to boost sales of loudspeaker subwoofers during the assessment period.

Which Factors are Challenging the Growth of Loudspeaker Subwoofer Industry

Despite its optimistic stance, the global loudspeaker subwoofer market is facing various challenges that are likely to restrain its growth during the forecast period. Some of these factors are the sound distortion issues with certain subwoofers and availability of poorly designed and cheap loudspeaker subwoofers.

Similarly, delicate nature of loudspeaker subwoofers is also limiting market growth to some extent.
Sudip Saha
Sudip Saha

Principal Consultant

Talk to Analyst

Find your sweet spots for generating winning opportunities in this market.

Will North America Continue its Dominance in the Global Loudspeaker Subwoofer Market

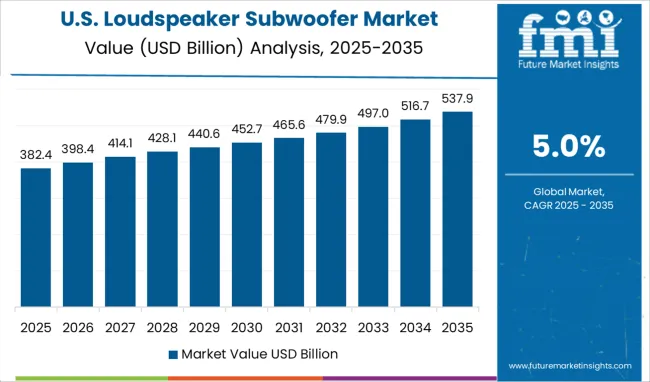
As per FMI, North America accounted for the largest share of the global loudspeaker subwoofer market in 2022 and is forecast to retain its dominance during the forecast period. Growth is attributable to the rising applications of loudspeaker subwoofers across various industries, rising adoption of home theater audio systems, advancements in subwoofers, and heavy presence of leading manufacturers.

The United States remains at the epicenter of the North American loudspeaker subwoofer market growth owing to the rising consumer spending on home theaters, growing demand for better audio sound systems for vehicles, and rapid increase in music concerts.
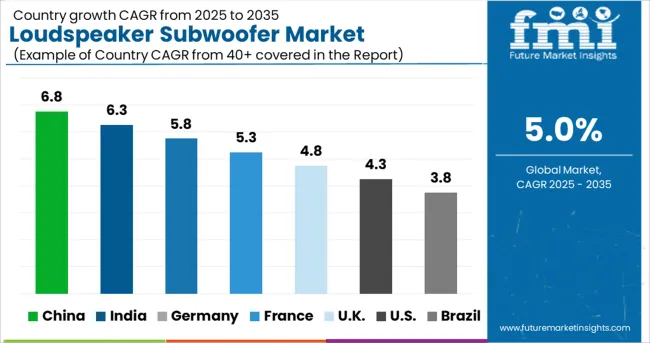
How Will Growth Unfold in Asia Pacific

According to Future Market Insights, the loudspeaker subwoofer market in Asia Pacific is expected to grow at a relatively faster CAGR during the assessment period, owing to the rapid expansion of end-use verticals, ever-rising trend of research and development in loudspeaker subwoofer and loudspeaker related fields, and large presence of regional and domestic market players.
Get the data you need at a Fraction of the cost

Personalize your report by choosing insights you need
and save 40%!

Market Competition

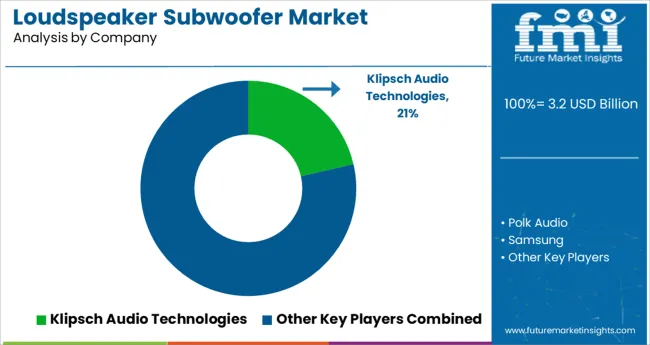
Some of the key participants present in the global loudspeaker subwoofer market include Polk Audio, Yamaha Corporation, Klipsch Group, Inc., SVS Inc., Samsung, ELAC Electroacustic GmbH; Sonos, Inc., BIC America, Rockford Corp., JL Audio, Alpine Electronics, Inc., Kicker Audio (Stillwater Designs), MTX International, and Pioneer Electronics (USA) Inc., among others.

The global loudspeaker market is highly competitive in nature due to a large presence of regional and domestic players. In order to capitalize and increase their sales, leading players are adopting various growth strategies such as new product launches, partnerships, acquisitions, collaborations, adoption of online sales channels, and spending in research and development.

Report Scope

Report Attribute Details
Growth Rate CAGR of 5% from 2022 to 2032
Base Year for Estimation 2021
Historical Data 2015 to 2020
Forecast Period 2022 to 2032
Quantitative Units Revenue in USD Million and CAGR from 2022 to 2032
Report Coverage Revenue Forecast, Volume Forecast, Company Ranking, Competitive Landscape, Growth Factors, Trends and Pricing Analysis
Segments Covered
  • Application
  • End User
  • Region
Regions Covered
  • North America
  • Latin America
  • Western Europe
  • Eastern Europe
  • APEJ
  • Japan
  • Middle East and Africa
Key Countries Profiled
  • USA
  • Canada
  • Brazil
  • Argentina
  • Germany
  • UK
  • France
  • Spain
  • Italy
  • Nordics
  • BENELUX
  • Australia & New Zealand
  • China
  • India
  • ASEAN
  • GCC
  • South Africa
Key Companies Profiled
  • Polk Audio
  • Yamaha Corporation
  • Klipsch Group, Inc.
  • SVS Inc.
  • Samsung
  • ELAC Electroacustic GmbH
  • Sonos, Inc.
  • BIC America
  • Rockford Corp.
  • JL Audio
  • Alpine Electronics, Inc.
  • Kicker Audio (Stillwater Designs)
  • MTX International
  • Pioneer Electronics (USA) Inc., among others.
Customization Available Upon Request

Key Segments Profiled in the Loudspeaker Subwoofer Industry Survey

By Application:

  • Car Audio
  • Home Audio
  • Cinema Sound
  • Sound Reinforcement
  • Other Applications

By End User:

  • Residential
  • Commercial

By Region:

  • North America
  • Latin America
  • Western Europe
  • Eastern Europe
  • APEJ
  • Japan
  • Middle East & Africa

Frequently Asked Questions

What is the growth projection for the global loudspeaker subwoofer market?

FMI projects the global loudspeaker subwoofer market to expand at around 5% CAGR over the assessment period.

Which region holds maximum potential for loudspeaker subwoofer market growth?

As pe FMI, Asia Pacific is expected generate lucrative opportunities for the loudspeaker subwoofer market growth during the forecast period.

Which are some prominent loudspeaker subwoofer manufacturers?

Some of the key participants present in the global loudspeaker subwoofer market include Polk Audio, Yamaha Corporation, Klipsch Group, Inc., SVS Inc., Samsung, and Sonos, Inc. are some prominent loudspeaker subwoofer manufacturers

Table of Content

1. Executive Summary

    1.1. Global Market Outlook

    1.2. Demand-side Trends

    1.3. Supply-side Trends

    1.4. Technology Roadmap Analysis

    1.5. Analysis and Recommendations

2. Market Overview

    2.1. Market Coverage / Taxonomy

    2.2. Market Definition / Scope / Limitations

3. Market Background

    3.1. Market Dynamics

        3.1.1. Drivers

        3.1.2. Restraints

        3.1.3. Opportunity

        3.1.4. Trends

    3.2. Scenario Forecast

        3.2.1. Demand in Optimistic Scenario

        3.2.2. Demand in Likely Scenario

        3.2.3. Demand in Conservative Scenario

    3.3. Opportunity Map Analysis

    3.4. Product Life Cycle Analysis

    3.5. Supply Chain Analysis

        3.5.1. Supply Side Participants and their Roles

            3.5.1.1. Producers

            3.5.1.2. Mid-Level Participants (Traders/ Agents/ Brokers)

            3.5.1.3. Wholesalers and Distributors

        3.5.2. Value Added and Value Created at Node in the Supply Chain

        3.5.3. List of Raw Material Suppliers

        3.5.4. List of Existing and Potential Buyer’s

    3.6. Investment Feasibility Matrix

    3.7. Value Chain Analysis

        3.7.1. Profit Margin Analysis

        3.7.2. Wholesalers and Distributors

        3.7.3. Retailers

    3.8. PESTLE and Porter’s Analysis

    3.9. Regulatory Landscape

        3.9.1. By Key Regions

        3.9.2. By Key Countries

    3.10. Regional Parent Market Outlook

    3.11. Production and Consumption Statistics

    3.12. Import and Export Statistics

4. Global Loudspeaker Subwoofer Market Analysis 2017-2021 and Forecast, 2022-2032

    4.1. Historical Market Size Value (US$ Mn) & Volume (000 Units) Analysis, 2017-2021

    4.2. Current and Future Market Size Value (US$ Mn) & Volume (000 Units) Projections, 2022-2032

        4.2.1. Y-o-Y Growth Trend Analysis

        4.2.2. Absolute $ Opportunity Analysis

5. Global Loudspeaker Subwoofer Market Analysis 2017-2021 and Forecast 2022-2032, By Type

    5.1. Introduction / Key Findings

    5.2. Historical Market Size Value (US$ Mn) & Volume (000 Units) Analysis By Type, 2017-2021

    5.3. Current and Future Market Size Value (US$ Mn) & Volume (000 Units) Analysis and Forecast By Type, 2022-2032

        5.3.1. Active Subwoofer

        5.3.2. Passive Subwoofer

        5.3.3. Ported Subwoofer

        5.3.4. Horn Loaded Subwoofers

        5.3.5. Other Active Subwoofers

    5.4. Y-o-Y Growth Trend Analysis By Type, 2017-2021

    5.5. Absolute $ Opportunity Analysis By Type, 2022-2032

Deep-dive segmentation will be available in the sample on request

6. Global Loudspeaker Subwoofer Market Analysis 2017-2021 and Forecast 2022-2032, By Connectivity Type

    6.1. Introduction / Key Findings

    6.2. Historical Market Size Value (US$ Mn) & Volume (000 Units) Analysis By Connectivity Type, 2017-2021

    6.3. Current and Future Market Size Value (US$ Mn) & Volume (000 Units) Analysis and Forecast By Connectivity Type, 2022-2032

        6.3.1. Wired Subwoofer

        6.3.2. Wireless Subwoofer

    6.4. Y-o-Y Growth Trend Analysis By Connectivity Type, 2017-2021

    6.5. Absolute $ Opportunity Analysis By Connectivity Type, 2022-2032

Deep-dive segmentation will be available in the sample on request

7. Global Loudspeaker Subwoofer Market Analysis 2017-2021 and Forecast 2022-2032, By Application

    7.1. Introduction / Key Findings

    7.2. Historical Market Size Value (US$ Mn) & Volume (000 Units) Analysis By Application, 2017-2021

    7.3. Current and Future Market Size Value (US$ Mn) & Volume (000 Units) Analysis and Forecast By Application, 2022-2032

        7.3.1. Car Audio

        7.3.2. Home Audio

        7.3.3. Cinema Sound

        7.3.4. Sound Reinforcement

        7.3.5. Other Applications

    7.4. Y-o-Y Growth Trend Analysis By Application, 2017-2021

    7.5. Absolute $ Opportunity Analysis By Application, 2022-2032

Deep-dive segmentation will be available in the sample on request

8. Global Loudspeaker Subwoofer Market Analysis 2017-2021 and Forecast 2022-2032, By Region

    8.1. Introduction

    8.2. Historical Market Size Value (US$ Mn) & Volume (000 Units) Analysis By Region, 2017-2021

    8.3. Current Market Size Value (US$ Mn) & Volume (000 Units) Analysis and Forecast By Region, 2022-2032

        8.3.1. North America

        8.3.2. Latin America

        8.3.3. Europe

        8.3.4. East Asia

        8.3.5. South Asia & Pacific

        8.3.6. MEA

    8.4. Market Attractiveness Analysis By Region

9. North America Loudspeaker Subwoofer Market Analysis 2017-2021 and Forecast 2022-2032, By Country

    9.1. Historical Market Size Value (US$ Mn) & Volume (000 Units) Trend Analysis By Market Taxonomy, 2017-2021

    9.2. Market Size Value (US$ Mn) & Volume (000 Units) Forecast By Market Taxonomy, 2022-2032

        9.2.1. By Country

            9.2.1.1. U.S.

            9.2.1.2. Canada

        9.2.2. By Type

        9.2.3. By Connectivity Type

        9.2.4. By Application

    9.3. Market Attractiveness Analysis

        9.3.1. By Country

        9.3.2. By Type

        9.3.3. By Connectivity Type

        9.3.4. By Application

    9.4. Key Takeaways

10. Latin America Loudspeaker Subwoofer Market Analysis 2017-2021 and Forecast 2022-2032, By Country

    10.1. Historical Market Size Value (US$ Mn) & Volume (000 Units) Trend Analysis By Market Taxonomy, 2017-2021

    10.2. Market Size Value (US$ Mn) & Volume (000 Units) Forecast By Market Taxonomy, 2022-2032

        10.2.1. By Country

            10.2.1.1. Mexico

            10.2.1.2. Brazil

            10.2.1.3. Rest of Latin America

        10.2.2. By Type

        10.2.3. By Connectivity Type

        10.2.4. By Application

    10.3. Market Attractiveness Analysis

        10.3.1. By Country

        10.3.2. By Type

        10.3.3. By Connectivity Type

        10.3.4. By Application

    10.4. Key Takeaways

11. Europe Loudspeaker Subwoofer Market Analysis 2017-2021 and Forecast 2022-2032, By Country

    11.1. Historical Market Size Value (US$ Mn) & Volume (000 Units) Trend Analysis By Market Taxonomy, 2017-2021

    11.2. Market Size Value (US$ Mn) & Volume (000 Units) Forecast By Market Taxonomy, 2022-2032

        11.2.1. By Country

            11.2.1.1. Germany

            11.2.1.2. Italy

            11.2.1.3. France

            11.2.1.4. U.K.

            11.2.1.5. Spain

            11.2.1.6. BENELUX

            11.2.1.7. Russia

            11.2.1.8. Rest of Europe

        11.2.2. By Type

        11.2.3. By Connectivity Type

        11.2.4. By Application

    11.3. Market Attractiveness Analysis

        11.3.1. By Country

        11.3.2. By Type

        11.3.3. By Connectivity Type

        11.3.4. By Application

    11.4. Key Takeaways

12. East Asia Loudspeaker Subwoofer Market Analysis 2017-2021 and Forecast 2022-2032, By Country

    12.1. Historical Market Size Value (US$ Mn) & Volume (000 Units) Trend Analysis By Market Taxonomy, 2017-2021

    12.2. Market Size Value (US$ Mn) & Volume (000 Units) Forecast By Market Taxonomy, 2022-2032

        12.2.1. By Country

            12.2.1.1. China

            12.2.1.2. Japan

            12.2.1.3. South Korea

        12.2.2. By Type

        12.2.3. By Connectivity Type

        12.2.4. By Application

    12.3. Market Attractiveness Analysis

        12.3.1. By Country

        12.3.2. By Type

        12.3.3. By Connectivity Type

        12.3.4. By Application

    12.4. Key Takeaways

13. South Asia & Pacific Loudspeaker Subwoofer Market Analysis 2017-2021 and Forecast 2022-2032, By Country

    13.1. Historical Market Size Value (US$ Mn) & Volume (000 Units) Trend Analysis By Market Taxonomy, 2017-2021

    13.2. Market Size Value (US$ Mn) & Volume (000 Units) Forecast By Market Taxonomy, 2022-2032

        13.2.1. By Country

            13.2.1.1. India

            13.2.1.2. ASEAN

            13.2.1.3. Australia and New Zealand

            13.2.1.4. Rest of South Asia & Pacific

        13.2.2. By Type

        13.2.3. By Connectivity Type

        13.2.4. By Application

    13.3. Market Attractiveness Analysis

        13.3.1. By Country

        13.3.2. By Type

        13.3.3. By Connectivity Type

        13.3.4. By Application

    13.4. Key Takeaways

14. MEA Loudspeaker Subwoofer Market Analysis 2017-2021 and Forecast 2022-2032, By Country

    14.1. Historical Market Size Value (US$ Mn) & Volume (000 Units) Trend Analysis By Market Taxonomy, 2017-2021

    14.2. Market Size Value (US$ Mn) & Volume (000 Units) Forecast By Market Taxonomy, 2022-2032

        14.2.1. By Country

            14.2.1.1. GCC Countries

            14.2.1.2. Turkey

            14.2.1.3. South Africa

            14.2.1.4. Rest of MEA

        14.2.2. By Type

        14.2.3. By Connectivity Type

        14.2.4. By Application

    14.3. Market Attractiveness Analysis

        14.3.1. By Country

        14.3.2. By Type

        14.3.3. By Connectivity Type

        14.3.4. By Application

    14.4. Key Takeaways

15. Key Countries Loudspeaker Subwoofer Market Analysis

    15.1. U.S.

        15.1.1. Pricing Analysis

        15.1.2. Market Share Analysis, 2021

            15.1.2.1. By Type

            15.1.2.2. By Connectivity Type

            15.1.2.3. By Application

    15.2. Canada

        15.2.1. Pricing Analysis

        15.2.2. Market Share Analysis, 2021

            15.2.2.1. By Type

            15.2.2.2. By Connectivity Type

            15.2.2.3. By Application

    15.3. Mexico

        15.3.1. Pricing Analysis

        15.3.2. Market Share Analysis, 2021

            15.3.2.1. By Type

            15.3.2.2. By Connectivity Type

            15.3.2.3. By Application

    15.4. Brazil

        15.4.1. Pricing Analysis

        15.4.2. Market Share Analysis, 2021

            15.4.2.1. By Type

            15.4.2.2. By Connectivity Type

            15.4.2.3. By Application

    15.5. Germany

        15.5.1. Pricing Analysis

        15.5.2. Market Share Analysis, 2021

            15.5.2.1. By Type

            15.5.2.2. By Connectivity Type

            15.5.2.3. By Application

    15.6. Italy

        15.6.1. Pricing Analysis

        15.6.2. Market Share Analysis, 2021

            15.6.2.1. By Type

            15.6.2.2. By Connectivity Type

            15.6.2.3. By Application

    15.7. France

        15.7.1. Pricing Analysis

        15.7.2. Market Share Analysis, 2021

            15.7.2.1. By Type

            15.7.2.2. By Connectivity Type

            15.7.2.3. By Application

    15.8. U.K.

        15.8.1. Pricing Analysis

        15.8.2. Market Share Analysis, 2021

            15.8.2.1. By Type

            15.8.2.2. By Connectivity Type

            15.8.2.3. By Application

    15.9. Spain

        15.9.1. Pricing Analysis

        15.9.2. Market Share Analysis, 2021

            15.9.2.1. By Type

            15.9.2.2. By Connectivity Type

            15.9.2.3. By Application

    15.10. BENELUX

        15.10.1. Pricing Analysis

        15.10.2. Market Share Analysis, 2021

            15.10.2.1. By Type

            15.10.2.2. By Connectivity Type

            15.10.2.3. By Application

    15.11. Russia

        15.11.1. Pricing Analysis

        15.11.2. Market Share Analysis, 2021

            15.11.2.1. By Type

            15.11.2.2. By Connectivity Type

            15.11.2.3. By Application

    15.12. China

        15.12.1. Pricing Analysis

        15.12.2. Market Share Analysis, 2021

            15.12.2.1. By Type

            15.12.2.2. By Connectivity Type

            15.12.2.3. By Application

    15.13. Japan

        15.13.1. Pricing Analysis

        15.13.2. Market Share Analysis, 2021

            15.13.2.1. By Type

            15.13.2.2. By Connectivity Type

            15.13.2.3. By Application

    15.14. South Korea

        15.14.1. Pricing Analysis

        15.14.2. Market Share Analysis, 2021

            15.14.2.1. By Type

            15.14.2.2. By Connectivity Type

            15.14.2.3. By Application

    15.15. India

        15.15.1. Pricing Analysis

        15.15.2. Market Share Analysis, 2021

            15.15.2.1. By Type

            15.15.2.2. By Connectivity Type

            15.15.2.3. By Application

    15.16. ASEAN

        15.16.1. Pricing Analysis

        15.16.2. Market Share Analysis, 2021

            15.16.2.1. By Type

            15.16.2.2. By Connectivity Type

            15.16.2.3. By Application

    15.17. Australia and New Zealand

        15.17.1. Pricing Analysis

        15.17.2. Market Share Analysis, 2021

            15.17.2.1. By Type

            15.17.2.2. By Connectivity Type

            15.17.2.3. By Application

    15.18. GCC Countries

        15.18.1. Pricing Analysis

        15.18.2. Market Share Analysis, 2021

            15.18.2.1. By Type

            15.18.2.2. By Connectivity Type

            15.18.2.3. By Application

    15.19. Turkey

        15.19.1. Pricing Analysis

        15.19.2. Market Share Analysis, 2021

            15.19.2.1. By Type

            15.19.2.2. By Connectivity Type

            15.19.2.3. By Application

    15.20. South Africa

        15.20.1. Pricing Analysis

        15.20.2. Market Share Analysis, 2021

            15.20.2.1. By Type

            15.20.2.2. By Connectivity Type

            15.20.2.3. By Application

16. Market Structure Analysis

    16.1. Competition Dashboard

    16.2. Competition Benchmarking

    16.3. Market Share Analysis of Top Players

        16.3.1. By Regional

        16.3.2. By Type

        16.3.3. By Connectivity Type

        16.3.4. By Application

17. Competition Analysis

    17.1. Competition Deep Dive

        17.1.1. Klipsch Audio Technologies

            17.1.1.1. Overview

            17.1.1.2. Product Portfolio

            17.1.1.3. Profitability by Market Segments

            17.1.1.4. Sales Footprint

            17.1.1.5. Strategy Overview

                17.1.1.5.1. Marketing Strategy

                17.1.1.5.2. Product Strategy

                17.1.1.5.3. Channel Strategy

        17.1.2. Polk Audio

            17.1.2.1. Overview

            17.1.2.2. Product Portfolio

            17.1.2.3. Profitability by Market Segments

            17.1.2.4. Sales Footprint

            17.1.2.5. Strategy Overview

                17.1.2.5.1. Marketing Strategy

                17.1.2.5.2. Product Strategy

                17.1.2.5.3. Channel Strategy

        17.1.3. Samsung

            17.1.3.1. Overview

            17.1.3.2. Product Portfolio

            17.1.3.3. Profitability by Market Segments

            17.1.3.4. Sales Footprint

            17.1.3.5. Strategy Overview

                17.1.3.5.1. Marketing Strategy

                17.1.3.5.2. Product Strategy

                17.1.3.5.3. Channel Strategy

        17.1.4. Alpine Electronics

            17.1.4.1. Overview

            17.1.4.2. Product Portfolio

            17.1.4.3. Profitability by Market Segments

            17.1.4.4. Sales Footprint

            17.1.4.5. Strategy Overview

                17.1.4.5.1. Marketing Strategy

                17.1.4.5.2. Product Strategy

                17.1.4.5.3. Channel Strategy

        17.1.5. JL Audio

            17.1.5.1. Overview

            17.1.5.2. Product Portfolio

            17.1.5.3. Profitability by Market Segments

            17.1.5.4. Sales Footprint

            17.1.5.5. Strategy Overview

                17.1.5.5.1. Marketing Strategy

                17.1.5.5.2. Product Strategy

                17.1.5.5.3. Channel Strategy

        17.1.6. Sonos

            17.1.6.1. Overview

            17.1.6.2. Product Portfolio

            17.1.6.3. Profitability by Market Segments

            17.1.6.4. Sales Footprint

            17.1.6.5. Strategy Overview

                17.1.6.5.1. Marketing Strategy

                17.1.6.5.2. Product Strategy

                17.1.6.5.3. Channel Strategy

        17.1.7. Sony

            17.1.7.1. Overview

            17.1.7.2. Product Portfolio

            17.1.7.3. Profitability by Market Segments

            17.1.7.4. Sales Footprint

            17.1.7.5. Strategy Overview

                17.1.7.5.1. Marketing Strategy

                17.1.7.5.2. Product Strategy

                17.1.7.5.3. Channel Strategy

        17.1.8. Edifier

            17.1.8.1. Overview

            17.1.8.2. Product Portfolio

            17.1.8.3. Profitability by Market Segments

            17.1.8.4. Sales Footprint

            17.1.8.5. Strategy Overview

                17.1.8.5.1. Marketing Strategy

                17.1.8.5.2. Product Strategy

                17.1.8.5.3. Channel Strategy

        17.1.9. Kicker Audio

            17.1.9.1. Overview

            17.1.9.2. Product Portfolio

            17.1.9.3. Profitability by Market Segments

            17.1.9.4. Sales Footprint

            17.1.9.5. Strategy Overview

                17.1.9.5.1. Marketing Strategy

                17.1.9.5.2. Product Strategy

                17.1.9.5.3. Channel Strategy

        17.1.10. Elac

            17.1.10.1. Overview

            17.1.10.2. Product Portfolio

            17.1.10.3. Profitability by Market Segments

            17.1.10.4. Sales Footprint

            17.1.10.5. Strategy Overview

                17.1.10.5.1. Marketing Strategy

                17.1.10.5.2. Product Strategy

                17.1.10.5.3. Channel Strategy

18. Assumptions & Acronyms Used

19. Research Methodology

List of Tables

Table 1: Global Loudspeaker Subwoofer Market Value (US$ Mn) Forecast by Region, 2017-2032

Table 2: Global Loudspeaker Subwoofer Market Volume (000 Units) Forecast by Region, 2017-2032

Table 3: Global Loudspeaker Subwoofer Market Value (US$ Mn) Forecast by Type, 2017-2032

Table 4: Global Loudspeaker Subwoofer Market Volume (000 Units) Forecast by Type, 2017-2032

Table 5: Global Loudspeaker Subwoofer Market Value (US$ Mn) Forecast by Connectivity Type, 2017-2032

Table 6: Global Loudspeaker Subwoofer Market Volume (000 Units) Forecast by Connectivity Type, 2017-2032

Table 7: Global Loudspeaker Subwoofer Market Value (US$ Mn) Forecast by Application, 2017-2032

Table 8: Global Loudspeaker Subwoofer Market Volume (000 Units) Forecast by Application, 2017-2032

Table 9: North America Loudspeaker Subwoofer Market Value (US$ Mn) Forecast by Country, 2017-2032

Table 10: North America Loudspeaker Subwoofer Market Volume (000 Units) Forecast by Country, 2017-2032

Table 11: North America Loudspeaker Subwoofer Market Value (US$ Mn) Forecast by Type, 2017-2032

Table 12: North America Loudspeaker Subwoofer Market Volume (000 Units) Forecast by Type, 2017-2032

Table 13: North America Loudspeaker Subwoofer Market Value (US$ Mn) Forecast by Connectivity Type, 2017-2032

Table 14: North America Loudspeaker Subwoofer Market Volume (000 Units) Forecast by Connectivity Type, 2017-2032

Table 15: North America Loudspeaker Subwoofer Market Value (US$ Mn) Forecast by Application, 2017-2032

Table 16: North America Loudspeaker Subwoofer Market Volume (000 Units) Forecast by Application, 2017-2032

Table 17: Latin America Loudspeaker Subwoofer Market Value (US$ Mn) Forecast by Country, 2017-2032

Table 18: Latin America Loudspeaker Subwoofer Market Volume (000 Units) Forecast by Country, 2017-2032

Table 19: Latin America Loudspeaker Subwoofer Market Value (US$ Mn) Forecast by Type, 2017-2032

Table 20: Latin America Loudspeaker Subwoofer Market Volume (000 Units) Forecast by Type, 2017-2032

Table 21: Latin America Loudspeaker Subwoofer Market Value (US$ Mn) Forecast by Connectivity Type, 2017-2032

Table 22: Latin America Loudspeaker Subwoofer Market Volume (000 Units) Forecast by Connectivity Type, 2017-2032

Table 23: Latin America Loudspeaker Subwoofer Market Value (US$ Mn) Forecast by Application, 2017-2032

Table 24: Latin America Loudspeaker Subwoofer Market Volume (000 Units) Forecast by Application, 2017-2032

Table 25: Europe Loudspeaker Subwoofer Market Value (US$ Mn) Forecast by Country, 2017-2032

Table 26: Europe Loudspeaker Subwoofer Market Volume (000 Units) Forecast by Country, 2017-2032

Table 27: Europe Loudspeaker Subwoofer Market Value (US$ Mn) Forecast by Type, 2017-2032

Table 28: Europe Loudspeaker Subwoofer Market Volume (000 Units) Forecast by Type, 2017-2032

Table 29: Europe Loudspeaker Subwoofer Market Value (US$ Mn) Forecast by Connectivity Type, 2017-2032

Table 30: Europe Loudspeaker Subwoofer Market Volume (000 Units) Forecast by Connectivity Type, 2017-2032

Table 31: Europe Loudspeaker Subwoofer Market Value (US$ Mn) Forecast by Application, 2017-2032

Table 32: Europe Loudspeaker Subwoofer Market Volume (000 Units) Forecast by Application, 2017-2032

Table 33: East Asia Loudspeaker Subwoofer Market Value (US$ Mn) Forecast by Country, 2017-2032

Table 34: East Asia Loudspeaker Subwoofer Market Volume (000 Units) Forecast by Country, 2017-2032

Table 35: East Asia Loudspeaker Subwoofer Market Value (US$ Mn) Forecast by Type, 2017-2032

Table 36: East Asia Loudspeaker Subwoofer Market Volume (000 Units) Forecast by Type, 2017-2032

Table 37: East Asia Loudspeaker Subwoofer Market Value (US$ Mn) Forecast by Connectivity Type, 2017-2032

Table 38: East Asia Loudspeaker Subwoofer Market Volume (000 Units) Forecast by Connectivity Type, 2017-2032

Table 39: East Asia Loudspeaker Subwoofer Market Value (US$ Mn) Forecast by Application, 2017-2032

Table 40: East Asia Loudspeaker Subwoofer Market Volume (000 Units) Forecast by Application, 2017-2032

Table 41: South Asia & Pacific Loudspeaker Subwoofer Market Value (US$ Mn) Forecast by Country, 2017-2032

Table 42: South Asia & Pacific Loudspeaker Subwoofer Market Volume (000 Units) Forecast by Country, 2017-2032

Table 43: South Asia & Pacific Loudspeaker Subwoofer Market Value (US$ Mn) Forecast by Type, 2017-2032

Table 44: South Asia & Pacific Loudspeaker Subwoofer Market Volume (000 Units) Forecast by Type, 2017-2032

Table 45: South Asia & Pacific Loudspeaker Subwoofer Market Value (US$ Mn) Forecast by Connectivity Type, 2017-2032

Table 46: South Asia & Pacific Loudspeaker Subwoofer Market Volume (000 Units) Forecast by Connectivity Type, 2017-2032

Table 47: South Asia & Pacific Loudspeaker Subwoofer Market Value (US$ Mn) Forecast by Application, 2017-2032

Table 48: South Asia & Pacific Loudspeaker Subwoofer Market Volume (000 Units) Forecast by Application, 2017-2032

Table 49: MEA Loudspeaker Subwoofer Market Value (US$ Mn) Forecast by Country, 2017-2032

Table 50: MEA Loudspeaker Subwoofer Market Volume (000 Units) Forecast by Country, 2017-2032

Table 51: MEA Loudspeaker Subwoofer Market Value (US$ Mn) Forecast by Type, 2017-2032

Table 52: MEA Loudspeaker Subwoofer Market Volume (000 Units) Forecast by Type, 2017-2032

Table 53: MEA Loudspeaker Subwoofer Market Value (US$ Mn) Forecast by Connectivity Type, 2017-2032

Table 54: MEA Loudspeaker Subwoofer Market Volume (000 Units) Forecast by Connectivity Type, 2017-2032

Table 55: MEA Loudspeaker Subwoofer Market Value (US$ Mn) Forecast by Application, 2017-2032

Table 56: MEA Loudspeaker Subwoofer Market Volume (000 Units) Forecast by Application, 2017-2032

List of Charts

Figure 1: Global Loudspeaker Subwoofer Market Value (US$ Mn) by Type, 2022-2032

Figure 2: Global Loudspeaker Subwoofer Market Value (US$ Mn) by Connectivity Type, 2022-2032

Figure 3: Global Loudspeaker Subwoofer Market Value (US$ Mn) by Application, 2022-2032

Figure 4: Global Loudspeaker Subwoofer Market Value (US$ Mn) by Region, 2022-2032

Figure 5: Global Loudspeaker Subwoofer Market Value (US$ Mn) Analysis by Region, 2017-2032

Figure 6: Global Loudspeaker Subwoofer Market Volume (000 Units) Analysis by Region, 2017-2032

Figure 7: Global Loudspeaker Subwoofer Market Value Share (%) and BPS Analysis by Region, 2022-2032

Figure 8: Global Loudspeaker Subwoofer Market Y-o-Y Growth (%) Projections by Region, 2022-2032

Figure 9: Global Loudspeaker Subwoofer Market Value (US$ Mn) Analysis by Type, 2017-2032

Figure 10: Global Loudspeaker Subwoofer Market Volume (000 Units) Analysis by Type, 2017-2032

Figure 11: Global Loudspeaker Subwoofer Market Value Share (%) and BPS Analysis by Type, 2022-2032

Figure 12: Global Loudspeaker Subwoofer Market Y-o-Y Growth (%) Projections by Type, 2022-2032

Figure 13: Global Loudspeaker Subwoofer Market Value (US$ Mn) Analysis by Connectivity Type, 2017-2032

Figure 14: Global Loudspeaker Subwoofer Market Volume (000 Units) Analysis by Connectivity Type, 2017-2032

Figure 15: Global Loudspeaker Subwoofer Market Value Share (%) and BPS Analysis by Connectivity Type, 2022-2032

Figure 16: Global Loudspeaker Subwoofer Market Y-o-Y Growth (%) Projections by Connectivity Type, 2022-2032

Figure 17: Global Loudspeaker Subwoofer Market Value (US$ Mn) Analysis by Application, 2017-2032

Figure 18: Global Loudspeaker Subwoofer Market Volume (000 Units) Analysis by Application, 2017-2032

Figure 19: Global Loudspeaker Subwoofer Market Value Share (%) and BPS Analysis by Application, 2022-2032

Figure 20: Global Loudspeaker Subwoofer Market Y-o-Y Growth (%) Projections by Application, 2022-2032

Figure 21: Global Loudspeaker Subwoofer Market Attractiveness by Type, 2022-2032

Figure 22: Global Loudspeaker Subwoofer Market Attractiveness by Connectivity Type, 2022-2032

Figure 23: Global Loudspeaker Subwoofer Market Attractiveness by Application, 2022-2032

Figure 24: Global Loudspeaker Subwoofer Market Attractiveness by Region, 2022-2032

Figure 25: North America Loudspeaker Subwoofer Market Value (US$ Mn) by Type, 2022-2032

Figure 26: North America Loudspeaker Subwoofer Market Value (US$ Mn) by Connectivity Type, 2022-2032

Figure 27: North America Loudspeaker Subwoofer Market Value (US$ Mn) by Application, 2022-2032

Figure 28: North America Loudspeaker Subwoofer Market Value (US$ Mn) by Country, 2022-2032

Figure 29: North America Loudspeaker Subwoofer Market Value (US$ Mn) Analysis by Country, 2017-2032

Figure 30: North America Loudspeaker Subwoofer Market Volume (000 Units) Analysis by Country, 2017-2032

Figure 31: North America Loudspeaker Subwoofer Market Value Share (%) and BPS Analysis by Country, 2022-2032

Figure 32: North America Loudspeaker Subwoofer Market Y-o-Y Growth (%) Projections by Country, 2022-2032

Figure 33: North America Loudspeaker Subwoofer Market Value (US$ Mn) Analysis by Type, 2017-2032

Figure 34: North America Loudspeaker Subwoofer Market Volume (000 Units) Analysis by Type, 2017-2032

Figure 35: North America Loudspeaker Subwoofer Market Value Share (%) and BPS Analysis by Type, 2022-2032

Figure 36: North America Loudspeaker Subwoofer Market Y-o-Y Growth (%) Projections by Type, 2022-2032

Figure 37: North America Loudspeaker Subwoofer Market Value (US$ Mn) Analysis by Connectivity Type, 2017-2032

Figure 38: North America Loudspeaker Subwoofer Market Volume (000 Units) Analysis by Connectivity Type, 2017-2032

Figure 39: North America Loudspeaker Subwoofer Market Value Share (%) and BPS Analysis by Connectivity Type, 2022-2032

Figure 40: North America Loudspeaker Subwoofer Market Y-o-Y Growth (%) Projections by Connectivity Type, 2022-2032

Figure 41: North America Loudspeaker Subwoofer Market Value (US$ Mn) Analysis by Application, 2017-2032

Figure 42: North America Loudspeaker Subwoofer Market Volume (000 Units) Analysis by Application, 2017-2032

Figure 43: North America Loudspeaker Subwoofer Market Value Share (%) and BPS Analysis by Application, 2022-2032

Figure 44: North America Loudspeaker Subwoofer Market Y-o-Y Growth (%) Projections by Application, 2022-2032

Figure 45: North America Loudspeaker Subwoofer Market Attractiveness by Type, 2022-2032

Figure 46: North America Loudspeaker Subwoofer Market Attractiveness by Connectivity Type, 2022-2032

Figure 47: North America Loudspeaker Subwoofer Market Attractiveness by Application, 2022-2032

Figure 48: North America Loudspeaker Subwoofer Market Attractiveness by Country, 2022-2032

Figure 49: Latin America Loudspeaker Subwoofer Market Value (US$ Mn) by Type, 2022-2032

Figure 50: Latin America Loudspeaker Subwoofer Market Value (US$ Mn) by Connectivity Type, 2022-2032

Figure 51: Latin America Loudspeaker Subwoofer Market Value (US$ Mn) by Application, 2022-2032

Figure 52: Latin America Loudspeaker Subwoofer Market Value (US$ Mn) by Country, 2022-2032

Figure 53: Latin America Loudspeaker Subwoofer Market Value (US$ Mn) Analysis by Country, 2017-2032

Figure 54: Latin America Loudspeaker Subwoofer Market Volume (000 Units) Analysis by Country, 2017-2032

Figure 55: Latin America Loudspeaker Subwoofer Market Value Share (%) and BPS Analysis by Country, 2022-2032

Figure 56: Latin America Loudspeaker Subwoofer Market Y-o-Y Growth (%) Projections by Country, 2022-2032

Figure 57: Latin America Loudspeaker Subwoofer Market Value (US$ Mn) Analysis by Type, 2017-2032

Figure 58: Latin America Loudspeaker Subwoofer Market Volume (000 Units) Analysis by Type, 2017-2032

Figure 59: Latin America Loudspeaker Subwoofer Market Value Share (%) and BPS Analysis by Type, 2022-2032

Figure 60: Latin America Loudspeaker Subwoofer Market Y-o-Y Growth (%) Projections by Type, 2022-2032

Figure 61: Latin America Loudspeaker Subwoofer Market Value (US$ Mn) Analysis by Connectivity Type, 2017-2032

Figure 62: Latin America Loudspeaker Subwoofer Market Volume (000 Units) Analysis by Connectivity Type, 2017-2032

Figure 63: Latin America Loudspeaker Subwoofer Market Value Share (%) and BPS Analysis by Connectivity Type, 2022-2032

Figure 64: Latin America Loudspeaker Subwoofer Market Y-o-Y Growth (%) Projections by Connectivity Type, 2022-2032

Figure 65: Latin America Loudspeaker Subwoofer Market Value (US$ Mn) Analysis by Application, 2017-2032

Figure 66: Latin America Loudspeaker Subwoofer Market Volume (000 Units) Analysis by Application, 2017-2032

Figure 67: Latin America Loudspeaker Subwoofer Market Value Share (%) and BPS Analysis by Application, 2022-2032

Figure 68: Latin America Loudspeaker Subwoofer Market Y-o-Y Growth (%) Projections by Application, 2022-2032

Figure 69: Latin America Loudspeaker Subwoofer Market Attractiveness by Type, 2022-2032

Figure 70: Latin America Loudspeaker Subwoofer Market Attractiveness by Connectivity Type, 2022-2032

Figure 71: Latin America Loudspeaker Subwoofer Market Attractiveness by Application, 2022-2032

Figure 72: Latin America Loudspeaker Subwoofer Market Attractiveness by Country, 2022-2032

Figure 73: Europe Loudspeaker Subwoofer Market Value (US$ Mn) by Type, 2022-2032

Figure 74: Europe Loudspeaker Subwoofer Market Value (US$ Mn) by Connectivity Type, 2022-2032

Figure 75: Europe Loudspeaker Subwoofer Market Value (US$ Mn) by Application, 2022-2032

Figure 76: Europe Loudspeaker Subwoofer Market Value (US$ Mn) by Country, 2022-2032

Figure 77: Europe Loudspeaker Subwoofer Market Value (US$ Mn) Analysis by Country, 2017-2032

Figure 78: Europe Loudspeaker Subwoofer Market Volume (000 Units) Analysis by Country, 2017-2032

Figure 79: Europe Loudspeaker Subwoofer Market Value Share (%) and BPS Analysis by Country, 2022-2032

Figure 80: Europe Loudspeaker Subwoofer Market Y-o-Y Growth (%) Projections by Country, 2022-2032

Figure 81: Europe Loudspeaker Subwoofer Market Value (US$ Mn) Analysis by Type, 2017-2032

Figure 82: Europe Loudspeaker Subwoofer Market Volume (000 Units) Analysis by Type, 2017-2032

Figure 83: Europe Loudspeaker Subwoofer Market Value Share (%) and BPS Analysis by Type, 2022-2032

Figure 84: Europe Loudspeaker Subwoofer Market Y-o-Y Growth (%) Projections by Type, 2022-2032

Figure 85: Europe Loudspeaker Subwoofer Market Value (US$ Mn) Analysis by Connectivity Type, 2017-2032

Figure 86: Europe Loudspeaker Subwoofer Market Volume (000 Units) Analysis by Connectivity Type, 2017-2032

Figure 87: Europe Loudspeaker Subwoofer Market Value Share (%) and BPS Analysis by Connectivity Type, 2022-2032

Figure 88: Europe Loudspeaker Subwoofer Market Y-o-Y Growth (%) Projections by Connectivity Type, 2022-2032

Figure 89: Europe Loudspeaker Subwoofer Market Value (US$ Mn) Analysis by Application, 2017-2032

Figure 90: Europe Loudspeaker Subwoofer Market Volume (000 Units) Analysis by Application, 2017-2032

Figure 91: Europe Loudspeaker Subwoofer Market Value Share (%) and BPS Analysis by Application, 2022-2032

Figure 92: Europe Loudspeaker Subwoofer Market Y-o-Y Growth (%) Projections by Application, 2022-2032

Figure 93: Europe Loudspeaker Subwoofer Market Attractiveness by Type, 2022-2032

Figure 94: Europe Loudspeaker Subwoofer Market Attractiveness by Connectivity Type, 2022-2032

Figure 95: Europe Loudspeaker Subwoofer Market Attractiveness by Application, 2022-2032

Figure 96: Europe Loudspeaker Subwoofer Market Attractiveness by Country, 2022-2032

Figure 97: East Asia Loudspeaker Subwoofer Market Value (US$ Mn) by Type, 2022-2032

Figure 98: East Asia Loudspeaker Subwoofer Market Value (US$ Mn) by Connectivity Type, 2022-2032

Figure 99: East Asia Loudspeaker Subwoofer Market Value (US$ Mn) by Application, 2022-2032

Figure 100: East Asia Loudspeaker Subwoofer Market Value (US$ Mn) by Country, 2022-2032

Figure 101: East Asia Loudspeaker Subwoofer Market Value (US$ Mn) Analysis by Country, 2017-2032

Figure 102: East Asia Loudspeaker Subwoofer Market Volume (000 Units) Analysis by Country, 2017-2032

Figure 103: East Asia Loudspeaker Subwoofer Market Value Share (%) and BPS Analysis by Country, 2022-2032

Figure 104: East Asia Loudspeaker Subwoofer Market Y-o-Y Growth (%) Projections by Country, 2022-2032

Figure 105: East Asia Loudspeaker Subwoofer Market Value (US$ Mn) Analysis by Type, 2017-2032

Figure 106: East Asia Loudspeaker Subwoofer Market Volume (000 Units) Analysis by Type, 2017-2032

Figure 107: East Asia Loudspeaker Subwoofer Market Value Share (%) and BPS Analysis by Type, 2022-2032

Figure 108: East Asia Loudspeaker Subwoofer Market Y-o-Y Growth (%) Projections by Type, 2022-2032

Figure 109: East Asia Loudspeaker Subwoofer Market Value (US$ Mn) Analysis by Connectivity Type, 2017-2032

Figure 110: East Asia Loudspeaker Subwoofer Market Volume (000 Units) Analysis by Connectivity Type, 2017-2032

Figure 111: East Asia Loudspeaker Subwoofer Market Value Share (%) and BPS Analysis by Connectivity Type, 2022-2032

Figure 112: East Asia Loudspeaker Subwoofer Market Y-o-Y Growth (%) Projections by Connectivity Type, 2022-2032

Figure 113: East Asia Loudspeaker Subwoofer Market Value (US$ Mn) Analysis by Application, 2017-2032

Figure 114: East Asia Loudspeaker Subwoofer Market Volume (000 Units) Analysis by Application, 2017-2032

Figure 115: East Asia Loudspeaker Subwoofer Market Value Share (%) and BPS Analysis by Application, 2022-2032

Figure 116: East Asia Loudspeaker Subwoofer Market Y-o-Y Growth (%) Projections by Application, 2022-2032

Figure 117: East Asia Loudspeaker Subwoofer Market Attractiveness by Type, 2022-2032

Figure 118: East Asia Loudspeaker Subwoofer Market Attractiveness by Connectivity Type, 2022-2032

Figure 119: East Asia Loudspeaker Subwoofer Market Attractiveness by Application, 2022-2032

Figure 120: East Asia Loudspeaker Subwoofer Market Attractiveness by Country, 2022-2032

Figure 121: South Asia & Pacific Loudspeaker Subwoofer Market Value (US$ Mn) by Type, 2022-2032

Figure 122: South Asia & Pacific Loudspeaker Subwoofer Market Value (US$ Mn) by Connectivity Type, 2022-2032

Figure 123: South Asia & Pacific Loudspeaker Subwoofer Market Value (US$ Mn) by Application, 2022-2032

Figure 124: South Asia & Pacific Loudspeaker Subwoofer Market Value (US$ Mn) by Country, 2022-2032

Figure 125: South Asia & Pacific Loudspeaker Subwoofer Market Value (US$ Mn) Analysis by Country, 2017-2032

Figure 126: South Asia & Pacific Loudspeaker Subwoofer Market Volume (000 Units) Analysis by Country, 2017-2032

Figure 127: South Asia & Pacific Loudspeaker Subwoofer Market Value Share (%) and BPS Analysis by Country, 2022-2032

Figure 128: South Asia & Pacific Loudspeaker Subwoofer Market Y-o-Y Growth (%) Projections by Country, 2022-2032

Figure 129: South Asia & Pacific Loudspeaker Subwoofer Market Value (US$ Mn) Analysis by Type, 2017-2032

Figure 130: South Asia & Pacific Loudspeaker Subwoofer Market Volume (000 Units) Analysis by Type, 2017-2032

Figure 131: South Asia & Pacific Loudspeaker Subwoofer Market Value Share (%) and BPS Analysis by Type, 2022-2032

Figure 132: South Asia & Pacific Loudspeaker Subwoofer Market Y-o-Y Growth (%) Projections by Type, 2022-2032

Figure 133: South Asia & Pacific Loudspeaker Subwoofer Market Value (US$ Mn) Analysis by Connectivity Type, 2017-2032

Figure 134: South Asia & Pacific Loudspeaker Subwoofer Market Volume (000 Units) Analysis by Connectivity Type, 2017-2032

Figure 135: South Asia & Pacific Loudspeaker Subwoofer Market Value Share (%) and BPS Analysis by Connectivity Type, 2022-2032

Figure 136: South Asia & Pacific Loudspeaker Subwoofer Market Y-o-Y Growth (%) Projections by Connectivity Type, 2022-2032

Figure 137: South Asia & Pacific Loudspeaker Subwoofer Market Value (US$ Mn) Analysis by Application, 2017-2032

Figure 138: South Asia & Pacific Loudspeaker Subwoofer Market Volume (000 Units) Analysis by Application, 2017-2032

Figure 139: South Asia & Pacific Loudspeaker Subwoofer Market Value Share (%) and BPS Analysis by Application, 2022-2032

Figure 140: South Asia & Pacific Loudspeaker Subwoofer Market Y-o-Y Growth (%) Projections by Application, 2022-2032

Figure 141: South Asia & Pacific Loudspeaker Subwoofer Market Attractiveness by Type, 2022-2032

Figure 142: South Asia & Pacific Loudspeaker Subwoofer Market Attractiveness by Connectivity Type, 2022-2032

Figure 143: South Asia & Pacific Loudspeaker Subwoofer Market Attractiveness by Application, 2022-2032

Figure 144: South Asia & Pacific Loudspeaker Subwoofer Market Attractiveness by Country, 2022-2032

Figure 145: MEA Loudspeaker Subwoofer Market Value (US$ Mn) by Type, 2022-2032

Figure 146: MEA Loudspeaker Subwoofer Market Value (US$ Mn) by Connectivity Type, 2022-2032

Figure 147: MEA Loudspeaker Subwoofer Market Value (US$ Mn) by Application, 2022-2032

Figure 148: MEA Loudspeaker Subwoofer Market Value (US$ Mn) by Country, 2022-2032

Figure 149: MEA Loudspeaker Subwoofer Market Value (US$ Mn) Analysis by Country, 2017-2032

Figure 150: MEA Loudspeaker Subwoofer Market Volume (000 Units) Analysis by Country, 2017-2032

Figure 151: MEA Loudspeaker Subwoofer Market Value Share (%) and BPS Analysis by Country, 2022-2032

Figure 152: MEA Loudspeaker Subwoofer Market Y-o-Y Growth (%) Projections by Country, 2022-2032

Figure 153: MEA Loudspeaker Subwoofer Market Value (US$ Mn) Analysis by Type, 2017-2032

Figure 154: MEA Loudspeaker Subwoofer Market Volume (000 Units) Analysis by Type, 2017-2032

Figure 155: MEA Loudspeaker Subwoofer Market Value Share (%) and BPS Analysis by Type, 2022-2032

Figure 156: MEA Loudspeaker Subwoofer Market Y-o-Y Growth (%) Projections by Type, 2022-2032

Figure 157: MEA Loudspeaker Subwoofer Market Value (US$ Mn) Analysis by Connectivity Type, 2017-2032

Figure 158: MEA Loudspeaker Subwoofer Market Volume (000 Units) Analysis by Connectivity Type, 2017-2032

Figure 159: MEA Loudspeaker Subwoofer Market Value Share (%) and BPS Analysis by Connectivity Type, 2022-2032

Figure 160: MEA Loudspeaker Subwoofer Market Y-o-Y Growth (%) Projections by Connectivity Type, 2022-2032

Figure 161: MEA Loudspeaker Subwoofer Market Value (US$ Mn) Analysis by Application, 2017-2032

Figure 162: MEA Loudspeaker Subwoofer Market Volume (000 Units) Analysis by Application, 2017-2032

Figure 163: MEA Loudspeaker Subwoofer Market Value Share (%) and BPS Analysis by Application, 2022-2032

Figure 164: MEA Loudspeaker Subwoofer Market Y-o-Y Growth (%) Projections by Application, 2022-2032

Figure 165: MEA Loudspeaker Subwoofer Market Attractiveness by Type, 2022-2032

Figure 166: MEA Loudspeaker Subwoofer Market Attractiveness by Connectivity Type, 2022-2032

Figure 167: MEA Loudspeaker Subwoofer Market Attractiveness by Application, 2022-2032

Figure 168: MEA Loudspeaker Subwoofer Market Attractiveness by Country, 2022-2032

Recommendations

Technology

Loudspeaker Market

Published : October 2022

Explore Technology Insights

View Reports

Loudspeaker Subwoofer Market