Worldwide NIP (navigation, imaging, and positioning) Solutions Market: In 2025 to 2035, it will be a high-flying market due to increasing demand for precision technology in defense, autonomous vehicles, healthcare diagnostics, agriculture, and geospatial intelligence.
NIP systems including everything from GPS modules to inertial navigation systems to high-resolution imaging sensors and LiDAR tech are critical for automation, surveillance, and decision-support applications.
NIP ecosystem i.e. AI, satellite communication and cloud-based geolocation services are converging and reinventing it. The supposed acceleration in adoption is attributed to demand for high-accuracy real-time data on verticals including smart cities and aerospace and maritime operations.
This is expected to reach Approximately USD 121,310.4 Million by 2035, growing at an approximate CAGR of 26.8% CAGR from 2025, when the global NIP solutions market was value at approx. USD 11,290.3 Million.
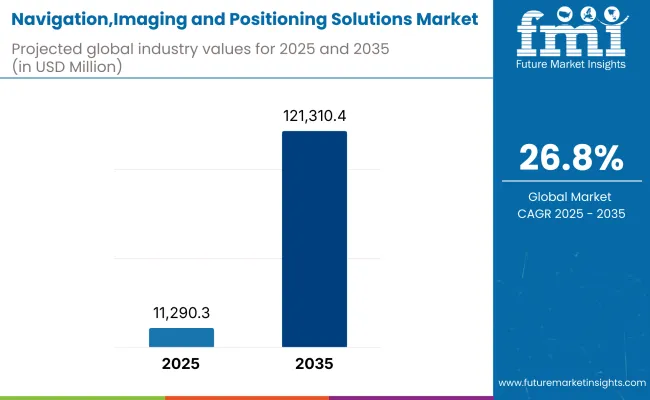
Key Market Metrics
Metric | Value |
---|---|
Market Size in 2025 | USD 11,290.3 Million |
Projected Market Size in 2035 | USD 121,310.4 Million |
CAGR (2025 to 2035) | 26.8% |
The global navigation, imaging and positioning solutions are witnessing growth due to demand from the industries world over looking to meet the needs for accurate geolocation, spatial orientation, and environmental visualisation tools. These systems play a critical role in defence, aerospace, maritime and geospatial analysis sectors.
Defense and inertial navigation technologies account for a sizable portion of the overall share by application and operating principle across key regions with unmatched reliability in GPS-denied environments, mission-critical use cases, and advanced fusion integration with autonomous systems These segments enable rich, seamless navigation, real-time mapping, and precision targeting in complex operational environments.
Global Investment Sector for High-technology and Defense: Government agencies and armed forces are investing across next-generation inertial systems, AI-integrated imaging modules, and multi-sensor positioning units to enhance situational awareness, operational resilience, and strategic precision under an adversarial footprint while contending with GNSS denial and degradation conditions.
Inertial navigation gains traction due to GPS independence, high-resolution trajectory tracking, and rugged performance
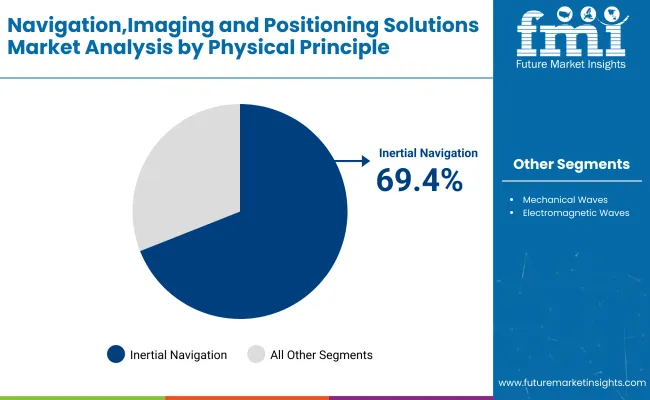
Physical Principle | Market Share (2025) |
---|---|
Inertial Navigation | 69.4% |
The increasing adoption of inertial navigation over GPS because of advancements in sensor technologies (such as microelectromechanical systems (MEMS) and fiber optics) and superior positioning accuracy and data accessibility when compared to GPS is expected to drive the growth of this segment. These systems use accelerometers and gyroscopes to measure motion and rotation to determine orientation, velocity, and position.
This means that defense contractors and OEMs harness inertial navigation in the guidance of missiles and controlled special vehicles such as fighters, submarines, and operator-free land transportation means to assure intact navigation in areas where the GPS, jamming, or ground operation is difficult. Its insensitivity to weather and electromagnetic interference makes the technology essential for high-stakes missions.
Recent advancements in inertial navigation systems with low drift rates by the likes of fiber-optic gyroscopes (FOG) and ring laser gyroscopes (RLG) provide profiles for long-span autonomy operations and high precision targeting. These features also enable increasing use in UAVs, hypersonic systems, and smart munitions.
More recently, mechanical wave systems have emerged as potential measuring solutions in seismic and geophysical contexts, but inertial navigation remains the preferred solution in mission-critical defense and aerospace applications demanding real-time,jam-proof operation and autonomous orientation.
Defense drives market use through autonomous warfare systems, strategic mobility, and high-reliability demand
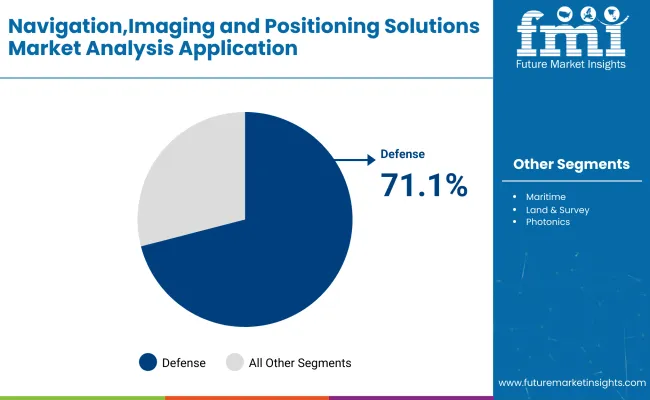
Application | Market Share (2025) |
---|---|
Defense | 71.1% |
As real-time spatial intelligence, autonomous system navigation, and strategic asset tracking remain requirements in the defense sector, navigation, imaging and positioning solutions serve as the largest end-user for this vertical. These solutions ranging from precision-guided munitions and ISR (Intelligence, Surveillance, Reconnaissance) platforms to military drones and armored vehicles sit at the heart of tactical decision-making and battlefield dominance.
Ruggedized navigation and imaging platforms are crucial to enabling armed forces to maintain operational superiority in GPS-denied, underwater, and remote environments. Improved situational awareness along with targeting precision and data fusion capabilities also complement command-and-control systems, threat detection, and geospatial mission planning.
R&D in hybrid sensor integration, AI-enhanced imaging and SWaP-optimized (size, weight and power) inertial platforms will be necessary to create mobility in denied environments as well, helping to extend the reach of defense applications. Despite ongoing geopolitical tensions, demand for advanced navigation and positioning technologies remains strong due to increased investment in autonomous defense systems.
Defense emerges as the leading application segment, driven by stringent performance requirements, the backing of funding initiatives, and a broadening range of autonomous warfare environments, even as maritime, space, and photonics applications shape the larger ecosystem.
The North American region dominates the NIP market owing to strong investments in defense modernization, autonomous vehicles testing, and smart infrastructure. The USA serves as a global leader for satellite-based navigation and real-time kinematic (RTK) positioning systems, with R&D energized by government agencies such as NASA and the Department of Defense. The region also has high adoption in medical imaging, drone-based surveying, and precision tools for agriculture.
Advancements in high-resolution positioning and imaging in Europe are being driven through initiatives such as the European Union’s Galileo GNSS and Copernicus Earth observation programs. Various countries (Germany, France, and Italy) are gaining advantages from NIP technologies in intelligent transport systems, disaster management, and industrial automation. It is the EU drive for autonomous mobility and environmental monitoring that is prompting innovation in integrated NIP platforms.
Asia-Pacific, the fastest-growing region due to increasing investments in defense technology, smart cities and agricultural modernization. With regards to regional self-sufficiency in satellite positioning, we now have China’s BeiDou Navigation Satellite System (BDS), India’s NAVIC, and Japan’s QZSS. It is also a big user of drone mapping, robotic surgery and AI-enhanced geospatial intelligence in the region.
Signal reliability, data privacy, and integration complexity hinder seamless deployment.
NIP systems are also heavily reliant on uninterrupted satellite or signal transmission, which may be interrupted in urban canyons, underwater environments, or during cyberattacks. This poses a significant challenge in redundancy and signal integrity crucial to mission-critical settings such as military navigation and autonomous driving.
In addition, there are growing global concerns about location-based tracking, facial recognition and high-resolution surveillance imaging. The integration of heterogeneous hardware and software systems most prominently, geospatial, medical, and industrial systems requires strong middleware and cybersecurity protocols. Interoperability is also complicated by regulatory differences between countries.
Autonomy, climate resilience, and precision analytics create transformative growth avenues.
NIP solutions are crucial for autonomous mobility think autonomous vehicles and drone deliveries because they provide centimeter-level accuracy and real-time decision making. In agriculture, precision positioning experience is helping to optimize yields and water usage with multispectral imaging. In healthcare, high-end imaging tech allows for non-invasive diagnosis and robotic surgeries.
So does climate resilience and disaster mitigation, which satellite imaging and remote sensing data can help with as well. These tools are being utilized by governments and NGOs for flood prediction, deforestation tracking, and emergency response planning.Cloud-native geospatial platforms, AI-powered analytics, and compact multi-sensor payloads will drive adoption at greater scales across civilian and commercial sectors.
The market will expand, driven by the advanced use of remote diagnostics amid the pandemic-hindered environment and increased defense surveillance budgets and defense redevelopment programs, the growing use of drones in logistics and agriculture, and alternative real estate. However, component shortages and geopolitical tensions broke supply chains for sensor chips and satellite systems citation needed .
The NIP market will transition in 2025 and beyond to interoperable, AI-enhanced next-generation platforms that deliver higher-resolution data more frequently. The convergence of quantum sensors, 5G/6G communications and edge computing will redefine what responsiveness and autonomy is. In dynamic environments requiring advanced navigation and mapping capabilities, imaging manufacturers, cloud platform providers, and, AI firms will form cross sectoral partnerships to provide full stack solutions.
Market Shifts: A Comparative Analysis 2020 to 2024 vs. 2025 to 2035
Market Shift | 2020 to 2024 Trends |
---|---|
Regulatory Landscape | Satellite data access and basic imaging export controls |
Consumer Trends | Growth in drones, AR navigation, and wearable imaging |
Industry Adoption | High in defense, logistics, and medical imaging |
Supply Chain and Sourcing | Reliance on USA and EU sensor tech |
Market Competition | Led by defense contractors and tech conglomerates |
Market Growth Drivers | Surveillance, safety, and pandemic-era remote diagnostics |
Sustainability and Impact | Remote monitoring for compliance and conservation |
Smart Technology Integration | GPS/GNSS mapping and sensor fusion |
Sensorial Innovation | Visual, IR, and LiDAR-based imaging systems |
Market Shift | 2025 to 2035 Projections |
---|---|
Regulatory Landscape | AI-driven geolocation policies, global data sharing frameworks |
Consumer Trends | Surge in autonomous mobility, 3D city mapping, and telehealth imaging |
Industry Adoption | Expanding into infrastructure, climate modeling, and retail analytics |
Supply Chain and Sourcing | Regional diversification and custom hardware ecosystems |
Market Competition | Entry of AI startups, Earth observation platforms, and med-tech integrators |
Market Growth Drivers | Autonomy, climate intelligence, and smart infrastructure investments |
Sustainability and Impact | Precision farming, carbon tracking, and resource-efficient logistics |
Smart Technology Integration | Real-time edge AI, spatial analytics, and predictive navigation |
Sensorial Innovation | Quantum sensing, neural imaging, and multi-spectrum fusion |
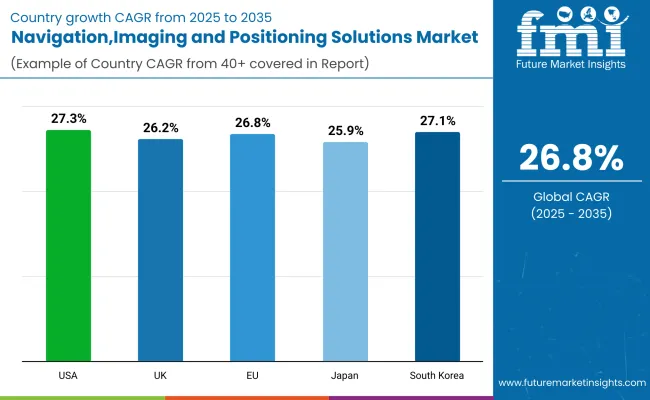
Innovation in Autonomous Vehicles, Aerospace Research and Precision Agriculture is helping to grow the USA Navigation, Imaging and Positioning Solutions market. With the Global Positioning System (GPS) as a key enabler of civilian and military infrastructure, the country is at the forefront of satellite-based navigation technology.
Demand for high-resolution imaging in remote sensing urban planning, and climate monitoring is driving growth. The National Aeronautics and Space Administration (NASA) and commercial firms are also pushing the frontiers of AI-empowered geospatial imaging and 3D mapping. Centimeter-level accuracy RTK based positioning systems are increasingly being adopted across logistics, mining and construction sectors.
Country | CAGR (2025 to 2035) |
---|---|
United States | 27.3% |
Navigation and imaging solutions are making inroads in marine surveillance, autonomous transportation and disaster response mapping in the UK The Space Agency and geospatial firms are working to develop alternative navigation systems to lessen the reliance of UK users on GPS following Brexit.
Flood risk assessment, smart city infrastructure, and precision farming have all used remote imaging technologies Applications for AI with satellite and drone-based imaging for real-time monitoring of traffic management and environmental compliance. So also startups when it comes to developing indoor positioning systems for industrial automation or logistics.
Country | CAGR (2025 to 2035) |
---|---|
United Kingdom | 26.2% |
The EU is enhancing its navigation and imaging capabilities using the Galileo satellite system, providing worldwide high-accuracy positioning for civilian applications. States like Germany, France and Italy are using Galileo, Copernicus and EGNOS programs for secure location in time and space, monitoring the environment and responding to crises.
If you would like more information about how to join us on this R&D funding journey, or about the areas we are focusing on under Horizon Europe (hyperspectral imaging, real-time geospatial intelligence, live monitoring and autonomous mobility systems) please contact us. Precision imaging for plant health and soil diagnostics are being deployed in the agricultural sector, and navigation tech is being scaled in logistics to enable last-mile efficiencies.
Country | CAGR (2025 to 2035) |
---|---|
European Union | 26.8% |
Japan's QZSS (Quasi-Zenith Satellite System) increases the regional accuracy and availability of GPS and thus supports Japan's market source: UN. Navigation and imaging technologies have also seen applications in disaster prevention, robotics, and self-driving cars.
We can use them for urban development, environmental monitoring, and infrastructure health diagnostics which are a few applications of high-resolution imaging satellites. There are also Japanese firms pouring in investments in AI-assisted 3D modeling and indoor mapping for smart buildings. The Ministry of Land, Infrastructure, Transport and Tourism encourages use of GNSS-based systems in such as public works, logistics, and disaster response.
Country | CAGR (2025 to 2035) |
---|---|
Japan | 25.9% |
South Korea's navigation, imaging, and positioning solutions market is progressing by investing in 5G-enabled geolocation systems and autonomous urban transport. To establish the internal infrastructure within Korea that reduces the heavy reliance on navigation systems from abroad, the government has a Korean Positioning System (KPS) in the works.
Intelligent cities such as Seoul and Incheon are testing out real-time mapping technology for a variety of uses, including traffic control, public safety and drone logistics. Indoor navigation is also being researched for robotics and augmented reality in startups and universities. High-resolution geospatial imaging: Applications to environmental and land-use planning
Country | CAGR (2025 to 2035) |
---|---|
South Korea | 27.1% |
The market for navigation, imaging, and positioning solutions has been growing because of increasing demand from various sectors like autonomous vehicles, precision agriculture, geospatial analytics, defense, building, and mobile robotics. Innovations across industries are spurred by advancements in satellite navigation (GNSS), real-time kinematic positioning (RTK), LiDAR, photogrammetry and AI-integrated imaging systems.
The convergence of location intelligence (itself already supported by the significant successful investments across infrastructure, environmental monitoring and smart transportation projects globally) with high-accuracy sensing and visual processing means the market is seeing upgraded drivers. Adoption is further propelled by regulatory frameworks that favour autonomous navigation and industrial digitalization.
Market Share Analysis by Key Players & Navigation, Imaging, and Positioning Solution Providers
Company Name | Estimated Market Share (%) |
---|---|
Trimble Inc. | 14-17% |
Leica Geosystems (Hexagon AB) | 11-14% |
Topcon Corporation | 9-12% |
Garmin Ltd. | 7-10% |
Thales Group | 6-9% |
Other Providers | 38-45% |
Company Name | Key Offerings/Activities |
---|---|
Trimble Inc. | In 2024, released AI-enhanced positioning modules for autonomous construction vehicles; in 2025, launched integrated LiDAR-GNSS systems for forestry and land surveying. |
Leica Geosystems (Hexagon AB) | In 2024, introduced 3D mobile mapping systems for smart city infrastructure audits; in 2025, expanded into UAV-based imaging with sub-centimeter accuracy. |
Topcon Corporation | In 2024, upgraded its RTK GNSS systems for smart farming; in 2025, partnered with satellite providers to enable global PPP corrections for centimeter-level precision. |
Garmin Ltd. | In 2024, launched wearable-integrated positioning solutions for emergency response; in 2025, introduced marine navigation systems with enhanced sonar-imaging overlay. |
Thales Group | In 2024, developed quantum-tolerant navigation systems for defense and aviation; in 2025, deployed space-grade GNSS augmentation receivers for aerospace fleets. |
Key Market Insights
Trimble Inc. (17%)
Trimble leads 14-the market through its integration of positioning, mapping, and sensor systems for construction, agriculture, and infrastructure. In 2024, the company introduced AI-enabled GNSS modules tailored for autonomous heavy equipment, improving productivity in remote terrain.
By 2025, Trimble launched a combined LiDAR-GNSS solution for forestry and land management, offering real-time canopy mapping and terrain classification. Its alignment with precision land use goals supports sustainable development strategies worldwide.
Leica Geosystems (Hexagon AB) (11-14%)
Leica Geosystems continues to push boundaries in imaging and reality capture technologies. In 2024, it unveiled mobile mapping systems for city infrastructure, enabling 3D visualization of urban assets and utilities. In 2025, it expanded its UAV-based imaging portfolio with ultra-light drones equipped with photogrammetric and LiDAR modules. Leica’s solutions align with smart city and green infrastructure initiatives under global climate resilience programs.
Topcon Corporation (9-12%)
Topcon is a major force in GNSS and precision agriculture solutions. In 2024, it launched next-gen RTK GNSS modules for autonomous tractors and drones. In 2025, it partnered with satellite constellations to provide global Precise Point Positioning (PPP) services, delivering sub-centimeter accuracy in real time. Topcon’s commitment to agricultural productivity and land use efficiency supports food security initiatives globally.
Garmin Ltd. (7-10%)
Garmin excels in user-facing navigation and wearable-integrated positioning technologies. In 2024, it introduced a line of wearable devices for emergency services, providing live GNSS tracking and fall detection. In 2025, it upgraded marine navigation systems with sonar-enhanced imaging overlays, used in fishing, maritime security, and recreational boating. Garmin supports disaster preparedness, coastal monitoring, and recreational safety through intuitive, high-reliability systems.
Thales Group (6-9%)
Thales delivers secure navigation systems to defense, aerospace, and critical infrastructure sectors. In 2024, it launched quantum-tolerant navigation systems designed to withstand GNSS spoofing and jamming, enhancing reliability for aviation and defense logistics. In 2025, Thales deployed augmented GNSS receivers aboard commercial and defense satellites to strengthen position accuracy for transcontinental operations. These technologies align with space governance and air traffic modernization efforts .
Other Key Players (38-45% Combined)
A wide array of imaging, positioning, and geospatial companies are contributing niche technologies and region-specific solutions. These include:
Table 1: Global Navigation, Imaging and Positioning Solutions Market Value (US$ Mn) Forecast by Region, 2017-2032
Table 2: Global Navigation, Imaging and Positioning Solutions Market Volume (Units) Forecast by Region, 2017-2032
Table 3: Global Navigation, Imaging and Positioning Solutions Market Value (US$ Mn) Forecast by Component, 2017-2032
Table 4: Global Navigation, Imaging and Positioning Solutions Market Volume (Units) Forecast by Component, 2017-2032
Table 5: Global Navigation, Imaging and Positioning Solutions Market Value (US$ Mn) Forecast by Technology, 2017-2032
Table 6: Global Navigation, Imaging and Positioning Solutions Market Volume (Units) Forecast by Technology, 2017-2032
Table 7: Global Navigation, Imaging and Positioning Solutions Market Value (US$ Mn) Forecast by Application, 2017-2032
Table 8: Global Navigation, Imaging and Positioning Solutions Market Volume (Units) Forecast by Application, 2017-2032
Table 9: North America Navigation, Imaging and Positioning Solutions Market Value (US$ Mn) Forecast by Country, 2017-2032
Table 10: North America Navigation, Imaging and Positioning Solutions Market Volume (Units) Forecast by Country, 2017-2032
Table 11: North America Navigation, Imaging and Positioning Solutions Market Value (US$ Mn) Forecast by Component, 2017-2032
Table 12: North America Navigation, Imaging and Positioning Solutions Market Volume (Units) Forecast by Component, 2017-2032
Table 13: North America Navigation, Imaging and Positioning Solutions Market Value (US$ Mn) Forecast by Technology, 2017-2032
Table 14: North America Navigation, Imaging and Positioning Solutions Market Volume (Units) Forecast by Technology, 2017-2032
Table 15: North America Navigation, Imaging and Positioning Solutions Market Value (US$ Mn) Forecast by Application, 2017-2032
Table 16: North America Navigation, Imaging and Positioning Solutions Market Volume (Units) Forecast by Application, 2017-2032
Table 17: Latin America Navigation, Imaging and Positioning Solutions Market Value (US$ Mn) Forecast by Country, 2017-2032
Table 18: Latin America Navigation, Imaging and Positioning Solutions Market Volume (Units) Forecast by Country, 2017-2032
Table 19: Latin America Navigation, Imaging and Positioning Solutions Market Value (US$ Mn) Forecast by Component, 2017-2032
Table 20: Latin America Navigation, Imaging and Positioning Solutions Market Volume (Units) Forecast by Component, 2017-2032
Table 21: Latin America Navigation, Imaging and Positioning Solutions Market Value (US$ Mn) Forecast by Technology, 2017-2032
Table 22: Latin America Navigation, Imaging and Positioning Solutions Market Volume (Units) Forecast by Technology, 2017-2032
Table 23: Latin America Navigation, Imaging and Positioning Solutions Market Value (US$ Mn) Forecast by Application, 2017-2032
Table 24: Latin America Navigation, Imaging and Positioning Solutions Market Volume (Units) Forecast by Application, 2017-2032
Table 25: Europe Navigation, Imaging and Positioning Solutions Market Value (US$ Mn) Forecast by Country, 2017-2032
Table 26: Europe Navigation, Imaging and Positioning Solutions Market Volume (Units) Forecast by Country, 2017-2032
Table 27: Europe Navigation, Imaging and Positioning Solutions Market Value (US$ Mn) Forecast by Component, 2017-2032
Table 28: Europe Navigation, Imaging and Positioning Solutions Market Volume (Units) Forecast by Component, 2017-2032
Table 29: Europe Navigation, Imaging and Positioning Solutions Market Value (US$ Mn) Forecast by Technology, 2017-2032
Table 30: Europe Navigation, Imaging and Positioning Solutions Market Volume (Units) Forecast by Technology, 2017-2032
Table 31: Europe Navigation, Imaging and Positioning Solutions Market Value (US$ Mn) Forecast by Application, 2017-2032
Table 32: Europe Navigation, Imaging and Positioning Solutions Market Volume (Units) Forecast by Application, 2017-2032
Table 33: East Asia Navigation, Imaging and Positioning Solutions Market Value (US$ Mn) Forecast by Country, 2017-2032
Table 34: East Asia Navigation, Imaging and Positioning Solutions Market Volume (Units) Forecast by Country, 2017-2032
Table 35: East Asia Navigation, Imaging and Positioning Solutions Market Value (US$ Mn) Forecast by Component, 2017-2032
Table 36: East Asia Navigation, Imaging and Positioning Solutions Market Volume (Units) Forecast by Component, 2017-2032
Table 37: East Asia Navigation, Imaging and Positioning Solutions Market Value (US$ Mn) Forecast by Technology, 2017-2032
Table 38: East Asia Navigation, Imaging and Positioning Solutions Market Volume (Units) Forecast by Technology, 2017-2032
Table 39: East Asia Navigation, Imaging and Positioning Solutions Market Value (US$ Mn) Forecast by Application, 2017-2032
Table 40: East Asia Navigation, Imaging and Positioning Solutions Market Volume (Units) Forecast by Application, 2017-2032
Table 41: South Asia & Pacific Navigation, Imaging and Positioning Solutions Market Value (US$ Mn) Forecast by Country, 2017-2032
Table 42: South Asia & Pacific Navigation, Imaging and Positioning Solutions Market Volume (Units) Forecast by Country, 2017-2032
Table 43: South Asia & Pacific Navigation, Imaging and Positioning Solutions Market Value (US$ Mn) Forecast by Component, 2017-2032
Table 44: South Asia & Pacific Navigation, Imaging and Positioning Solutions Market Volume (Units) Forecast by Component, 2017-2032
Table 45: South Asia & Pacific Navigation, Imaging and Positioning Solutions Market Value (US$ Mn) Forecast by Technology, 2017-2032
Table 46: South Asia & Pacific Navigation, Imaging and Positioning Solutions Market Volume (Units) Forecast by Technology, 2017-2032
Table 47: South Asia & Pacific Navigation, Imaging and Positioning Solutions Market Value (US$ Mn) Forecast by Application, 2017-2032
Table 48: South Asia & Pacific Navigation, Imaging and Positioning Solutions Market Volume (Units) Forecast by Application, 2017-2032
Table 49: MEA Navigation, Imaging and Positioning Solutions Market Value (US$ Mn) Forecast by Country, 2017-2032
Table 50: MEA Navigation, Imaging and Positioning Solutions Market Volume (Units) Forecast by Country, 2017-2032
Table 51: MEA Navigation, Imaging and Positioning Solutions Market Value (US$ Mn) Forecast by Component, 2017-2032
Table 52: MEA Navigation, Imaging and Positioning Solutions Market Volume (Units) Forecast by Component, 2017-2032
Table 53: MEA Navigation, Imaging and Positioning Solutions Market Value (US$ Mn) Forecast by Technology, 2017-2032
Table 54: MEA Navigation, Imaging and Positioning Solutions Market Volume (Units) Forecast by Technology, 2017-2032
Table 55: MEA Navigation, Imaging and Positioning Solutions Market Value (US$ Mn) Forecast by Application, 2017-2032
Table 56: MEA Navigation, Imaging and Positioning Solutions Market Volume (Units) Forecast by Application, 2017-2032
Figure 1: Global Navigation, Imaging and Positioning Solutions Market Value (US$ Mn) by Component, 2022-2032
Figure 2: Global Navigation, Imaging and Positioning Solutions Market Value (US$ Mn) by Technology, 2022-2032
Figure 3: Global Navigation, Imaging and Positioning Solutions Market Value (US$ Mn) by Application, 2022-2032
Figure 4: Global Navigation, Imaging and Positioning Solutions Market Value (US$ Mn) by Region, 2022-2032
Figure 5: Global Navigation, Imaging and Positioning Solutions Market Value (US$ Mn) Analysis by Region, 2017-2032
Figure 6: Global Navigation, Imaging and Positioning Solutions Market Volume (Units) Analysis by Region, 2017-2032
Figure 7: Global Navigation, Imaging and Positioning Solutions Market Value Share (%) and BPS Analysis by Region, 2022-2032
Figure 8: Global Navigation, Imaging and Positioning Solutions Market Y-o-Y Growth (%) Projections by Region, 2022-2032
Figure 9: Global Navigation, Imaging and Positioning Solutions Market Value (US$ Mn) Analysis by Component, 2017-2032
Figure 10: Global Navigation, Imaging and Positioning Solutions Market Volume (Units) Analysis by Component, 2017-2032
Figure 11: Global Navigation, Imaging and Positioning Solutions Market Value Share (%) and BPS Analysis by Component, 2022-2032
Figure 12: Global Navigation, Imaging and Positioning Solutions Market Y-o-Y Growth (%) Projections by Component, 2022-2032
Figure 13: Global Navigation, Imaging and Positioning Solutions Market Value (US$ Mn) Analysis by Technology, 2017-2032
Figure 14: Global Navigation, Imaging and Positioning Solutions Market Volume (Units) Analysis by Technology, 2017-2032
Figure 15: Global Navigation, Imaging and Positioning Solutions Market Value Share (%) and BPS Analysis by Technology, 2022-2032
Figure 16: Global Navigation, Imaging and Positioning Solutions Market Y-o-Y Growth (%) Projections by Technology, 2022-2032
Figure 17: Global Navigation, Imaging and Positioning Solutions Market Value (US$ Mn) Analysis by Application, 2017-2032
Figure 18: Global Navigation, Imaging and Positioning Solutions Market Volume (Units) Analysis by Application, 2017-2032
Figure 19: Global Navigation, Imaging and Positioning Solutions Market Value Share (%) and BPS Analysis by Application, 2022-2032
Figure 20: Global Navigation, Imaging and Positioning Solutions Market Y-o-Y Growth (%) Projections by Application, 2022-2032
Figure 21: Global Navigation, Imaging and Positioning Solutions Market Attractiveness by Component, 2022-2032
Figure 22: Global Navigation, Imaging and Positioning Solutions Market Attractiveness by Technology, 2022-2032
Figure 23: Global Navigation, Imaging and Positioning Solutions Market Attractiveness by Application, 2022-2032
Figure 24: Global Navigation, Imaging and Positioning Solutions Market Attractiveness by Region, 2022-2032
Figure 25: North America Navigation, Imaging and Positioning Solutions Market Value (US$ Mn) by Component, 2022-2032
Figure 26: North America Navigation, Imaging and Positioning Solutions Market Value (US$ Mn) by Technology, 2022-2032
Figure 27: North America Navigation, Imaging and Positioning Solutions Market Value (US$ Mn) by Application, 2022-2032
Figure 28: North America Navigation, Imaging and Positioning Solutions Market Value (US$ Mn) by Country, 2022-2032
Figure 29: North America Navigation, Imaging and Positioning Solutions Market Value (US$ Mn) Analysis by Country, 2017-2032
Figure 30: North America Navigation, Imaging and Positioning Solutions Market Volume (Units) Analysis by Country, 2017-2032
Figure 31: North America Navigation, Imaging and Positioning Solutions Market Value Share (%) and BPS Analysis by Country, 2022-2032
Figure 32: North America Navigation, Imaging and Positioning Solutions Market Y-o-Y Growth (%) Projections by Country, 2022-2032
Figure 33: North America Navigation, Imaging and Positioning Solutions Market Value (US$ Mn) Analysis by Component, 2017-2032
Figure 34: North America Navigation, Imaging and Positioning Solutions Market Volume (Units) Analysis by Component, 2017-2032
Figure 35: North America Navigation, Imaging and Positioning Solutions Market Value Share (%) and BPS Analysis by Component, 2022-2032
Figure 36: North America Navigation, Imaging and Positioning Solutions Market Y-o-Y Growth (%) Projections by Component, 2022-2032
Figure 37: North America Navigation, Imaging and Positioning Solutions Market Value (US$ Mn) Analysis by Technology, 2017-2032
Figure 38: North America Navigation, Imaging and Positioning Solutions Market Volume (Units) Analysis by Technology, 2017-2032
Figure 39: North America Navigation, Imaging and Positioning Solutions Market Value Share (%) and BPS Analysis by Technology, 2022-2032
Figure 40: North America Navigation, Imaging and Positioning Solutions Market Y-o-Y Growth (%) Projections by Technology, 2022-2032
Figure 41: North America Navigation, Imaging and Positioning Solutions Market Value (US$ Mn) Analysis by Application, 2017-2032
Figure 42: North America Navigation, Imaging and Positioning Solutions Market Volume (Units) Analysis by Application, 2017-2032
Figure 43: North America Navigation, Imaging and Positioning Solutions Market Value Share (%) and BPS Analysis by Application, 2022-2032
Figure 44: North America Navigation, Imaging and Positioning Solutions Market Y-o-Y Growth (%) Projections by Application, 2022-2032
Figure 45: North America Navigation, Imaging and Positioning Solutions Market Attractiveness by Component, 2022-2032
Figure 46: North America Navigation, Imaging and Positioning Solutions Market Attractiveness by Technology, 2022-2032
Figure 47: North America Navigation, Imaging and Positioning Solutions Market Attractiveness by Application, 2022-2032
Figure 48: North America Navigation, Imaging and Positioning Solutions Market Attractiveness by Country, 2022-2032
Figure 49: Latin America Navigation, Imaging and Positioning Solutions Market Value (US$ Mn) by Component, 2022-2032
Figure 50: Latin America Navigation, Imaging and Positioning Solutions Market Value (US$ Mn) by Technology, 2022-2032
Figure 51: Latin America Navigation, Imaging and Positioning Solutions Market Value (US$ Mn) by Application, 2022-2032
Figure 52: Latin America Navigation, Imaging and Positioning Solutions Market Value (US$ Mn) by Country, 2022-2032
Figure 53: Latin America Navigation, Imaging and Positioning Solutions Market Value (US$ Mn) Analysis by Country, 2017-2032
Figure 54: Latin America Navigation, Imaging and Positioning Solutions Market Volume (Units) Analysis by Country, 2017-2032
Figure 55: Latin America Navigation, Imaging and Positioning Solutions Market Value Share (%) and BPS Analysis by Country, 2022-2032
Figure 56: Latin America Navigation, Imaging and Positioning Solutions Market Y-o-Y Growth (%) Projections by Country, 2022-2032
Figure 57: Latin America Navigation, Imaging and Positioning Solutions Market Value (US$ Mn) Analysis by Component, 2017-2032
Figure 58: Latin America Navigation, Imaging and Positioning Solutions Market Volume (Units) Analysis by Component, 2017-2032
Figure 59: Latin America Navigation, Imaging and Positioning Solutions Market Value Share (%) and BPS Analysis by Component, 2022-2032
Figure 60: Latin America Navigation, Imaging and Positioning Solutions Market Y-o-Y Growth (%) Projections by Component, 2022-2032
Figure 61: Latin America Navigation, Imaging and Positioning Solutions Market Value (US$ Mn) Analysis by Technology, 2017-2032
Figure 62: Latin America Navigation, Imaging and Positioning Solutions Market Volume (Units) Analysis by Technology, 2017-2032
Figure 63: Latin America Navigation, Imaging and Positioning Solutions Market Value Share (%) and BPS Analysis by Technology, 2022-2032
Figure 64: Latin America Navigation, Imaging and Positioning Solutions Market Y-o-Y Growth (%) Projections by Technology, 2022-2032
Figure 65: Latin America Navigation, Imaging and Positioning Solutions Market Value (US$ Mn) Analysis by Application, 2017-2032
Figure 66: Latin America Navigation, Imaging and Positioning Solutions Market Volume (Units) Analysis by Application, 2017-2032
Figure 67: Latin America Navigation, Imaging and Positioning Solutions Market Value Share (%) and BPS Analysis by Application, 2022-2032
Figure 68: Latin America Navigation, Imaging and Positioning Solutions Market Y-o-Y Growth (%) Projections by Application, 2022-2032
Figure 69: Latin America Navigation, Imaging and Positioning Solutions Market Attractiveness by Component, 2022-2032
Figure 70: Latin America Navigation, Imaging and Positioning Solutions Market Attractiveness by Technology, 2022-2032
Figure 71: Latin America Navigation, Imaging and Positioning Solutions Market Attractiveness by Application, 2022-2032
Figure 72: Latin America Navigation, Imaging and Positioning Solutions Market Attractiveness by Country, 2022-2032
Figure 73: Europe Navigation, Imaging and Positioning Solutions Market Value (US$ Mn) by Component, 2022-2032
Figure 74: Europe Navigation, Imaging and Positioning Solutions Market Value (US$ Mn) by Technology, 2022-2032
Figure 75: Europe Navigation, Imaging and Positioning Solutions Market Value (US$ Mn) by Application, 2022-2032
Figure 76: Europe Navigation, Imaging and Positioning Solutions Market Value (US$ Mn) by Country, 2022-2032
Figure 77: Europe Navigation, Imaging and Positioning Solutions Market Value (US$ Mn) Analysis by Country, 2017-2032
Figure 78: Europe Navigation, Imaging and Positioning Solutions Market Volume (Units) Analysis by Country, 2017-2032
Figure 79: Europe Navigation, Imaging and Positioning Solutions Market Value Share (%) and BPS Analysis by Country, 2022-2032
Figure 80: Europe Navigation, Imaging and Positioning Solutions Market Y-o-Y Growth (%) Projections by Country, 2022-2032
Figure 81: Europe Navigation, Imaging and Positioning Solutions Market Value (US$ Mn) Analysis by Component, 2017-2032
Figure 82: Europe Navigation, Imaging and Positioning Solutions Market Volume (Units) Analysis by Component, 2017-2032
Figure 83: Europe Navigation, Imaging and Positioning Solutions Market Value Share (%) and BPS Analysis by Component, 2022-2032
Figure 84: Europe Navigation, Imaging and Positioning Solutions Market Y-o-Y Growth (%) Projections by Component, 2022-2032
Figure 85: Europe Navigation, Imaging and Positioning Solutions Market Value (US$ Mn) Analysis by Technology, 2017-2032
Figure 86: Europe Navigation, Imaging and Positioning Solutions Market Volume (Units) Analysis by Technology, 2017-2032
Figure 87: Europe Navigation, Imaging and Positioning Solutions Market Value Share (%) and BPS Analysis by Technology, 2022-2032
Figure 88: Europe Navigation, Imaging and Positioning Solutions Market Y-o-Y Growth (%) Projections by Technology, 2022-2032
Figure 89: Europe Navigation, Imaging and Positioning Solutions Market Value (US$ Mn) Analysis by Application, 2017-2032
Figure 90: Europe Navigation, Imaging and Positioning Solutions Market Volume (Units) Analysis by Application, 2017-2032
Figure 91: Europe Navigation, Imaging and Positioning Solutions Market Value Share (%) and BPS Analysis by Application, 2022-2032
Figure 92: Europe Navigation, Imaging and Positioning Solutions Market Y-o-Y Growth (%) Projections by Application, 2022-2032
Figure 93: Europe Navigation, Imaging and Positioning Solutions Market Attractiveness by Component, 2022-2032
Figure 94: Europe Navigation, Imaging and Positioning Solutions Market Attractiveness by Technology, 2022-2032
Figure 95: Europe Navigation, Imaging and Positioning Solutions Market Attractiveness by Application, 2022-2032
Figure 96: Europe Navigation, Imaging and Positioning Solutions Market Attractiveness by Country, 2022-2032
Figure 97: East Asia Navigation, Imaging and Positioning Solutions Market Value (US$ Mn) by Component, 2022-2032
Figure 98: East Asia Navigation, Imaging and Positioning Solutions Market Value (US$ Mn) by Technology, 2022-2032
Figure 99: East Asia Navigation, Imaging and Positioning Solutions Market Value (US$ Mn) by Application, 2022-2032
Figure 100: East Asia Navigation, Imaging and Positioning Solutions Market Value (US$ Mn) by Country, 2022-2032
Figure 101: East Asia Navigation, Imaging and Positioning Solutions Market Value (US$ Mn) Analysis by Country, 2017-2032
Figure 102: East Asia Navigation, Imaging and Positioning Solutions Market Volume (Units) Analysis by Country, 2017-2032
Figure 103: East Asia Navigation, Imaging and Positioning Solutions Market Value Share (%) and BPS Analysis by Country, 2022-2032
Figure 104: East Asia Navigation, Imaging and Positioning Solutions Market Y-o-Y Growth (%) Projections by Country, 2022-2032
Figure 105: East Asia Navigation, Imaging and Positioning Solutions Market Value (US$ Mn) Analysis by Component, 2017-2032
Figure 106: East Asia Navigation, Imaging and Positioning Solutions Market Volume (Units) Analysis by Component, 2017-2032
Figure 107: East Asia Navigation, Imaging and Positioning Solutions Market Value Share (%) and BPS Analysis by Component, 2022-2032
Figure 108: East Asia Navigation, Imaging and Positioning Solutions Market Y-o-Y Growth (%) Projections by Component, 2022-2032
Figure 109: East Asia Navigation, Imaging and Positioning Solutions Market Value (US$ Mn) Analysis by Technology, 2017-2032
Figure 110: East Asia Navigation, Imaging and Positioning Solutions Market Volume (Units) Analysis by Technology, 2017-2032
Figure 111: East Asia Navigation, Imaging and Positioning Solutions Market Value Share (%) and BPS Analysis by Technology, 2022-2032
Figure 112: East Asia Navigation, Imaging and Positioning Solutions Market Y-o-Y Growth (%) Projections by Technology, 2022-2032
Figure 113: East Asia Navigation, Imaging and Positioning Solutions Market Value (US$ Mn) Analysis by Application, 2017-2032
Figure 114: East Asia Navigation, Imaging and Positioning Solutions Market Volume (Units) Analysis by Application, 2017-2032
Figure 115: East Asia Navigation, Imaging and Positioning Solutions Market Value Share (%) and BPS Analysis by Application, 2022-2032
Figure 116: East Asia Navigation, Imaging and Positioning Solutions Market Y-o-Y Growth (%) Projections by Application, 2022-2032
Figure 117: East Asia Navigation, Imaging and Positioning Solutions Market Attractiveness by Component, 2022-2032
Figure 118: East Asia Navigation, Imaging and Positioning Solutions Market Attractiveness by Technology, 2022-2032
Figure 119: East Asia Navigation, Imaging and Positioning Solutions Market Attractiveness by Application, 2022-2032
Figure 120: East Asia Navigation, Imaging and Positioning Solutions Market Attractiveness by Country, 2022-2032
Figure 121: South Asia & Pacific Navigation, Imaging and Positioning Solutions Market Value (US$ Mn) by Component, 2022-2032
Figure 122: South Asia & Pacific Navigation, Imaging and Positioning Solutions Market Value (US$ Mn) by Technology, 2022-2032
Figure 123: South Asia & Pacific Navigation, Imaging and Positioning Solutions Market Value (US$ Mn) by Application, 2022-2032
Figure 124: South Asia & Pacific Navigation, Imaging and Positioning Solutions Market Value (US$ Mn) by Country, 2022-2032
Figure 125: South Asia & Pacific Navigation, Imaging and Positioning Solutions Market Value (US$ Mn) Analysis by Country, 2017-2032
Figure 126: South Asia & Pacific Navigation, Imaging and Positioning Solutions Market Volume (Units) Analysis by Country, 2017-2032
Figure 127: South Asia & Pacific Navigation, Imaging and Positioning Solutions Market Value Share (%) and BPS Analysis by Country, 2022-2032
Figure 128: South Asia & Pacific Navigation, Imaging and Positioning Solutions Market Y-o-Y Growth (%) Projections by Country, 2022-2032
Figure 129: South Asia & Pacific Navigation, Imaging and Positioning Solutions Market Value (US$ Mn) Analysis by Component, 2017-2032
Figure 130: South Asia & Pacific Navigation, Imaging and Positioning Solutions Market Volume (Units) Analysis by Component, 2017-2032
Figure 131: South Asia & Pacific Navigation, Imaging and Positioning Solutions Market Value Share (%) and BPS Analysis by Component, 2022-2032
Figure 132: South Asia & Pacific Navigation, Imaging and Positioning Solutions Market Y-o-Y Growth (%) Projections by Component, 2022-2032
Figure 133: South Asia & Pacific Navigation, Imaging and Positioning Solutions Market Value (US$ Mn) Analysis by Technology, 2017-2032
Figure 134: South Asia & Pacific Navigation, Imaging and Positioning Solutions Market Volume (Units) Analysis by Technology, 2017-2032
Figure 135: South Asia & Pacific Navigation, Imaging and Positioning Solutions Market Value Share (%) and BPS Analysis by Technology, 2022-2032
Figure 136: South Asia & Pacific Navigation, Imaging and Positioning Solutions Market Y-o-Y Growth (%) Projections by Technology, 2022-2032
Figure 137: South Asia & Pacific Navigation, Imaging and Positioning Solutions Market Value (US$ Mn) Analysis by Application, 2017-2032
Figure 138: South Asia & Pacific Navigation, Imaging and Positioning Solutions Market Volume (Units) Analysis by Application, 2017-2032
Figure 139: South Asia & Pacific Navigation, Imaging and Positioning Solutions Market Value Share (%) and BPS Analysis by Application, 2022-2032
Figure 140: South Asia & Pacific Navigation, Imaging and Positioning Solutions Market Y-o-Y Growth (%) Projections by Application, 2022-2032
Figure 141: South Asia & Pacific Navigation, Imaging and Positioning Solutions Market Attractiveness by Component, 2022-2032
Figure 142: South Asia & Pacific Navigation, Imaging and Positioning Solutions Market Attractiveness by Technology, 2022-2032
Figure 143: South Asia & Pacific Navigation, Imaging and Positioning Solutions Market Attractiveness by Application, 2022-2032
Figure 144: South Asia & Pacific Navigation, Imaging and Positioning Solutions Market Attractiveness by Country, 2022-2032
Figure 145: MEA Navigation, Imaging and Positioning Solutions Market Value (US$ Mn) by Component, 2022-2032
Figure 146: MEA Navigation, Imaging and Positioning Solutions Market Value (US$ Mn) by Technology, 2022-2032
Figure 147: MEA Navigation, Imaging and Positioning Solutions Market Value (US$ Mn) by Application, 2022-2032
Figure 148: MEA Navigation, Imaging and Positioning Solutions Market Value (US$ Mn) by Country, 2022-2032
Figure 149: MEA Navigation, Imaging and Positioning Solutions Market Value (US$ Mn) Analysis by Country, 2017-2032
Figure 150: MEA Navigation, Imaging and Positioning Solutions Market Volume (Units) Analysis by Country, 2017-2032
Figure 151: MEA Navigation, Imaging and Positioning Solutions Market Value Share (%) and BPS Analysis by Country, 2022-2032
Figure 152: MEA Navigation, Imaging and Positioning Solutions Market Y-o-Y Growth (%) Projections by Country, 2022-2032
Figure 153: MEA Navigation, Imaging and Positioning Solutions Market Value (US$ Mn) Analysis by Component, 2017-2032
Figure 154: MEA Navigation, Imaging and Positioning Solutions Market Volume (Units) Analysis by Component, 2017-2032
Figure 155: MEA Navigation, Imaging and Positioning Solutions Market Value Share (%) and BPS Analysis by Component, 2022-2032
Figure 156: MEA Navigation, Imaging and Positioning Solutions Market Y-o-Y Growth (%) Projections by Component, 2022-2032
Figure 157: MEA Navigation, Imaging and Positioning Solutions Market Value (US$ Mn) Analysis by Technology, 2017-2032
Figure 158: MEA Navigation, Imaging and Positioning Solutions Market Volume (Units) Analysis by Technology, 2017-2032
Figure 159: MEA Navigation, Imaging and Positioning Solutions Market Value Share (%) and BPS Analysis by Technology, 2022-2032
Figure 160: MEA Navigation, Imaging and Positioning Solutions Market Y-o-Y Growth (%) Projections by Technology, 2022-2032
Figure 161: MEA Navigation, Imaging and Positioning Solutions Market Value (US$ Mn) Analysis by Application, 2017-2032
Figure 162: MEA Navigation, Imaging and Positioning Solutions Market Volume (Units) Analysis by Application, 2017-2032
Figure 163: MEA Navigation, Imaging and Positioning Solutions Market Value Share (%) and BPS Analysis by Application, 2022-2032
Figure 164: MEA Navigation, Imaging and Positioning Solutions Market Y-o-Y Growth (%) Projections by Application, 2022-2032
Figure 165: MEA Navigation, Imaging and Positioning Solutions Market Attractiveness by Component, 2022-2032
Figure 166: MEA Navigation, Imaging and Positioning Solutions Market Attractiveness by Technology, 2022-2032
Figure 167: MEA Navigation, Imaging and Positioning Solutions Market Attractiveness by Application, 2022-2032
Figure 168: MEA Navigation, Imaging and Positioning Solutions Market Attractiveness by Country, 2022-2032
The overall market size for the navigation, imaging and positioning solutions market was USD 11,290.3 Million in 2025.
The navigation, imaging and positioning solutions market is expected to reach USD 121,310.4 Million in 2035.
The demand for navigation, imaging and positioning solutions is rising due to growing defense modernization programs, increasing need for high-precision targeting and surveillance, and the adoption of advanced inertial navigation technologies. Strategic investments in national security and aerospace innovation are also fueling growth.
The top 5 countries driving the development of the navigation, imaging and positioning solutions market are the USA, China, Russia, Israel, and France.
Defense applications and inertial navigation technologies are expected to command a significant share over the assessment period.
Explore Similar Insights
Thank you!
You will receive an email from our Business Development Manager. Please be sure to check your SPAM/JUNK folder too.